EX-99.34
Published on
Exhibit 99.34
NI 43-101 TECHNICAL REPORT
FEASIBILITY STUDY OF THE SOTO
NORTE GOLD PROJECT, SANTANDER,
COLOMBIA
Effective Date January 01, 2021
Prepared For
Aris Gold Corporation
550 Burrard Street, Suite 2900
Vancouver, British Columbia
V6C 0A3
Canada
Report Prepared by
SRK Consulting (UK) Limited
UK31511
SRK Qualified Persons
Ben Parsons MSc, MAusIMM(CP)
Chris Bray BEng, MAusIMM(CP)
Dr John Willis PhD, BE (MET), MAusIMM(CP)
SNC-Lavalin Qualified Person
Dr Henri Sangam, Ph.D., P.Eng.
Minesa Qualified Person
Robert Anderson P.Eng.
| SRK Consulting | Soto Norte NI 43-101– Feasibility Study |
|
COPYRIGHT AND DISCLAIMER
Copyright (and any other applicable intellectual property rights) in this document and any accompanying data or models which are created by SRK Consulting (UK) Limited (“SRK”) is reserved by SRK and is protected by international copyright and other laws. Copyright in any component parts of this document such as images is owned and reserved by the copyright owner so noted within this document.
The use of this document is strictly subject to terms licensed by SRK to the named recipient or recipients of this document or persons to whom SRK has agreed that it may be transferred to (the “Recipients”). Unless otherwise agreed by SRK, this does not grant rights to any third party, except as permitted by law or stock exchange rule. This document may not be utilised or relied upon for any purpose other than that for which it is stated within and SRK shall not be liable for any loss or damage caused by such use or reliance.
This document shall only be distributed to any third party in full as provided by SRK and may not be reproduced or circulated in the public domain (in whole or in part) or in any edited, abridged or otherwise amended form unless expressly agreed by SRK or as required by Aris Gold Corporation by law or stock exchange rule. In the event that this document is disclosed or distributed to any third party, except as permitted by law or stock exchange rule, no such third party shall be entitled to place reliance upon any information, warranties or representations which may be contained within this document.
© SRK Consulting (UK) Limited 2020 version: Jun21_v1
|
| SRK Legal Entity: | SRK Consulting (UK) Limited | |||
| SRK Address: | 5th Floor Churchill House | |||
| 17 Churchill Way | ||||
| Cardiff, CF10 2HH | ||||
| Wales, United Kingdom. | ||||
| Date: | Aris Gold | |||
| Project Number: | UK31511 | |||
| SRK Project Director: Richard Oldcorn | Corporate Consultant (Due Diligence) | |||
| SRK Project Manager: Chris Bray | Principal Consultant (Mining) | |||
| Client Legal Entity: | Aris Gold Corporation | |||
| Client Address: | 550 Burrard Street, Suite 2900 | |||
| Vancouver, British Columbia | ||||
| V6C 0A3 | ||||
| Canada
| ||||
| Effective Date January 1, 2021 | Aris Gold | |||
| SRK Consulting | Soto Norte NI 43-101– Feasibility Study |
Table of Contents
| 1 | SUMMARY |
1 | ||||||
| 1.1 | Introduction |
1 | ||||||
| 1.2 | Terms of Reference |
1 | ||||||
| 1.3 | Property Description and Ownership |
1 | ||||||
| 1.4 | Status of Exploration, Development, and Operations |
2 | ||||||
| 1.5 | Geology and Mineralisation |
3 | ||||||
| 1.6 | Metallurgical Testwork and Mineral Processing |
3 | ||||||
| 1.7 | Mineral Resource Estimate |
4 | ||||||
| 1.8 | Mineral Reserve Estimate |
6 | ||||||
| 1.9 | Mining Methods |
8 | ||||||
| 1.9.1 Mine Design |
8 | |||||||
| 1.9.2 Mine Schedule |
8 | |||||||
| 1.10 | Recovery Methods |
9 | ||||||
| 1.11 | Project Infrastructure |
11 | ||||||
| 1.11.1 Introduction |
11 | |||||||
| 1.11.2 Power |
11 | |||||||
| 1.11.3 Dry Filtered Tailings and Waste Management |
11 | |||||||
| 1.11.4 Water Management |
12 | |||||||
| 1.12 | Permitting, Social and Community Impact, and Environment |
14 | ||||||
| 1.12.1 Permitting |
14 | |||||||
| 1.12.2 Social Setting |
16 | |||||||
| 1.12.3 Management Approach and Corporate Social Responsibility |
16 | |||||||
| 1.12.4 Land Acquisition and Resettlement |
17 | |||||||
| 1.12.5 Artisanal Mining and Historical Liabilities |
18 | |||||||
| 1.12.6 Environmental Setting |
18 | |||||||
| 1.12.7 Water Management |
19 | |||||||
| 1.13 | Cost Estimates |
20 | ||||||
| 1.13.1 Capital Costs |
20 | |||||||
| 1.13.2 Operating Costs |
21 | |||||||
| 1.14 | Economic Analysis |
23 | ||||||
| 1.15 | Conclusions |
25 | ||||||
| 1.16 | Recommendations |
27 | ||||||
| 2 | INTRODUCTION |
30 | ||||||
| 2.1 | Terms of Reference and Purpose of the Report |
30 | ||||||
| 2.2 | Qualified Persons and Details of Site Inspection |
30 | ||||||
| Effective Date January 1, 2021 | Aris Gold | |||
| Page i of xviii |
| SRK Consulting | Soto Norte NI 43-101– Feasibility Study |
| 2.3 | Sources of Information |
33 | ||||||
| 2.4 | Effective Date |
33 | ||||||
| 2.5 | Units of Measure |
34 | ||||||
| 3 | RELIANCEON OTHER EXPERTS |
35 | ||||||
| 3.1 | Introduction |
35 | ||||||
| 3.2 | Mineral Tenure, Surface Rights and Royalties |
35 | ||||||
| 3.3 | Market Studies, Contracts, and Logistics |
35 | ||||||
| 4 | PROPERTYDESCRIPTION AND LOCATION |
36 | ||||||
| 4.1 | Project Location |
36 | ||||||
| 4.2 | Property Ownership |
38 | ||||||
| 4.3 | Concessions (Titles) |
38 | ||||||
| 4.4 | Surface Rights and Access |
43 | ||||||
| 4.5 | Royalties and Encumbrances |
43 | ||||||
| 4.5.1 Insurance Bond |
43 | |||||||
| 4.6 | Environmental Liabilities and Permitting |
43 | ||||||
| 4.6.1 Potentially Material Environmental and Social Matters |
43 | |||||||
| 4.6.2 Required Permits and Status |
44 | |||||||
| 4.7 | Other Significant Factors and Risks |
44 | ||||||
| 5 | ACCESSIBILITY,CLIMATE, LOCAL RESOURCES, INFRASTRUCTURE, AND PHYSIOGRAPHY |
45 | ||||||
| 5.1 | Project Setting |
45 | ||||||
| 5.2 | Accessibility |
45 | ||||||
| 5.3 | Climate |
46 | ||||||
| 5.4 | Local Resources and Infrastructure |
46 | ||||||
| 5.5 | Physiography |
48 | ||||||
| 5.6 | Seismicity |
48 | ||||||
| 6 | HISTORY |
50 | ||||||
| 6.1 | Ownership |
50 | ||||||
| 6.2 | Exploration History |
51 | ||||||
| 6.2.1 Ventana |
51 | |||||||
| 6.2.2 AUX |
51 | |||||||
| 6.2.3 Galway Resources |
51 | |||||||
| 6.2.4 Calvista Gold Corporation |
52 | |||||||
| 6.2.5 Minesa |
52 | |||||||
| 6.3 | Historical Mineral Resource Estimates |
52 | ||||||
| 6.3.1 Samuel Engineering, November 2010 |
53 | |||||||
| 6.3.2 Coffey Mining, July 2012 |
53 | |||||||
| Effective Date January 1, 2021 | Aris Gold | |||
| Page ii of xviii |
| SRK Consulting | Soto Norte NI 43-101– Feasibility Study |
| 6.3.3 Coffey Mining, January 2013 |
53 | |||||||
| 6.3.4 SRK, February 2016 |
54 | |||||||
| 6.3.5 SRK, January 2017 |
54 | |||||||
| 6.3.6 SRK, July 2017 |
54 | |||||||
| 6.4 | Historical Mineral Reserve Estimates |
55 | ||||||
| 6.4.1 SRK, August 2017 |
55 | |||||||
| 6.5 | Recent studies Completed on the Soto Norte Project |
55 | ||||||
| 6.6 | Historic Production |
56 | ||||||
| 7 | GEOLOGICAL SETTING AND MINERALISATION |
57 | ||||||
| 7.1 | Regional Geological Setting |
57 | ||||||
| 7.2 | Local Geological Setting |
58 | ||||||
| 7.3 | Property Geological Setting |
63 | ||||||
| 7.3.1 Summary of the Property Geology |
63 | |||||||
| 7.3.2 Bucaramanga Complex |
63 | |||||||
| 7.3.3 Santander Plutonic Group |
63 | |||||||
| 7.3.4 Sedimentary Rocks |
64 | |||||||
| 7.3.5 Porphyries |
64 | |||||||
| 7.3.6 Structural Geology |
64 | |||||||
| 7.3.7 Alteration |
68 | |||||||
| 7.3.8 Mineralisation |
69 | |||||||
| 7.3.9 Mineralisation Age and Paragenesis |
70 | |||||||
| 7.3.10 Mineralogy |
71 | |||||||
| 8 | DEPOSIT TYPES |
73 | ||||||
| 9 | EXPLORATION |
76 | ||||||
| 9.1 | Historical Exploration |
76 | ||||||
| 9.1.1 2006 – 2011 Ventana |
76 | |||||||
| 9.1.2 2011 – 2013 AUX Colombia |
76 | |||||||
| 9.1.3 2015 – 2017 Minesa |
76 | |||||||
| 9.1.4 LIDAR and Orthophoto Surveys |
77 | |||||||
| 9.1.5 Topographic Field Surveys |
77 | |||||||
| 9.2 | Geochemical Sampling |
81 | ||||||
| 9.3 | Mapping, Surveying and Sampling of Old Mine Workings |
86 | ||||||
| 9.4 | ArialGeophysical Surveys |
88 | ||||||
| 10 | DRILLING |
94 | ||||||
| 10.1 | Drilling Grids |
98 | ||||||
| 10.2 | Drilling Procedures |
99 | ||||||
| Effective Date January 1, 2021 | Aris Gold | |||
| Page iii of xviii |
| SRK Consulting | Soto Norte NI 43-101– Feasibility Study |
| 10.3 | Drillhole Surveying |
99 | ||||||
| 10.4 | Drillhole Orientation |
100 | ||||||
| 10.5 | Conclusions and Recommendations |
100 | ||||||
| 11 | SAMPLE PREPARATION, ANALYSIS AND SECURITY |
101 | ||||||
| 11.1 | Introduction |
101 | ||||||
| 11.2 | Ventana |
101 | ||||||
| 11.3 | AUX Colombia |
103 | ||||||
| 11.4 | Minesa |
106 | ||||||
| 11.5 | QA/QC Review |
120 | ||||||
| 11.6 | Procedures |
120 | ||||||
| 11.6.1 QA/QC Program 2006 – 2013 |
120 | |||||||
| 11.6.2 Minesa Protocols |
122 | |||||||
| 11.6.3 Certified Reference Material |
128 | |||||||
| 11.6.4 Blanks |
129 | |||||||
| 11.6.5 Duplicates |
130 | |||||||
| 11.6.6 Database Management |
132 | |||||||
| 11.6.7 Core Logs |
132 | |||||||
| 11.7 | Conclusions and Recommendations |
133 | ||||||
| 12 | DATA VERIFICATION |
134 | ||||||
| 12.1 | Introduction |
134 | ||||||
| 12.2 | Verification by the Company |
134 | ||||||
| 12.3 | Verification by SRK |
134 | ||||||
| 12.3.1 Site Visit |
134 | |||||||
| 12.3.2 Sample Database |
135 | |||||||
| 12.4 | Qualified Person’s Opinion |
135 | ||||||
| 13 | MINERAL PROCESSING AND METALLURGICAL TESTING |
137 | ||||||
| 13.1 | Introduction |
137 | ||||||
| 13.2 | Ventana Scoping Study, 2010 |
137 | ||||||
| 13.2.1 Samples |
137 | |||||||
| 13.2.2 Head Assay and Mineralogy |
140 | |||||||
| 13.2.3 Comminution |
140 | |||||||
| 13.2.4 Gravity Separation and Flotation |
140 | |||||||
| 13.2.5 Environmental Characterisation |
141 | |||||||
| 13. | AUX Scoping Study, 2012 |
141 | ||||||
| 13.3.1 Samples |
141 | |||||||
| 13.3.2 Head Assay and Mineralogy |
141 | |||||||
| Effective Date January 1, 2021 | Aris Gold | |||
| Page iv of xviii |
| SRK Consulting | Soto Norte NI 43-101– Feasibility Study |
| 13.3.3 Comminution |
142 | |||||||
| 13.3.4 Gravity Separation and Flotation |
143 | |||||||
| 13.3.5 Thickening and Filtration |
143 | |||||||
| 13.3.6 Environmental Characterisation |
143 | |||||||
| 13.4 | Minesa PFS, 2017 |
144 | ||||||
| 13.4.1 Samples |
144 | |||||||
| 13.4.2 Head Assay and Mineralogy |
144 | |||||||
| 13.4.3 Comminution |
145 | |||||||
| 13.4.4 Gravity Separation and Flotation |
145 | |||||||
| 13.4.5 Thickening and Filtration |
147 | |||||||
| 13.4.6 Environmental Characterisation |
147 | |||||||
| 13.5 | Minesa, 2018 |
147 | ||||||
| 13.5.1 Samples |
147 | |||||||
| 13.5.2 Head Assay and Mineralogy |
147 | |||||||
| 13.5.3 Flotation |
148 | |||||||
| 13.5.4 Thickening and Filtration |
149 | |||||||
| 13.6 | Minesa, 2019 |
149 | ||||||
| 13.6.1 Samples |
149 | |||||||
| 13.6.2 Comminution |
149 | |||||||
| 13.6.3 Flotation |
149 | |||||||
| 13.7 | Recovery Assumptions |
150 | ||||||
| 13.8 | Conclusions and Recommendations |
151 | ||||||
| 14 | MINERAL RESOURCE ESTIMATES |
152 | ||||||
| 14.1 | Introduction |
152 | ||||||
| 14.2 | Resource Database |
152 | ||||||
| 14.3 | Geological Interpretation and Modelling |
153 | ||||||
| 14.4 | Structural Model |
153 | ||||||
| 14.5 | Mineralisation Model |
154 | ||||||
| 14.6 | Waste Model |
159 | ||||||
| 14.7 | Bulk Density |
159 | ||||||
| 14.8 | Mineral Resource Estimation Methodology |
162 | ||||||
| 14.8.1 Introduction |
162 | |||||||
| 14.8.2 Composite Strategy |
163 | |||||||
| 14.8.3 Estimation Domain Analysis |
164 | |||||||
| 14.8.4 Capping Strategy |
168 | |||||||
| 14.8.5 Grade Correlations |
172 | |||||||
| 14.8.6 Variography |
173 | |||||||
| Effective Date January 1, 2021 | Aris Gold | |||
| Page v of xviii |
| SRK Consulting | Soto Norte NI 43-101– Feasibility Study |
| 14.8.7 Block Model Parameters |
174 | |||||||
| 14.8.8 Estimation |
176 | |||||||
| 14.9 | Estimation Validation |
182 | ||||||
| 14.9.1 Visual Validation |
183 | |||||||
| 14.9.2 Comparative Statistics |
184 | |||||||
| 14.9.3 Swath Plots |
186 | |||||||
| 14.10 | Classification |
187 | ||||||
| 14.11 | Mineral Resource Estimate Summary |
188 | ||||||
| 14.11.1 Factors That May Affect the Mineral Resource Estimate |
189 | |||||||
| 14.12 | Grade Sensitivity Analysis |
191 | ||||||
| 14.13 | Relevant Factors |
191 | ||||||
| 15 | MINERAL RESERVE ESTIMATES |
192 | ||||||
| 15.1 | Introduction |
192 | ||||||
| 15.2 | Modifying Factors |
192 | ||||||
| 15.3 | NSR Value and Cut-Off Approach |
193 | ||||||
| 15.4 | Mineral Reserve Estimate Summary |
196 | ||||||
| 15.4.1 Factors That May Affect the Mineral Reserve Estimate |
197 | |||||||
| 15.5 | Relevant Factors |
197 | ||||||
| 16 | MINING METHODS |
199 | ||||||
| 16.1 | Introduction |
199 | ||||||
| 16.2 | Mining Access and Layout |
200 | ||||||
| 16.2.1 Tunnel Access |
200 | |||||||
| 16.2.2 Tunnel Profiles and Development |
204 | |||||||
| 16.3 | Mine Geotechnical |
206 | ||||||
| 16.3.1 Introduction |
206 | |||||||
| 16.3.2 Work Summary |
206 | |||||||
| 16.3.3 Conclusions and Recommendations |
208 | |||||||
| 16.4 | Mine Water Management |
209 | ||||||
| 16.4.1 Introduction |
209 | |||||||
| 16.4.2 Surface Water Management |
211 | |||||||
| 16.4.3 Ground Water Management |
212 | |||||||
| 16.5 | Mining Method |
226 | ||||||
| 16.5.1 Introduction |
226 | |||||||
| 16.5.2 Modified Avoca |
227 | |||||||
| 16.5.3 Mine Backfill |
238 | |||||||
| 16.5.4 Mining Method Justification |
239 | |||||||
| 16.5.5 Backfill Material Source Justification |
239 | |||||||
| Effective Date January 1, 2021 | Aris Gold | |||
| Page vi of xviii |
| SRK Consulting | Soto Norte NI 43-101– Feasibility Study |
| 16.6 | Mine Production |
240 | ||||||
| 16.7 | Stope Design Approach |
242 | ||||||
| 16.7.1 Introduction |
242 | |||||||
| 16.7.2 Stope Optimisation |
242 | |||||||
| 16.7.3 Stope Shape Screening |
243 | |||||||
| 16.7.4 Longhole Production |
243 | |||||||
| 16.7.5 Quarry Waste Stopes |
244 | |||||||
| 16.8 | Materials Handling and Mine Equipment |
246 | ||||||
| 16.8.1 Introduction |
246 | |||||||
| 16.8.2 Mine Equipment |
246 | |||||||
| 16.8.3 Heavy Haulage (TKM) Assessment |
249 | |||||||
| 16.9 | Life of Mine Planning |
250 | ||||||
| 16.9.1 Scheduling Methodology |
250 | |||||||
| 16.9.2 Development and Mining Sequence |
250 | |||||||
| 16.9.3 Stope Schedule |
251 | |||||||
| 16.10 | Schedule Results |
251 | ||||||
| 16.10.1 Equipment Estimates |
262 | |||||||
| 16.10.2 Mine Personnel |
263 | |||||||
| 16.11 | Underground Mine Infrastructure |
266 | ||||||
| 16.11.1 Introduction |
266 | |||||||
| 16.11.2 Mine Electrical |
266 | |||||||
| 16.11.3 Mine Maintenance Workshop and Store |
267 | |||||||
| 16.11.4 Fuel Bays |
267 | |||||||
| 16.11.5 Explosive Magazines |
267 | |||||||
| 16.11.6 Lunchrooms, Store and Offices |
267 | |||||||
| 16.11.7 Underground Water Supply |
267 | |||||||
| 16.11.8 Mine Dewatering |
268 | |||||||
| 16.12 | Mine Ventilation |
268 | ||||||
| 16.12.1 Introduction |
268 | |||||||
| 16.12.2 Airflow Requirements |
269 | |||||||
| 16.12.3 TBM Ventilation System Design |
269 | |||||||
| 16.12.4 Modelling Summary |
270 | |||||||
| 16.12.5 Level Ventilation and Duct Design |
270 | |||||||
| 16.12.6 Staged Ventilation Models |
271 | |||||||
| 16.12.7 Summary of Ventilation Approach |
273 | |||||||
| 16.13 | Conclusions and Recommendations |
274 | ||||||
| 17 | RECOVERY METHODS |
275 | ||||||
| Effective Date January 1, 2021 | Aris Gold | |||
| Page vii of xviii |
| SRK Consulting | Soto Norte NI 43-101– Feasibility Study |
| 17.1 | Process Plant Overview |
275 | ||||||
| 17.2 | Design Criteria |
276 | ||||||
| 17.3 | Detailed Description |
278 | ||||||
| 17.3.1 Primary Crushing and Ore Transfer to Surface |
278 | |||||||
| 17.3.2 Coarse Ore Stockpile and Reclaim |
279 | |||||||
| 17.3.3 Grinding and Pebble Recycle |
279 | |||||||
| 17.3.4 Copper and Pyrite Flotation |
280 | |||||||
| 17.3.5 Concentrate Dewatering, Storage and Load Out |
282 | |||||||
| 17.3.6 Thickened Tailings Dewatering and Disposal |
283 | |||||||
| 17.3.7 Reagents and Consumables |
283 | |||||||
| 17.3.8 Process Plant Support Facilities and Utilities |
284 | |||||||
| 17.3.9 Air Services |
285 | |||||||
| 17.4 | Conclusions and Recommendations |
286 | ||||||
| 18 | PROJECT INFRASTRUCTURE |
288 | ||||||
| 18.1 | Introduction |
288 | ||||||
| 18.1.1 Base Surveys and Design Criteria |
291 | |||||||
| 18.2 | On-site Infrastructure |
292 | ||||||
| 18.2.1 Box-Cut |
292 | |||||||
| 18.2.2 Terraces |
292 | |||||||
| 18.2.3 Roads and Bridges |
293 | |||||||
| 18.2.4 Camp |
293 | |||||||
| 18.2.5 Infrastructure and Utilities |
294 | |||||||
| 18.2.6 Technology and Information Infrastructure |
295 | |||||||
| 18.2.7 Conclusions and Recommendations |
296 | |||||||
| 18.3 | Bulk Power Supply |
296 | ||||||
| 18.3.1 Conclusions and Recommendations |
297 | |||||||
| 18.4 | Off-Site Roads and Upgrades |
297 | ||||||
| 18.4.1 Conclusions and Recommendations |
298 | |||||||
| 18.5 | Off-site Logistics |
298 | ||||||
| 18.5.1 Introduction |
298 | |||||||
| 18.5.2 Impala Terminal River Port and Fluvial Transport |
299 | |||||||
| 18.5.3 Road Haulage Operations |
299 | |||||||
| 18.5.4 Container Loading |
299 | |||||||
| 18.6 | Dry Filtered Tailings and Waste Management |
299 | ||||||
| 18.6.1 Introduction |
299 | |||||||
| 18.6.2 DSF Design Development |
300 | |||||||
| 18.6.3 Design Criteria |
301 | |||||||
| Effective Date January 1, 2021 | Aris Gold | |||
| Page viii of xviii |
| SRK Consulting | Soto Norte NI 43-101– Feasibility Study |
| 18.6.4 Deposition Plan |
301 | |||||||
| 18.6.5 Water Management |
302 | |||||||
| 18.6.6 DSF Design |
302 | |||||||
| 18.6.7 DSF Stability Analyses |
307 | |||||||
| 18.6.8 Instrumentation and Monitoring |
307 | |||||||
| 18.6.9 Closure Concept |
307 | |||||||
| 18.6.10 Construction and Operation Considerations |
307 | |||||||
| 18.6.11 Conclusions and Recommendations |
308 | |||||||
| 18.7 | Water Management |
309 | ||||||
| 18.7.1 Water Balance |
309 | |||||||
| 18.7.2 Water Treatment |
309 | |||||||
| 18.7.3 Water Management During Closure |
313 | |||||||
| 19 | MARKET STUDIES AND CONTRACTS |
315 | ||||||
| 19.1 | Introduction |
315 | ||||||
| 19.2 | Commercial Terms for Copper Concentrate |
315 | ||||||
| 19.2.1 Copper Payables |
315 | |||||||
| 19.2.2 Gold Payables |
315 | |||||||
| 19.2.3 Silver Payables |
315 | |||||||
| 19.2.4 Deductions and Penalties |
315 | |||||||
| 19.3 | Indicative Terms for Pyrite Concentrate |
317 | ||||||
| 19.4 | Logistics |
317 | ||||||
| 19.5 | Confirmation by the Qualified Person |
317 | ||||||
| 20 | ENVIRONMENTAL STUDIES, PERMITTING, AND SOCIAL OR COMMUNITY IMPACT |
318 | ||||||
| 20.1 | Introduction |
318 | ||||||
| 20.2 | Environmental and Social Setting |
318 | ||||||
| 20.3 | Legal, Permitting, and Project Approvals |
320 | ||||||
| 20.3.1 Mining Legal Framework and Approvals |
320 | |||||||
| 20.3.2 Environmental Legal Framework |
323 | |||||||
| 20.3.3 ESIA Process History and Status |
323 | |||||||
| 20.3.4 Permits and Penalties |
325 | |||||||
| 20.4 | Management Approach |
326 | ||||||
| 20.5 | Stakeholder Engagement and Social Licence to Operate |
330 | ||||||
| 20.5.1 Stakeholder Engagement |
330 | |||||||
| 20.5.2 Corporate Social Responsibility |
332 | |||||||
| 20.5.3 Social Licence to Operate |
332 | |||||||
| 20.6 | Management of Potentially Material Environmental and Social Matters |
333 | ||||||
| Effective Date January 1, 2021 | Aris Gold | |||
| Page ix of xviii |
| SRK Consulting | Soto Norte NI 43-101– Feasibility Study |
| 20.6.1 Water Resource Management |
333 | |||||||
| 20.6.2 Cultural Heritage and Archaeology |
336 | |||||||
| 20.6.3 Land Acquisition and Resettlement |
336 | |||||||
| 20.6.4 Local Community Participation |
337 | |||||||
| 20.6.5 Artisanal Mining and Historical Liabilities |
338 | |||||||
| 20.7 | Closure Requirements and Costs |
339 | ||||||
| 20.8 | Conclusion, Risks and Opportunities |
340 | ||||||
| 21 | CAPITAL AND OPERATING COSTS |
342 | ||||||
| 21.1 | Capital Cost Estimates |
342 | ||||||
| 21.1.1 Introduction |
342 | |||||||
| 21.1.2 Estimate Classification |
342 | |||||||
| 21.1.3 General Estimation Methodology |
344 | |||||||
| 21.1.4 Indirect Costs |
346 | |||||||
| 21.1.5 Engineering, Procurement and Construction Management (EPCM) |
347 | |||||||
| 21.1.6 Owners Costs |
347 | |||||||
| 21.1.7 Estimate Provisions |
348 | |||||||
| 21.1.8 Capital Cost Summary |
348 | |||||||
| 21.1.9 Depreciation |
351 | |||||||
| 21.2 | Operating Cost Estimates |
351 | ||||||
| 21.2.1 Introduction |
351 | |||||||
| 21.2.2 Basis of Estimate |
351 | |||||||
| 21.2.3 Mine Operating Costs |
352 | |||||||
| 21.2.4 Process Operating Costs |
352 | |||||||
| 21.2.5 General and Administrative and Owner Operating Costs |
353 | |||||||
| 21.2.6 Other Operating Costs |
353 | |||||||
| 21.2.7 Operating Cost Summary |
354 | |||||||
| 22 | ECONOMIC ANALYSIS |
357 | ||||||
| 22.1 | Introduction |
357 | ||||||
| 22.2 | Project Schedule |
357 | ||||||
| 22.3 | Taxes and Royalties |
360 | ||||||
| 22.4 | Marketing Assumptions |
360 | ||||||
| 22.5 | Commodity Prices and Gross Revenue |
360 | ||||||
| 22.6 | Economic Evaluation Results |
363 | ||||||
| 22.7 | Sensitivity |
366 | ||||||
| 22.8 | Conclusion |
366 | ||||||
| 23 | ADJACENT PROPERTIES |
367 | ||||||
| Effective Date January 1, 2021 | Aris Gold | |||
| Page x of xviii |
| SRK Consulting | Soto Norte NI 43-101– Feasibility Study |
| 24 | OTHER RELEVANT DATA AND INFORMATION |
368 | ||||||
| 24.1 | Project Execution Plan |
368 | ||||||
| 24.1.1 Introduction |
368 | |||||||
| 24.1.2 Policies and Guidelines |
368 | |||||||
| 24.1.3 Organisational Planning and Project Team |
369 | |||||||
| 24.1.4 Staffing Plan |
371 | |||||||
| 24.1.5 Project Execution Locations |
371 | |||||||
| 24.1.6 Health and Safety and Environment Plan |
372 | |||||||
| 24.1.7 Quality Management Plan |
372 | |||||||
| 24.1.8 Project Controls Execution Plan |
372 | |||||||
| 24.1.9 Engineering Project Execution Plan |
372 | |||||||
| 24.1.10 Procurement and Contracting Plan |
373 | |||||||
| 24.1.11 Construction Execution Plan |
373 | |||||||
| 24.1.12 Material Management Plan |
373 | |||||||
| 24.1.13 Commissioning Execution Plan |
373 | |||||||
| 24.1.14 Risk Management Plan |
374 | |||||||
| 24.1.15 Licencing and Permitting |
375 | |||||||
| 24.1.16 Financial and Administration Plan |
375 | |||||||
| 24.1.17 Human Resources Plan |
375 | |||||||
| 24.1.18 Project Close Out Plan |
375 | |||||||
| 25 | INTERPRETATIONS AND CONCLUSIONS |
376 | ||||||
| 25.1 | Introduction |
376 | ||||||
| 25.2 | Exploration, Drilling, Sampling and Data Collection |
376 | ||||||
| 25.3 | Mineral Processing, Metallurgical Testwork and Recovery Methods |
376 | ||||||
| 25.4 | Mine Planning |
376 | ||||||
| 25.5 | Environmental Studies, Permitting and Social or Community Impact |
377 | ||||||
| 25.6 | Markets and Contracts |
377 | ||||||
| 25.7 | Capital Cost Estimates |
378 | ||||||
| 25.8 | Operating Cost Estimates |
378 | ||||||
| 25.9 | Economic Analysis |
378 | ||||||
| 25.10 | Project Risks and Management |
378 | ||||||
| 25.11 | Project Opportunities |
379 | ||||||
| 25.12 | Conclusions |
380 | ||||||
| 26 | RECOMMENDATIONS |
381 | ||||||
| 26.1 | Forward Work Plan |
384 | ||||||
| 27 | REFERENCES |
I | ||||||
| Effective Date January 1, 2021 | Aris Gold | |||
| Page xi of xviii |
| SRK Consulting | Soto Norte NI 43-101– Feasibility Study |
List of Tables
| Table 1.1: |
Soto Norte Mineral Resources, Effective 22 May 2019 (1, 2, 3, 4) | 5 | ||||
| Table 1.2: |
Soto Norte Mineral Reserves, Effective 01 January 2021(1, 2, 3, 4) | 7 | ||||
| Table 1.3: |
Mineral Processing Production Summary | 10 | ||||
| Table 1.4: |
LoMP Capital Expenditure Estimate (excluding pre-production operating costs) | 21 | ||||
| Table 1.5: |
LoMP Operating Cost Estimate | 22 | ||||
| Table 1.6: |
Economic Evaluation Results | 23 | ||||
| Table 1.7: |
NPV at Variable Discount Rates | 24 | ||||
| Table 2.1: |
Qualified Persons and Contributors to this Technical Report | 32 | ||||
| Table 2.2: |
Details of Site Inspection by the Qualified Persons and Other Experts | 32 | ||||
| Table 4.1: |
Soto Norte Mine Titles (Source: Minesa) | 39 | ||||
| Table 4.2: |
Soto Norte Mining Title Status | 41 | ||||
| Table 5.1: |
Peak Ground Accelerations | 49 | ||||
| Table 6.1: |
Samuel Engineering Mineral Resource Estimate – November 2010 | 53 | ||||
| Table 6.2: |
Coffey Mining Mineral Resource Estimate – July 2012 | 53 | ||||
| Table 6.3: |
Coffey Mining Mineral Resource Estimate – January 2013 | 53 | ||||
| Table 6.4: |
SRK Mineral Resource Estimate – February 2016 | 54 | ||||
| Table 6.5: |
SRK Mineral Resource Estimate – January 2017 | 54 | ||||
| Table 6.6: |
SRK Mineral Resource Estimate – July 2017 | 55 | ||||
| Table 6.7: |
SRK Mineral Reserve Estimate – 01 August 2017 | 55 | ||||
| Table 8.1: |
Soto Norte Alteration Type according to Porphyry Copper Systems | 75 | ||||
| Table 9.1: |
Soto Norte Geophysics Survey Summary | 89 | ||||
| Table 10.1: |
Soto Norte Drilling Summary | 94 | ||||
| Table 10.2: |
Ideal Drill Spacing | 98 | ||||
| Table 11.1: |
Summary of Core Recovery From 2006 – 2016 | 109 | ||||
| Table 11.2: |
Sample Analytical Methods For 2016 Drilling | 116 | ||||
| Table 11.3: |
ALS Chemex ICP-AES Detection Limits | 117 | ||||
| Table 11.4: |
Summary of Core Logging and Sampling Procedures | 119 | ||||
| Table 11.5: |
Annual QA/QC Insertion Rates 2010 – 2013 | 121 | ||||
| Table 11.6: |
Ventana Twin and Pulp Duplicate Results 2006 – 2011 | 122 | ||||
| Table 11.7: |
AUX Twin and Pulp Duplicate Results 2011 – 2013 | 122 | ||||
| Table 11.8: |
Laboratory Assay Comparisons 2011 – 2013 | 122 | ||||
| Table 11.9: |
Standard Sample Accuracy Prior to 2014 | 122 | ||||
| Table 11.10: |
Standard Sample Accuracy and Bias prior to 2014 | 122 | ||||
| Table 11.11: |
QA/QC Sample Insertion Rate | 124 | ||||
| Table 11.12: |
Twin and Duplicate Sampling Results | 124 | ||||
| Table 11.13: |
Assay Standard Results | 124 | ||||
| Table 11.14: |
External Laboratory Assay Check Results | 124 | ||||
| Table 11.15: |
External Laboratory Assay Check Results | 125 | ||||
| Table 13.1: |
2011 Testwork Sample Head Assays | 140 | ||||
| Table 13.2: |
2011 Master Composite Comminution Testwork Results | 140 | ||||
| Table 13.3: |
2012 Testwork Composite Sample Head Assays | 142 | ||||
| Table 13.4: |
2012 MC3 Comminution Testwork Results | 142 | ||||
| Table 13.5: |
2017 Testwork Composite Sample Head Assays | 144 | ||||
| Table 13.6: |
2017 Coarse Rock Comminution Testwork Results | 145 | ||||
| Table 13.7: |
2018 Testwork Composite Sample Head Assays | 148 | ||||
| Table 13.8: |
Marketing Composite Concentrate Assays | 150 | ||||
| Table 13.9: |
Feasibility Study Metal Recovery Assumptions | 150 | ||||
| Table 14.1: |
Summary of Boreholes Used in Mineral Resource Estimate | 152 | ||||
| Table 14.2: |
Grade Estimation Domains | 156 | ||||
| Table 14.3: |
Bulk Density Summary Statistics of Main Vein Domains | 161 | ||||
| Table 14.4: |
Gold Statistics by Composite Length for Mascota Main Vein | 163 | ||||
| Table 14.5: |
Indicator Model Comparative Gold Statistics Example | 167 | ||||
| Table 14.6: |
Example of Gold Statistics Reviewed During Capping Analysis | 169 | ||||
| Table 14.7: |
Example of Gold Statistics Reviewed During Disintegration Capping Analysis | 170 |
| Effective Date January 1, 2021 | Aris Gold | |||
| Page xii of xviii |
| SRK Consulting | Soto Norte NI 43-101– Feasibility Study |
| Table 14.8: |
Summary of Raw vs Capped Composites for Major Veins | 171 | ||||
| Table 14.9: |
Block Model Parameters | 175 | ||||
| Table 14.10: |
Volume Comparison Between Wireframes and Block Models | 175 | ||||
| Table 14.11: |
Cut-Off Grades used in Sub Domaining and High-Grade Gold Restriction in Mascota and Gigante Main Veins | 177 | ||||
| Table 14.12: |
Example of Search Parameters Used for Mascota Vein | 179 | ||||
| Table 14.13: |
Summary of Estimation Method and High-Grade Gold Restriction in Main Vein Domains | 180 | ||||
| Table 14.14: |
Summary of Estimation Method and High-Grade Gold Restriction in Minor Vein Domains | 180 | ||||
| Table 14.15: |
Statistical Comparison of Composite and Estimated Grades by Estimation Method | 185 | ||||
| Table 14.16: |
Soto Norte Mineral Resources Effective 22 May 2019 (1, 2, 3, 4) | 190 | ||||
| Table 14.17: |
Indicated Estimates1 at a Range of NSR Cut-Offs | 191 | ||||
| Table 14.18: |
Inferred Estimates1, Soto Norte at a Range of NSR Cut-Offs | 191 | ||||
| Table 15.1: |
External Mining Dilution by Geotechnical Domain | 193 | ||||
| Table 15.2: |
Unplanned Mining Loss by Stope Width | 193 | ||||
| Table 15.3: |
NSR Cut-off Parameters | 193 | ||||
| Table 15.4: |
Linear Correlation Coefficients of NSR Formula | 194 | ||||
| Table 15.5: |
NSR Make-up by Individual Revenues and Charges | 194 | ||||
| Table 15.6: |
Soto Norte Mineral Reserves Effective 01 January 2021(1, 2, 3, 4) | 198 | ||||
| Table 16.1: |
Summary of Mining Methods | 199 | ||||
| Table 16.2: |
N’ Stability Ranges Used in Rock Mass Assessment for 30 m high / 15 m long Stopes | 207 | ||||
| Table 16.3: |
N’ Stability and Dilution Categories and Ground Support Requirements | 207 | ||||
| Table 16.4: |
Soto Norte Project Hydrogeological Units (Source: Ingetec & Minesa, 2020) | 214 | ||||
| Table 16.5: |
Groundwater Calibration Results by Elevation | 219 | ||||
| Table 16.6: |
Inflow Rate Assumptions Used in Dewatering Design | 221 | ||||
| Table 16.7: |
Objectives of Planned Grouting Operations | 223 | ||||
| Table 16.8: |
Curtain Drilling and Grouting Requirement Estimates | 226 | ||||
| Table 16.9: |
LoM Backfill Requirements | 238 | ||||
| Table 16.10: |
LoM Backfill Source | 238 | ||||
| Table 16.11: |
Mine Equipment and Productivity Assumptions | 248 | ||||
| Table 16.12: |
Mine Equipment Operating Factors | 248 | ||||
| Table 16.13: |
Other Mine Capital Items Operating Factors | 249 | ||||
| Table 16.14: |
Haulage Distances – Phase 1 | 249 | ||||
| Table 16.15: |
Haulage Distances – Phase 2 | 249 | ||||
| Table 16.16: |
Phase 3 – Haulage Distances | 250 | ||||
| Table 16.17: |
Truck Productivity Parameters | 250 | ||||
| Table 16.18: |
Ore Tonnage, Grade and Resource Classification Schedule | 255 | ||||
| Table 16.19: |
Material Movement and Backfill Schedule | 255 | ||||
| Table 16.20: |
Lateral and Vertical Development and Infrastructure Excavation Schedule | 256 | ||||
| Table 16.21: |
Production Drilling, Grade Control and tkm Schedule | 257 | ||||
| Table 16.22: |
Development Profiles and Ground Support by Geotechnical Classification | 257 | ||||
| Table 16.23: |
Ground Support Schedule | 259 | ||||
| Table 16.24: |
Drilling and Grouting Schedule for Development and Grout Curtains | 260 | ||||
| Table 16.25: |
Summary of main mining equipment for development and production | 265 | ||||
| Table 16.26: |
Initial purchase and replacement schedule of main mining equipment for development and production | 265 | ||||
| Table 16.27: |
Summary of annual mine personnel requirements | 265 | ||||
| Table 16.28: |
Mine Water Usage Requirements During Operational Period | 268 | ||||
| Table 16.29: |
Estimated Ventilation Infrastructure and Equipment Requirements | 274 | ||||
| Table 17.1: |
Mineral Processing Production Summary | 275 | ||||
| Table 17.2: |
Process Plant Design Criteria | 276 | ||||
| Table 17.3: |
Process Reagents and Consumables Consumption Rates | 283 | ||||
| Table 17.4: |
Annual Replacement Rates for Other Consumables | 284 | ||||
| Table 17.5: |
Summary of Water Intake Permits (Source: ESIA, 2019) | 284 | ||||
| Table 17.6: |
Summary of Water Discharge Permits (Source: ESIA, 2019) | 284 |
| Effective Date January 1, 2021 | Aris Gold | |||
| Page xiii of xviii |
| SRK Consulting | Soto Norte NI 43-101– Feasibility Study |
| Table 18.1: |
Road Design Parameters and Criteria | 291 | ||||
| Table 18.2: |
Minimum Safety Factors Required for Slope Stability | 292 | ||||
| Table 18.3: |
Minimum Safety Factors Required for DSF Stability | 292 | ||||
| Table 18.4: |
Cut and Fill Volume Balance | 292 | ||||
| Table 18.5: |
Power Requirements during Operation | 296 | ||||
| Table 18.6: |
Road Sections and Lengths | 298 | ||||
| Table 18.7: |
Minimum Factor of Safety (CDA, 2014) | 307 | ||||
| Table 19.1: |
Deductions to be applied to Copper Payables in the copper concentrate | 315 | ||||
| Table 19.2: |
Penalties on copper concentrate | 316 | ||||
| Table 20.1: |
Concession Contract Description and Requirements (Source: Minesa) | 322 | ||||
| Table 20.2: |
Environmental and Social Management Programmes | 326 | ||||
| Table 21.1: |
Capital Cost Estimate Responsibilities | 342 | ||||
| Table 21.2: |
Estimate Classification per WBS Level 1 | 342 | ||||
| Table 21.3: |
Class 3 Estimate Criteria | 343 | ||||
| Table 21.4: |
Major Packages and Costs Source | 344 | ||||
| Table 21.5: |
LoMP Capital Expenditure Estimate (excluding pre-production operating costs | 349 | ||||
| Table 21.6: |
LoM Capital Expenditure Schedule | 350 | ||||
| Table 21.7: |
Capital Expenditure per Depreciation Class | 351 | ||||
| Table 21.8: |
Mine Operating Cost Estimate Responsibilities | 352 | ||||
| Table 21.9: |
LoMP Operating Cost Estimate | 354 | ||||
| Table 21.10: |
LoM Unit Operating Cost Estimate1 | 355 | ||||
| Table 21.11: |
Operating Cost Schedule1 | 356 | ||||
| Table 22.1: |
LoMP Mine Tonnes and Grade | 358 | ||||
| Table 22.2: |
LoMP Concentrate Production, Recovery, and Grades | 358 | ||||
| Table 22.3: |
LoMP Mine and Processing Production Schedule | 359 | ||||
| Table 22.4: |
LoMP Marketing Terms | 360 | ||||
| Table 22.5: |
LoM Sales and Gross Revenue Schedule | 362 | ||||
| Table 22.6: |
Economic Evaluation Results | 363 | ||||
| Table 22.7: |
NPV at Different Discount Rates | 363 | ||||
| Table 22.8: |
LoM Cashflow Schedule | 365 | ||||
| Table 22.9: |
NPV (5%), net cash-flow, IRR and payback period sensitivity to gold price | 366 | ||||
| Table 24.1: |
Recommended PEP Delegated Ownership | 368 | ||||
| Table 24.2: |
Summary of Construction Contractor requirements | 371 | ||||
| Table 24.3: |
Summary of Operations Personnel | 371 | ||||
| Table 24.4: |
Commissioning Execution Plan | 374 | ||||
| List of Figures
|
||||||
| Figure 1.1: |
Development and Production Schedule | 9 | ||||
| Figure 1.2: |
Ore Production Schedule | 9 | ||||
| Figure 1.3: |
LoMP Operating Cost Schedule | 22 | ||||
| Figure 1.4: |
Net Free Cash Flow Schedule | 24 | ||||
| Figure 1.5: |
NPV (5%) Sensitivity to Metal Price and Costs | 24 | ||||
| Figure 4.1: |
Soto Norte Project Location | 37 | ||||
| Figure 4.2: |
Minesa, Galway and Calvista Mine Titles (Source: Minesa) | 40 | ||||
| Figure 7.1: |
Plan of Tectonic Plates and Movement Directions (Source: Ball J., 2008) | 57 | ||||
| Figure 7.2: |
Plan of Regional Geology (Source: after Pulido, 2003) | 58 | ||||
| Figure 7.3: |
Plan of California – Vetas Mining District Geology (Source: Ingeominas, 2007) | 58 | ||||
| Figure 7.4: |
District Stratigraphic Column | 60 | ||||
| Figure 7.5: |
Plan of Local Geology Modified from the Ingeominas Map H13 (Ward, D. Et Al, 1973) and Mineral Deposit Research Unit, University of British Columbia (MDRU, 2012) and Minesa Project and Exploration Licenses | 61 | ||||
| Figure 7.6: |
Plan of Local Geology and the Soto Norte Concessions (Source: MDRU, 2012) | 62 | ||||
| Figure 7.7: |
Plan of Faults and Lithologies in the Soto Norte Project Area | 66 | ||||
| Figure 7.8: |
Plan and Cross-Section of the Geology Along the Main Access Tunnel and the Soto Norte Mining Area | 67 | ||||
| Effective Date January 1, 2021 | Aris Gold | |||
| Page xiv of xviii |
| SRK Consulting | Soto Norte NI 43-101– Feasibility Study |
| Figure 7.9: |
Transverse Section of the La Baja (Gigante) and La Rosa (Mascota) Faults and Drill Sample Gold Grades | 68 | ||||
| Figure 7.10: |
Plan of Third Order Faults Highlighted by Sample Data between Second Order Faults | 68 | ||||
| Figure 7.11: |
Plan of Soto Norte Known Mineralisation Dimensions |
70 | ||||
| Figure 7.12: |
Paragenetic Sequence Determined by Rodriguez (2014) | 71 | ||||
| Figure 8.1: |
Soto Norte Mineralisation Spatial Location According to a Porphyry Copper System | 74 | ||||
| Figure 9.1: |
Plan of Area Covered by Aerial LIDAR Survey | 79 | ||||
| Figure 9.2: |
Plan of Area Covered by Orthophotos | 80 | ||||
| Figure 9.3: |
Plan of 2006 – 2017 Regional Soil Sample Locations | 82 | ||||
| Figure 9.4: |
Plan of 2006 – 2017 Soto Norte Soil Sample Locations | 83 | ||||
| Figure 9.5: |
Plan of Regional Geochemical Soil Sample Gold Anomalies | 84 | ||||
| Figure 9.6: |
Plan of Soto Norte Rock Chip Sample Locations | 85 | ||||
| Figure 9.7: |
Plan of 2012-2018 Mapping and Sampling Locations | 87 | ||||
| Figure 9.8: |
Cross Section along the Emboque Tunnel of Mascota Vein System | 87 | ||||
| Figure 9.9: |
Long Section of the Abandoned Las Haches Mine Workings | 88 | ||||
| Figure 9.10: |
Plan of Las Haches Tunnel Geological Mapping | 88 | ||||
| Figure 9.11: |
Plan of Ground Magnetic and IP Geophysics Survey Locations | 90 | ||||
| Figure 9.12: |
Plan of 2006 and 2012 Combined Ground Magnetic Data | 91 | ||||
| Figure 9.13: |
Plan of 2012 Radiometry and Magnetometry Airborne Geophysics (Source: Modified from Carman Map 6.13 (K-anomaly)) |
92 | ||||
| Figure 9.14: |
Plan of 2006 and 2012 Combined IP (Chargeability) Results at a Depth of 150 m | 93 | ||||
| Figure 10.1: |
Plan of 2006 – 2017 Regional Drillhole Collar Locations by Year | 95 | ||||
| Figure 10.2: |
Plan of 2006 – 2017 Regional Drillhole Collar Locations by Operator | 96 | ||||
| Figure 10.3: |
Plan of Exploration Drillholes Supporting the Mineral Resource Estimate | 97 | ||||
| Figure 10.4: |
Long Section of Initial (Top) and Final (Bottom) Infill Drill Spacing at the Mascota Vein | 98 | ||||
| Figure 10.5: |
Cross Section of Drillholes Relative to Vein Orientation | 100 | ||||
| Figure 11.1: |
ALS Chemex Bucaramanga Sample Preparation Flowsheet | 105 | ||||
| Figure 11.2: |
Soto Norte Core Preparation and Logging and Sample Cutting and Despatch Flowsheet | 108 | ||||
| Figure 11.3: |
ALS Chemex Sample Preparation Flowsheet (Source: ALS, 2016) | 115 | ||||
| Figure 11.4: |
ALS Chemex Coarse Duplicate Sample Preparation Flowsheet (Source: ALS, 2016) | 115 | ||||
| Figure 11.5: |
Twin Sample Results | 125 | ||||
| Figure 11.6: |
Coarse Duplicate Results | 126 | ||||
| Figure 11.7: |
Pulp Duplicate Results | 126 | ||||
| Figure 11.8: |
Standard Reference Results Low (top), medium (middle) and high (bottom) | 127 | ||||
| Figure 11.9: |
External Laboratory Assay Check Results | 127 | ||||
| Figure 11.10: |
High Grade Standard Results | 128 | ||||
| Figure 11.11: |
Medium Grade Standard Results | 128 | ||||
| Figure 11.12: |
Low Grade Standard Results | 129 | ||||
| Figure 11.13: |
Fine (left) and Coarse (right) Blank Results | 129 | ||||
| Figure 11.14: |
Pulp Duplicate Results by Original (top) and Check (bottom) Laboratories | 130 | ||||
| Figure 11.15: |
Coarse Duplicate Results by Original (top) and Check (bottom) Laboratories | 131 | ||||
| Figure 11.16: |
Drill Core Graphical Log Example | 133 | ||||
| Figure 13.1: |
Long Section of La Mascota Metallurgical Sample Locations | 138 | ||||
| Figure 13.2: |
Long Section of El Gigante Metallurgical Sample Locations | 139 | ||||
| Figure 14.1: |
Plan and Cross Section of Fault Model | 154 | ||||
| Figure 14.2: |
3D View of Faults Used to Generate the Mineralisation Model | 154 | ||||
| Figure 14.3: |
Section and Plan Showing Faults and Gold Grades | 156 | ||||
| Figure 14.4: |
Plan of Main Vein Domains | 157 | ||||
| Figure 14.5: |
Plan of Minor Vein Domains | 158 | ||||
| Figure 14.6: |
Oblique View of Central Mascota Breccia (light blue) and Mascota Vein (Red) | 158 | ||||
| Figure 14.7: |
Oblique View of Waste Model | 159 | ||||
| Figure 14.8: |
Bulk Density Measurements Over Time | 160 | ||||
| Figure 14.9: |
Plan of Bulk Density Sample Locations | 161 | ||||
| Figure 14.10: |
Scatter Plot and Regression Formula of Sample Bulk Density and Fe% Grade in Mascota Main Vein | 162 |
| Effective Date January 1, 2021 | Aris Gold | |||
| Page xv of xviii |
| SRK Consulting | Soto Norte NI 43-101– Feasibility Study |
| Figure 14.11: |
Gold Log Histogram and Log Probability Plot Example for Mascota | 165 | ||||
| Figure 14.12: |
Example of Internal Domain Analysis Using Gold Indicator Models at Mascota | 166 | ||||
| Figure 14.13: |
Example of Internal Domain Analysis Using Silver (top) and Copper (bottom) Indicator Models at Mascota | 167 | ||||
| Figure 14.14: |
Example of Gold Log-Probability Plots Used for Capping Analysis for Domain 100 (top) and Domain 2100 (bottom) | 169 | ||||
| Figure 14.15: |
Dendogram of Mascota Vein | 172 | ||||
| Figure 14.16: |
Dendrogram of Gigante Vein | 173 | ||||
| Figure 14.17: |
Example Semi-Variogram Model for Gold in Domain 2100 | 174 | ||||
| Figure 14.18: |
Example Semi-Variogram Model for Gold in Domain 100 | 174 | ||||
| Figure 14.19: |
Long Section of Mascota Vein Showing Areas of Influence from 10 to 50 m Around High- Grade Gold Grades | 177 | ||||
| Figure 14.20: |
Log Probability and Spatial Comparison of 1.2 g/t Au Subdomain within the Breccia Zone | 181 | ||||
| Figure 14.21: |
Plan View of the Estimated Breccia Blocks and 3 m Composite Gold Grades | 182 | ||||
| Figure 14.22: |
Long Section of Block Centroids of Mascota Vein Estimated and Raw Sample Silver Grades | 183 | ||||
| Figure 14.23: |
Long Section of Mascota Vein Estimated and Raw Sample Gold Grades | 184 | ||||
| Figure 14.24: |
Long Section of Mascota Vein Estimated and Raw Copper Grades | 184 | ||||
| Figure 14.25: |
Swath Analysis by Easting of Estimated and Composite Silver, Gold, and Copper Grades for the Mascota Vein | 187 | ||||
| Figure 14.26: |
Classification of Mascota Main Vein (2: Indicated, 3: Inferred) and 50 m halo around drilling in grey | 188 | ||||
| Figure 14.27: |
Classification of Gigante Vein (2: Indicated, 3: Inferred) and 50 m halo around drilling in grey | 188 | ||||
| Figure 15.1 |
Hill of Value Results | 196 | ||||
| Figure 16.1: |
Plan of Padilla Boxcut, Access Development and Production Stopes | 200 | ||||
| Figure 16.2: |
Cross Section of TBM Tunnel | 201 | ||||
| Figure 16.3: |
Plan of Padilla Box Cut and Portal Layout for TBM Access | 201 | ||||
| Figure 16.4: |
Plan of Main Access and Development to Mining Areas | 202 | ||||
| Figure 16.5: |
Long View of Main Access to Mining Areas | 202 | ||||
| Figure 16.6: |
Southeast View of Access and Ventilation Development, Production Stopes and Underground Quarry Stopes | 203 | ||||
| Figure 16.7: |
Northeast Section of Mine Design in Vicinity of Emboque Decline | 203 | ||||
| Figure 16.8: |
Plan of All Zones on Level 2,430 mRL | 204 | ||||
| Figure 16.9: |
Cross Section of Profile and Services for 5.5 mW x 5.5 mH Drive | 205 | ||||
| Figure 16.10: |
Cross Section of Profile and Services for 5.0 mW x 5.5 mH Drive | 205 | ||||
| Figure 16.11: |
Long Section of Gigante Hangingwall N’ Stability Model | 207 | ||||
| Figure 16.12: |
Plan of Project Area Drainage System and IDEAM Gauging Station Location at Puente Panaga | 210 | ||||
| Figure 16.13: |
Plan of Project Wide Flow Accretion Survey Network and Average Stream Flows | 210 | ||||
| Figure 16.14: |
Plan of Water Use Index in Project AoI Catchments (Source: ESIA, 2019) | 211 | ||||
| Figure 16.15: |
Oblique Section of Three-Dimensional Hydrogeological Conceptual Model (Source: ESIA, 2019) | 215 | ||||
| Figure 16.16: |
Oblique Section of Three-Dimensional Hydrogeological Conceptual Model (Source: ESIA, 2019) | 215 | ||||
| Figure 16.17: |
Plan of Model Mesh with Detailed Refinement along Streams and Underground Workings | 218 | ||||
| Figure 16.18: |
Oblique Section of Model Mesh with Inset showing Underground Mine Area | 218 | ||||
| Figure 16.19: |
Scatter plot of Simulated and Observed Heads | 219 | ||||
| Figure 16.20: |
Observed and Simulated Flow Rates for Puente Panega, 1992 to 2016 | 219 | ||||
| Figure 16.21: |
Annual Predicted Groundwater Inflow Rates | 220 | ||||
| Figure 16.22: |
Long Section of Permanent Dewatering Design Infrastructure and Duty Flow Rate and Static Head, and Pump and Pipe Selections | 222 | ||||
| Figure 16.23: |
Grouting and Dewatering Strategy by Zone | 224 | ||||
| Figure 16.24: |
Plan View of Underground Grouting Plan | 225 |
| Effective Date January 1, 2021 | Aris Gold | |||
| Page xvi of xviii |
| SRK Consulting | Soto Norte NI 43-101– Feasibility Study |
| Figure 16.25: |
Oblique North-East View of Underground Grouting Plan | 225 | ||||
| Figure 16.26: |
Long Section Example of Modified Avoca Initial Level Development and Stope Production | 229 | ||||
| Figure 16.27: |
Long Section Example of Modified Avoca Stope Production Commenced on Lower Level and Waste Backfilling | 230 | ||||
| Figure 16.28: |
Long Section Example of Modified Avoca Temporary Rib Pillar to contain Waste Backfill and Continued Stope Production on Lower Level | 231 | ||||
| Figure 16.29: |
Long Section Example of Modified Avoca Upper Sill Level Grout Injection to Stabilise Backfilled Waste and Slot Raise Drilling on Lower Level | 232 | ||||
| Figure 16.30: |
Long Section Example of Modified Avoca Stope Production Commenced on Second Level and Continued Production on Lower Level | 233 | ||||
| Figure 16.31: |
Long Section Example of Modified Avoca Production on Lower Level Nearing Completion and Continued Stope Production on Second Level | 234 | ||||
| Figure 16.32: |
Long Section Example of Modified Avoca Stope Production Commenced on Upper Sill Level and Production on Second Level Nearing Completion | 235 | ||||
| Figure 16.33: |
Long Section Example of Modified Avoca Stope Production Completed on All Levels with Grout Stabilised Waste and Rib Pillars | 236 | ||||
| Figure 16.34: |
Long Section on Left, Cross Section on Right of Modified Avoca with Induced Failure of the Grout Stabilised Waste Sill Pillars Below the Crown Pillar Followed by Backfilling | 237 | ||||
| Figure 16.35: |
Long Section Example of CRF Placement in Poor Ground Conditions | 239 | ||||
| Figure 16.36: |
Average Stope Cycle Durations | 241 | ||||
| Figure 16.37: |
Plan of Stoping Direction in All Zones of Level 2,430 mRL | 242 | ||||
| Figure 16.38: |
Cross Section of Typical Drill Pattern in Longitudinal Wide Stope | 244 | ||||
| Figure 16.39: |
Cross Section (left) and Plan (right) of Typical Drill Pattern in Longitudinal Narrow Stope | 244 | ||||
| Figure 16.40: |
Oblique View of Planned Waste Stopes Layout | 245 | ||||
| Figure 16.41: |
Cross Section of Longhole Drilling for Typical Waste Stope | 245 | ||||
| Figure 16.42: |
Annual Development/Production Tonnage and Gold Grade | 252 | ||||
| Figure 16.43: |
Annual Production Tonnage with Gold, Silver, Copper and Sulphur Grades | 253 | ||||
| Figure 16.44: |
Annual Production by Resource Classification | 253 | ||||
| Figure 16.45: |
Annual Development Breakdown by Equipment Type | 253 | ||||
| Figure 16.46: |
Annual Material Movement | 254 | ||||
| Figure 16.47: |
Annual Development Equipment Requirements | 262 | ||||
| Figure 16.48: |
Annual Production Drilling Equipment Requirements | 263 | ||||
| Figure 16.49: |
Annual Load and Haul Equipment Requirements | 263 | ||||
| Figure 16.50: |
Annual Main Support Equipment Requirements | 263 | ||||
| Figure 16.51: |
Annual Mine Personnel Estimate | 264 | ||||
| Figure 16.52: |
Oblique view of Underground Infrastructure | 266 | ||||
| Figure 16.53: |
Annual Total Minimum Airflow Requirements | 269 | ||||
| Figure 16.54: |
Plan of Example TBM Auxiliary System Layout | 270 | ||||
| Figure 16.55: |
Long Section of General Ventilation Scheme | 270 | ||||
| Figure 16.56: |
Plan of Example Dead-End Level Auxiliary Ventilation | 271 | ||||
| Figure 16.57: |
Plan of Example Partial Flow-Through Level Auxiliary Ventilation | 271 | ||||
| Figure 16.58: |
Long Section of Scheduled Mining and Development Activities for Year 03 | 272 | ||||
| Figure 16.59: |
Long Section of Scheduled Mining and Development Activities for Year 06 | 272 | ||||
| Figure 16.60: |
Long Section of Scheduled Mining and Development Activities for Year 11 | 273 | ||||
| Figure 16.61: |
Long Section of Scheduled Mining and Development Activities for Year 14 | 273 | ||||
| Figure 18.1: |
Plan of Padilla and Emboque General Layout | 289 | ||||
| Figure 18.2: |
Plan of Padilla Infrastructure Layout | 290 | ||||
| Figure 18.3: |
Plan of Emboque Infrastructure Layout | 290 | ||||
| Figure 18.4: |
Plan of Padilla Camp Area | 294 | ||||
| Figure 18.5: |
Cross Sections 1 (left) and 2 (right) of Starter Facility | 305 | ||||
| Figure 18.6: |
Plan (left) and Cross Section (right) of DSF Final Phase 5 (Final) Deposition | 306 | ||||
| Figure 18.7: |
Plan of Padilla Main Water Treatment Plant Layout | 312 | ||||
| Figure 18.8: |
Cross Section of Conceptualised Groundwater Flow Post-Rebound (SRK 2017) | 314 | ||||
| Figure 21.1: |
Operating Cost Schedule (excluding capitalised operating costs) | 355 |
| Effective Date January 1, 2021 | Aris Gold | |||
| Page xvii of xviii |
| SRK Consulting | Soto Norte NI 43-101– Feasibility Study |
| Figure 22.1: |
Mine Production and Mill Feed Schedule | 358 | ||||
| Figure 22.2: |
Gross Revenue Schedule by Concentrate | 361 | ||||
| Figure 22.3: |
Gross Revenue Schedule by Metal | 361 | ||||
| Figure 22.4: |
Cash Flow Schedule (Post-Tax) | 364 | ||||
| Figure 22.5: |
NPV (5%) Sensitivity to Metal Price and Costs | 366 | ||||
| Figure 24.1: |
Organisational Structure | 369 | ||||
| Figure 24.2: |
Construction Organisation | 369 |
List of Technical Appendices
| A | QP Certificates | A-1 | ||||
| B | Process Plant Flow Diagram | B-1 | ||||
| C | Water Balance for Operation Phase (Average Operation and Average Climatic Conditions) | C-1 | ||||
| D | Environmental Licence Application Evaluation Process (ERM, BESIA, 2018) | D-2 | ||||
| Effective Date January 1, 2021 | Aris Gold | |||
| Page xviii of xviii |
| SRK Consulting (UK) Limited 5th Floor Churchill House 17 Churchill Way Cardiff CF10 2HH Wales, United Kingdom E-mail: enquiries@srk.co.uk URL: www.srk.com Tel: + 44 (0) 2920 348 150 |
| 1 | SUMMARY |
| 1.1 | Introduction |
This Technical Report has been prepared by SRK Consulting (UK) Limited (“SRK”), SNC--Lavalin (“SNC”), and Sociedad Minera de Santander S.A.S. (“Minesa”), to disclose the results of mineral resource and reserve estimates and the results of a Feasibility Study of the Soto Norte Gold Project (the “Project”) in Colombia, in accordance with (NI) 43-101.
The quality of information, conclusions, and estimates contained herein is consistent with the level of effort involved in SRK’s services, based on i) information available at the time of preparation, ii) data supplied by outside sources, and iii) the assumptions, conditions, and qualifications set forth in this report. This report is intended for use by Aris Gold Corporation (“Aris”) subject to the terms and conditions of its contract with SRK and relevant securities legislation. The contract permits Aris to file this report as a Technical Report with Canadian securities regulatory authorities pursuant to National Instrument 43-101, Standards of Disclosure for Mineral Projects (“NI 43-101”). Except for the purposes legislated under Canadian securities law, any other uses of this report by any third party is at that party’s sole risk. The responsibility for this disclosure remains with Aris. The user of this document should ensure that this is the most recent Technical Report for the property as it is not valid if a new Technical Report has been issued.
Unless otherwise stated, information, data, and illustrations contained in this Technical Report or used in its preparation have been prepared by the Qualified Persons (“QP”) for the purpose of this Technical Report.
| 1.2 | Terms of Reference |
The Report will be publicly filed with Canadian securities regulatory authorities; may be publicly filed with and published by any stock exchange and other regulatory authority and any publication of the Technical Report for regulatory purposes, including electronic publication in the public company files on the websites accessible by the public; may be published by Aris Gold on its company website or otherwise; will be included in Aris Gold’s material change report dated March 21, 2022; and supports Aris Gold’s news release dated March 21, 2022.
Currency is expressed in United States dollars (“USD”) unless stated otherwise; units presented are typically metric units, such as metric tonnes, unless otherwise noted.
The forward looking mine plan is based on commencement milestone referred to as the Notice to Proceed (“NTP”). The actual timing for the NTP will vary based on project financing and the required permits to be granted by the Government of Colombia.
| 1.3 | Property Description and Ownership |
Soto Norte is an advanced exploration stage underground gold project located in the department of Santander, Colombia. Mubadala Investment Company (“MIC”) is the 100% owner of the Minesa Group,
| [ISO 9001:2015 Quality Assured Company logo] | Registered Address: 21 Gold Tops, City and County of Newport, NP20 4PG, Wales, United Kingdom. SRK Consulting (UK) Limited Reg No 01575403 (England and Wales) |
Group Offices: Africa Asia Australia Europe North America South America |
| SRK Consulting | Soto Norte NI 43-101 – Feasibility Study |
consisting of AUX Colombia S.A.S. (AUX), currently known as Sociedad Minera de Santander (Minesa), Sociedad Minera Calvista Colombia S.A.S. (Calvista) and Galway Resources Holdco Ltd. Sucursal Colombia (Galway). Minesa is the 100% owner of the Soto Norte Project.
The Soto Norte Project is developed in Concession 095-68 and has a works and construction program (PTO) approved by the National Mining Agency (ANM) as a program of mine development and production, Act number 000195 of October 13, 2017. The Soto Norte mineral resources and reserves at the Project are located entirely within Concession 095-68.
| 1.4 | Status of Exploration, Development, and Operations |
Artisanal miners held small-scale tenements in the area then known as La Bodega in the mining district of California – Vetas. The first modern exploration program on the Soto Norte Project was undertaken by Ventana Gold Corporation (“Ventana”) commencing in December 2005. Ventana disclosed a historical Scoping Study by Samuel Engineering in November 2010. By March 2011, a total of 143,568 m of drilling had been carried out when Ventana was acquired by AUX.
AUX drilled a further 200,124 m over a strike length of 2.5 km between 2011 and 2013. During this period, AUX also acquired the adjacent Galway and Calvista exploration properties, including 104,714 m of drill core from those properties covering another 800 m of strike length to the southwest of Soto Norte. AUX disclosed a Technical Report by Coffey Mining Pty Ltd (“Coffey Mining”) on the historical Soto Norte mineral resources, excluding Galway and Calvista, in July 2012 and January 2013.
Galway Resources Limited completed 85,332 m of drilling in 261 diamond drillholes between December 2009 and January 2013 in the areas of San Celestino, La Baja, San Juan, Machuca, and Catalina, and disclosed a Technical Report by SRK Consulting (US) in October 2012.
Calvista Gold Corporation completed 20,043 m of drilling in 49 diamond drillholes between July 2010 and March 2012 and disclosed a Technical Report and a historical mineral resource estimate by TechnoTectonics in October 2012.
Minesa completed 35,940 m of drilling in 77 diamond drillholes between January and September 2016. Minesa completed historical mineral resource estimates by SRK in accordance with the JORC code guidelines, none of which have been publicly disclosed, in February 2016, January 2017, July 2017, and May 2019. Minesa also completed a historical pre-feasibility study by SNC in May 2017, and a mineral reserve estimate by SRK in accordance with the JORC code guidelines, in August 2017, neither of which have been publicly disclosed. Minesa also completed a historical mineral resource estimate of Galway and Calvista by SRK in 2018.
No further exploration activities on concession 095-68 have been undertaken since 2017. In recent years the Project has been undergoing technical and economic studies as well as environmental, social, and permitting activities.
No formal mining has taken place at the Soto Norte Project, however small-scale informal (artisanal) miners have driven several adits and tunnels on parts of the Property haphazardly exploiting high-grade veins and shoots, generally by raising and sub-drifting for short distances. Approximately 4,000 m of tunnels, drifts, and raises are present on the Minesa properties with the most extensive workings developed in the La Bodega mine. Most of this activity was restricted to mostly mining free gold within the oxidation and transitional zones of the veins and other mineralized structures at or near the surface. Although no records of this production are available, the tonnage removed is estimated at between 50,000 to 75,000 t.
| Effective Date January 1, 2021 | Aris Gold | |||
| Page 2 of 384 |
| SRK Consulting | Soto Norte NI 43-101 – Feasibility Study |
| 1.5 | Geology and Mineralisation |
The Soto Norte Project is situated north of the point of division of the Eastern Andean Cordillera into its western and eastern branches. The western branch hosts the NNW-trending Santander Massif, which is bounded by the Bucaramanga Fault to the west and the Socota-Santander Fault to the east. The Project geology is related to magmatic events and contact metamorphism sited centrally between these two faults.
The principal Project faults comprise the La Baja, Mongora, and Cucutilla faults, which are interpreted to be part of the wider regional structural corridor, which acts as one of the controls over mineralisation throughout the California-Vetas mining district.
The parallel faults hosting the El Gigante and La Mascota mineralisation at Soto Norte, referred to as the La Rosa Fault Zone and the La Baja Fault Zone, represent two linking structures between the principal faults. The faults converge at depth and are indicated to join into a single structure at a basement fault zone. High grade gold follows the alignment of the New deposit, which is considered a feeder structure. Exploration drilling from surface has not yet reached the bottom or the strike extents of the mineral deposit, leaving the deposit open at depth and along strike, and with high exploration potential to target the deep structures from underground drilling stations.
Veins at Mascota exhibit open-space filling texture along the Mascota related structures while veining in the El Gigante structure is mostly characterised by more compact, less vuggy, and often banded textures. The veins cover a strike extent of 2.6 km and have been drilled to a depth of approximately 800 m below surface. The width of the veins is variable depending on the major and minor structures, and pinch and swell within individual structures. On average, the ranges are between 1 and 30 m wide.
The Soto Norte mineral deposit is classified as a high-sulphidation epithermal deposit, with gold, silver and copper occurrences, mainly in sulphides. The genesis of the deposit is characterised by hydrothermal fluids flowing through fault-related pathways. The deposit is related to Miocene porphyry stocks and dikes that crosscut the older sedimentary, igneous and metamorphic rocks.
| 1.6 | Metallurgical Testwork and Mineral Processing |
Several metallurgical testwork programmes have been undertaken in support of the various phases of the Project’s development. A flowsheet was selected during the 2017 PFS, comprised of comminution and flotation to produce separate copper and pyrite concentrates.
Gold is present as native gold and precious metal tellurides, primarily associated with pyrite. Electrum and silver-rich gold grains are preferentially associated with copper sulphides. The average size of the gold grains is 5 microns. Enargite/tetrahedrite accounts for 28% of the copper mineralization, combined bornite, covellite, and chalcocite account for 59%, and chalcopyrite accounts for 12%.
The mill feed at Mascota is categorised as hard and Gigante is moderately hard. Based on the comminution results, a tonnage and P80 estimate was made in each block of the model, subject to constraints on both tonnage (minimum of 280 tonnes per hour and maximum of 380) and P80 (minimum of 90 microns, maximum of 122). The average predicted performance is 350 tonnes per hour at a P80 of 107 microns. The results of the flotation studies were used to produce estimates of flotation performance for each block in the model.
At the target copper concentrate grade of 16%, copper recovery for La Mascota is 70 to 74% and 68% for El Gigante. Gold recovery to the copper concentrate is 40% for La Mascota and 35% for El Gigante. The total gold recovery is 95% for La Mascota and 89% for El Gigante. Overall precious metal recoveries to the
| Effective Date January 1, 2021 | Aris Gold | |||
| Page 3 of 384 |
| SRK Consulting | Soto Norte NI 43-101 – Feasibility Study |
combined concentrates are forecast to be 89 to 94.5% for gold and 86 to 93% for silver. At the fixed 16% copper concentrate grade, average annual copper recovery is typically around 75%, except when the copper head grade is low in the early years of the schedule. Pyrite cleaning reduces the pyrite concentrate mass by over 50% with minor loss (2.1%) in gold recovery. Flotation performance is largely unaffected by primary grind size over the range of 106 to 170 microns for La Mascota and 75 to 140 microns for El Gigante.
Gold recovery versus sample head grades of variability samples across all Soto Norte metallurgical testwork programmes and sampling regimes show that gold recovery is insensitive to head grade. Thus, while it is typically assumed that composites with higher gold grade than the mining inventory will overstate gold recoveries, that is not the case for Soto Norte.
All World Bank controlled environmental parameters are shown to be within the designated standards.
| 1.7 | Mineral Resource Estimate |
The mineral resource estimate was prepared in accordance with Canadian Institute of Mining and Metallurgy (“CIM”) Definition Standards. The Soto Norte mineral resources at the Project are located entirely within Minesa’s concession contract 095-68 (“Integrated Concession 095-68”). The Mineral Resource Estimate (“MRE”) was interpreted from 901 drillholes totalling 374,598 m. The MRE was completed by Mr Ben Parsons, MAusIMM (CP) of SRK, an independent Qualified Person as defined in NI 43-101. The effective date of the MRE is 22 May 2019.
In order to determine the quantities of material offering “…reasonable prospects for eventual economic extraction” by an underground mining method, a Net Smelter Return (“NSR”) cut-off approach was developed based on initial cost estimates, metallurgical recoveries, treatment and payability terms and metal price forecasts which were reviewed by SRK, including metal price forecasts considered for the calculation of metal equivalent grades of USD1,300 per ounce of gold, USD18 per ounce of silver, and USD6,800 per tonne of copper, and metallurgical recoveries of 92% for gold and silver and 76% for copper.
Costs and recoveries are based on technical studies completed on the Project and other benchmarks, including a marketing assessment. SRK reasonably expects the Soto Norte deposit to be amenable to a variety of underground mining methods and the Mineral Resources are reported based on a USD47/t NSR cut-off. The blocks above the NSR cut-off form contiguous mining targets without isolated blocks that would be unlikely to warrant the cost of development. The final NSR calculation for the Mineral Resource estimate is based on average grade assumptions for the deposit and determined using:
NSR (USD) = 36.1759 x (gold grade g/t Au) + 0.4426 x (silver grade g/t Ag) + 0.0046 x (copper grade ppm Cu) – 4.5752 x (sulphur grade % S) – 0 .0037 x (arsenic grade ppm As) – 0.0082 x (antimony grade ppm Sb) – 0. 0065 x (bismuth grade ppm Bi) – 0.0067 x (cadmium grade ppm Cd) – 0.277 x (mercury grade ppm Hg) – 0.0001 x (zinc grade ppm Zn) - 0.02
A Gold Equivalent (“AuEQ”) grade and contained ounces has been separately included in the MRE based on the NSR formula to determine equivalent values for copper and silver in relation to gold, taking into account process recoveries, metal prices, realisation costs and payabilities for each metal. The gold value used in the AuEQ estimate also carries the full cost of penalty elements. The NSR cut-off considers marginal mining costs, processing costs, and G&A costs totalling USD47/t.
The Soto Norte MRE with an effective date of 22 May 2019 is summarised in Table 1.1.
| Effective Date January 1, 2021 | Aris Gold | |||
| Page 4 of 384 |
| SRK Consulting | Soto Norte NI 43-101 – Feasibility Study |
| Table | 1.1: Soto Norte Mineral Resources, Effective 22 May 2019 (1, 2, 3, 4) |
| INDICATED CLASSIFICATION | Gold Equivalent | |||||||||||||||||||
| Domain | Tonnes | Au | Au | Ag | Ag | Cu | Cu | AuEQ | AuEQ | |||||||||||
| (kt) | (g/t) | (koz) | (g/t) | (koz) | (%) | (klb) | (g/t) | (koz) | ||||||||||||
| Mascota |
16,128 | 6.29 | 3,264 | 54.7 | 28,383 | 0.20 | 72,344 | 7.58 | 3,930 | |||||||||||
| Mascota Superior |
9,331 | 5.44 | 1,632 | 30.1 | 9,034 | 0.17 | 34,665 | 6.16 | 1,848 | |||||||||||
| Mascota-Gigante |
6,363 | 4.57 | 934 | 27.1 | 5,538 | 0.15 | 21,122 | 5.24 | 1,072 | |||||||||||
| Gigante |
7,602 | 6.29 | 1,537 | 34.3 | 8,386 | 0.24 | 39,921 | 7.25 | 1,772 | |||||||||||
| Gigante Inferior |
1,631 | 5.08 | 266 | 23.5 | 1,232 | 0.19 | 6,813 | 5.84 | 306 | |||||||||||
| New |
832 | 6.90 | 185 | 28.2 | 754 | 0.21 | 3,790 | 7.67 | 205 | |||||||||||
| Aserradero |
3,484 | 3.42 | 383 | 11.5 | 1,291 | 0.15 | 11,778 | 3.86 | 433 | |||||||||||
| Breccia |
2,650 | 2.96 | 252 | 8.0 | 681 | 0.05 | 2,753 | 3.16 | 269 | |||||||||||
| Halo |
42 | 1.23 | 2 | 18.1 | 25 | 0.25 | 235 | 2.20 | 3 | |||||||||||
| Subtotal Indicated |
48,062 | 5.47 | 8,454 | 35.8 | 55,324 | 0.18 | 193,422 | 6.35 | 9,818 | |||||||||||
| INFERRED CLASSIFICATION | Gold Equivalent | |||||||||||||||||||
| Domain | Tonnes | Au | Au | Ag | Ag | Cu | Cu | AuEQ | AuEQ | |||||||||||
| (kt) | (g/t) | (koz) | (g/t) | (koz) | (%) | (klb) | (g/t) | (koz) | ||||||||||||
| Mascota |
2,007 | 3.83 | 247 | 60.3 | 3,890 | 0.13 | 5,844 | 5.42 | 350 | |||||||||||
| Mascota Superior |
4,779 | 5.46 | 840 | 24.6 | 3,781 | 0.17 | 17,526 | 6.10 | 937 | |||||||||||
| Mascota-Gigante |
3,851 | 3.99 | 494 | 28.5 | 3,525 | 0.11 | 9,505 | 4.71 | 584 | |||||||||||
| Gigante |
2,002 | 4.46 | 287 | 46.6 | 3,001 | 0.37 | 16,220 | 6.23 | 401 | |||||||||||
| Gigante Inferior |
5,530 | 3.79 | 674 | 25.2 | 4,485 | 0.27 | 33,366 | 4.88 | 868 | |||||||||||
| New |
3,627 | 4.17 | 487 | 22.6 | 2,633 | 0.15 | 12,272 | 4.79 | 558 | |||||||||||
| Aserradero |
5,088 | 3.00 | 491 | 8.3 | 1,353 | 0.11 | 12,226 | 3.31 | 542 | |||||||||||
| Breccia |
456 | 3.45 | 51 | 5.7 | 84 | 0.03 | 310 | 3.57 | 52 | |||||||||||
| Halo |
2 | 1.35 | - | 16.9 | 1 | 0.24 | 13 | 2.36 | 0 | |||||||||||
| Subtotal Inferred |
27,343 | 4.06 | 3,571 | 25.9 | 22,754 | 0.18 | 107,281 | 4.83 | 4,249 | |||||||||||
(1) Mineral Resources are not Mineral Reserves and do not have demonstrated economic viability. All figures are rounded to reflect the relative accuracy of the estimate and have been used to derive sub- totals, totals and weighted averages. Such calculations inherently involve a degree of rounding and consequently introduce a margin of error.Where these occur, SRK does not consider them to be material. All composites have been capped where appropriate. Indicated Mineral Resources are inclusive of those Mineral Resources modified to produce Mineral Reserves; that is, they are reported on an ‘inclusive basis’. The Concession is wholly owned by and exploration is operated by Sociedad Minera de Santander S.A.S (Minesa).
(2) The standard adopted in respect of the reporting of Mineral Resources for the Project, following the completion of required technical studies, is in accordance with the NI 43-101 guidelines and the 2014 CIM Definition Standards and have an Effective Date 22 May 2019.
(3) SRK reasonably expects the Soto Norte deposit to be amenable to a variety of underground mining methods. Mineral Resources are reported based on an NSR cut-off which considers marginal mining costs, processing costs, and G&A costs totalling USD47/t. The NSR cut-off calculation has been determined based on metal price forecasts, metallurgical recovery assumptions from initial testwork, mining costs, processing costs, general and administrative (G&A) costs, and other NSR factors. The final NSR calculation is based on average assumptions for the deposit and determined using NSR (USD) = 36.1759 x (gold grade g/t Au) + 0.4426 x (silver grade g/t Ag) + 0.0046 x (copper grade ppm Cu) – 4.5752 x (sulphur grade %S) – 0.0037 x (arsenic grade ppm As) – 0.0082 x (antimony grade ppm Sb) – 0.0065 x (bismuth grade ppm Bi) – 0.0067 x (cadmium grade ppm Cd) – 0.277 x (mercury grade ppm Hg) – 0.0001 x (zinc grade ppm Zn) -0.02. Metal price forecasts considered for the calculation of metal equivalent grades are Gold (USD1,300/oz), Silver (USD18/oz), Copper (USD6,800/t). NSR cut-off calculations assume average metallurgical recoveries of: Gold (92%), Silver (92%), Copper (76%). A Gold Equivalent (AuEQ) grade and contained ounces has been separately included in the mineral resource estimate based on the NSR formula to determine equivalent values for copper and silver in relation to gold, taking into account process recoveries, metal prices, realisation costs and payabilities for each metal. The gold value used in the AuEQ estimate also carries the full cost of penalty elements.
(4) SRK completed a site inspection of the deposit by Mr. Ben Parsons, MSc. MAusIMM (CP), an appropriate “independent qualified person” as defined in National Instrument 43-101.
| Effective Date January 1, 2021 | Aris Gold | |||
| Page 5 of 384 |
| SRK Consulting | Soto Norte NI 43-101 – Feasibility Study |
| 1.8 | Mineral Reserve Estimate |
The Mineral Reserve estimate has been prepared in accordance with CIM definition standards for Mineral Reserves. The Indicated Mineral Resources include those Mineral Resources modified to estimate the Mineral Reserves. The Soto Norte mineral reserves are located entirely within Integrated Concession 095- 68.
The QP who has reviewed and approved the Mineral Reserve estimate and the life of mine plan (“LoMP”) is Mr Chris Bray, BEng, MAusIMM (CP) of SRK, who is an independent Qualified Person as defined by NI 43-101. The effective date of the mineral reserve is 01 January 2021.
The Mineral Reserve has been estimated using accepted industry practices for underground mines, including the identification of the optimal final mineable envelopes based on the selected mining methods, appropriate modifying factors and cut-off values based on detailed cost estimation. The identified economic mineralisation was subjected to detailed mine design, scheduling and the development of a cash flow model incorporating Minesa’s technical and economic projections for the mine for the duration of the LoMP. The stope optimisation was run based on the cost estimates, metallurgical recoveries of 92% for gold, 92.5% for silver, and 76% for copper, treatment and payability terms, and metal price forecasts of USD1,300 per ounce of gold, USD18 per ounce of silver, and USD7,000 per tonne of copper.
The NSR calculation for the Mineral Reserve estimate is based on average grade assumptions for the deposit and determined using:
NSR (USD) = 36.1759 x (gold grade g/t Au) + 0.4426 x (silver grade g/t Ag) + 0.0046 x (copper grade ppm Cu) – 4.5752 x (sulphur grade %S) – 0.0037 x (arsenic grade ppm As) – 0.0082 x (antimony grade ppm Sb) – 0.0065 x (bismuth grade ppm Bi) – 0.0067 x (cadmium grade ppm Cd) – 0.277 x (mercury grade ppm Hg) – 0.0001 x (zinc grade ppm Zn) – 0.02
A detailed Hill of Value (“HoV”) evaluation was undertaken over a range of NSR cut-off value and production rate scenarios to assess the project economics. The HoV assessment showed an optimal NSR cut-off value of USD120/t and production rate of 2.6 Mtpa, which has been used as the basis for the mine plan supporting the Mineral Reserve estimate.
Stope optimiser shapes, which considered the described NSR cut-off above USD120/t and modifying factors, were prepared for the final mine design by removing any irregular or minor isolated stope shapes as well as stope shapes that were within the 30 m crown pillar, outside the current lease boundaries, or would interfere with planned infrastructure.
Any mineralisation which occurs below the cut-off value or is classified as an Inferred Mineral Resource is not considered in the Mineral Reserve estimate and is treated as waste for the purposes of the LoMP. The Mineral Reserve estimate for the Soto Norte Project is stated in Table 1.2 with an effective date of 01 January 2021.
An AuEQ grade and contained ounces have been separately included in the mineral reserve estimate, based on the NSR formula, to determine equivalent values for copper and silver in relation to gold, considering process recoveries, metal prices, realisation costs and payabilities for each metal. The gold value used in the AuEQ estimate also carries the full cost of penalty elements.
| Effective Date January 1, 2021 | Aris Gold | |||
| Page 6 of 384 |
| SRK Consulting | Soto Norte NI 43-101 – Feasibility Study |
Table 1.2: to Norte Mineral Reserves, Effective 01 January 2021(1, 2, 3, 4)
| Classification | Tonnes | Gold | Silver | Copper | Gold Equivalent | |||||||||||||||
| AuEQ | AuEQ | |||||||||||||||||||
| (kt) | (g/t) | (koz) | (g/t) | (koz) | (%) | (klb) | (g/t) | (koz) | ||||||||||||
| Proven | - | - | - | - | - | - | - | - | - | |||||||||||
| Probable | 24,767 | 6.22 | 4,950 | 34.4 | 27,386 | 0.19 | 102,868 | 6.95 | 5,535 | |||||||||||
| Proven + Probable | 24,767 | 6.22 | 4,950 | 34.4 | 27,386 | 0.19 | 102,868 | 6.95 | 5,535 | |||||||||||
(1) All figures are rounded to reflect the relative accuracy of the estimate and have been used to derive sub-totals, totals and weighted averages. Such estimates inherently involve a degree of rounding and consequently introduce a margin of error. Where these occur, SRK does not consider them to be material. The Concession is wholly owned by and exploration is operated by Sociedad Minera de Santander S.A.S.
(2) The standard adopted in respect of the reporting of Mineral Reserves for the Project, following the completion of required technical studies, is in accordance with the NI 43-101 guidelines and the 2014 CIM Definition Standards, and have an Effective Date of 01 January 2021.
(3) SRK reasonably expects the Soto Norte deposit to be amenable to a variety of underground mining methods and the mine plan supporting the Mineral Reserve estimate is primarily based on Modified Avoca with additional backfill waste sourced from an underground quarry. Mineral Reserves are reported at an NSR cut-off of $120 per tonne, which was selected based on a hill of value study to optimize value, and is based on metal price assumptions, metallurgical recovery assumptions from initial testwork, mining costs, processing costs, general and administrative (G&A) costs, and other NSR factors that were estimated at the time of mine planning. The final NSR calculation is based on average assumptions for the deposit and determined using NSR (USD) = 36.1759 x (gold grade g/t Au) + 0.4426 x (silver grade g/t Ag) + 0.0046 x (copper grade ppm Cu) – 4.5752 x (sulphur grade %S) – 0.0037 x (arsenic grade ppm As) – 0.0082 x (antimony grade ppm Sb) – 0.0065 x (bismuth grade ppm Bi) – 0.0067 x (cadmium grade ppm Cd) – 0.277 x (mercury grade ppm Hg) – 0.0001 x (zinc grade ppm Zn) -0.02. Metal price assumptions considered for the calculation of metal equivalent grades: gold (USD1,300/oz), silver (USD18/oz), copper (USD7,000/t). NSR and Cut-off value calculations assume average metallurgical recoveries: gold (92.5%), silver (92%), copper (76%). The NSR cut-off value of USD120/t and production rate of 2.6 Mtpa has been used as the basis for the mine plan supporting the Mineral Reserve estimate. A Gold Equivalent (AuEQ) grade and contained ounces has been separately included in the mineral reserve estimate based on the NSR formula to determine equivalent values for copper and silver in relation to gold, taking into account process recoveries, metal prices, realisation costs and payabilities for each metal. The gold value used in the AuEQ estimate also carries the full cost of penalty elements.
(4) SRK has completed a site inspection of the deposit by Mr Chris Bray BEng MAusIMM (CP), an appropriate “independent qualified person” as defined in National Instrument 43-101.
| Effective Date January 1, 2021 | Aris Gold | |||
| Page 7 of 384 |
| SRK Consulting | Soto Norte NI 43-101 – Feasibility Study |
| 1.9 | Mining Methods |
| 1.9.1 | Mine Design |
The parallel vein systems in the Soto Norte project area are defined over a strike length of 2.6 km and the two main vein systems considered, Mascota and Gigante; each have a strike length of around 2.0 km. Other minor vein structures of mining interest have strike lengths as low as 15 m.
The majority of vein structures are sub vertical, dipping from 70 to 80° and can range in true width from 1 m or less to over 30 m (typically between 3 and 18 m). There are some vein structures in the hangingwall zones which dip at 60°, and an isolated zone in the southwest where the vein lays over on a 15° dip, closer to surface.
The vein structures extend to surface which is variable in elevation due to the terrain and are open at depth and along strike. The depth limit of the resources considered is 2,100 mRL.
An access tunnel will be developed using a tunnel boring machine (“TBM”) from the Padilla site to the underground mine, a distance of approximately 6.9 km. -The mined ore will be crushed underground and conveyed to the surface process facility at Padilla at a rate of 2.6 Mtpa.
The Emboque zone is designed with decline access from surface with a separate ventilation adit from El Cuatro. The La Bodega zone is accessed through a connection to the Emboque decline.
The mine will utilise Modified Avoca as the primary mining method and cemented rock fill to backfill limited areas of poor ground conditions. A significant amount of waste is required for the mining method to use as both a working platform between levels and to maintain ground stability. To produce sufficient waste for the mining method approaches, underground quarry waste stopes are designed to supplement the waste generated from development. Once the waste stopes are completed, there is an opportunity to store dry filtered tailings underground.
| 1.9.2 | Mine Schedule |
Figure 1.1 shows the combined ore development and production schedule with the contribution of both narrow and wide stopes achieving a maximum sustainable production rate of 2.6 Mtpa over a 7-year period. The ramp up to full production is five years (from Year 01), with two years of initial ore development prior to the process facilities being operational in Month 41. The schedule shows a gradual increase in the gold grade over the Life of Mine (“LoM”), averaging 6.22 g/t Au.
Figure 1.2 shows the production schedule tonnage with the gold, silver, copper and sulphur grades. The copper grade remains low and consistent over the LoM, while the silver grades generally decrease. The sulphur grade is relatively consistent over the mine life.
| Effective Date January 1, 2021 | Aris Gold | |||
| Page 8 of 384 |
| SRK Consulting | Soto Norte NI 43-101 – Feasibility Study |
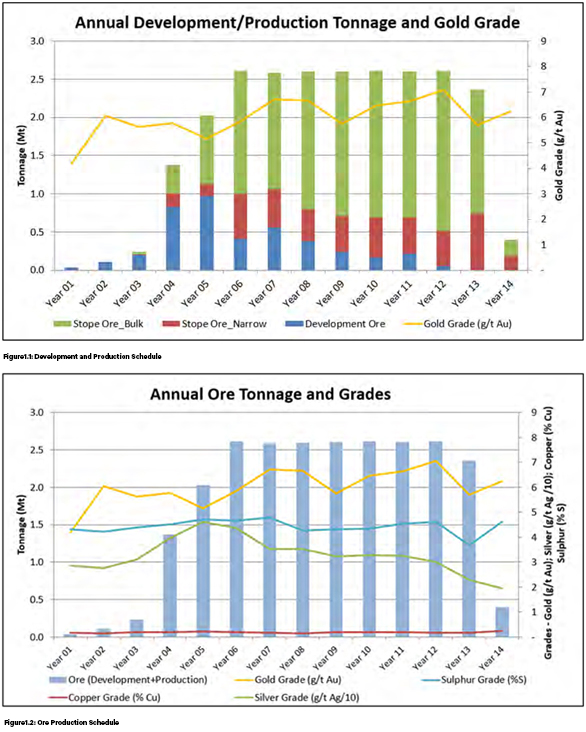
| 1.10 | Recovery Methods |
No cyanide or mercury will be used to process the Soto Norte ores. The process units of the flowsheet developed to treat the Soto Norte ore are as follows:
| ● | Crushing: Two mobile crushers will be installed underground which will primarily be used to crush ore and campaign crush waste rock as required. Crushed ore will be conveyed to the crushed ore stockpile at the surface plant facilities. |
| Effective Date January 1, 2021 | Aris Gold | |||
| Page 9 of 384 |
| SRK Consulting | Soto Norte NI 43-101 – Feasibility Study |
| ● | Grinding: The ore will be ground at the plant facilities using a single stage semi-autogenous grinding (“SAG”) mill that will operate in closed circuit with hydrocyclones. The SAG mill will also have space provision for a future pebble recycle and pebble crushing circuit, if required. |
| ● | Flotation: Sequential flotation with the following individual stages: |
| ○ | Copper rougher with feed from the primary cyclone overflow and tails to the pyrite rougher |
| ○ | Copper rougher concentrate regrind in open circuit with hydrocyclones |
| ○ | Copper cleaner with feed from the regrind cyclone overflow and regrind mill product, and tails to the copper rougher feed |
| ○ | Copper recleaner with feed from the copper cleaner concentrate and tails to the copper concentrate regrind cyclones |
| ○ | Copper Jameson cell cleaner with feed from the copper recleaner concentrate and tails to the copper concentrate regrind circuit |
| ○ | Pyrite rougher after conditioning with sodium hydrosulphide with feed from the copper rougher tails and tails to final dry filtered tailings |
| ○ | Pyrite rougher concentrate regrind in open circuit with hydrocyclones |
| ○ | Pyrite cleaner with feed from the regrind cyclone overflow and regrind mill product and tails to pyrite rougher feed |
| ○ | Pyrite recleaner with feed from the pyrite cleaner concentrate and tails to the pyrite concentrate regrind cyclones |
| ○ | the aims of the flotation circuit are to produce a copper concentrate with a grade of 16% or higher, and to maximise the overall recovery of gold while restricting the non-sulphide gangue content of the concentrates to 10%. |
| ● | Dewatering: The copper and pyrite concentrates and final tailings will all be thickened then pressure filtered in separate facilities. |
| ● | Concentrate transport: The copper and pyrite filter cakes will be loaded into containers for transport 172 km by road to Impala Terminal’s Barrancabermeja riverport on the Magdalena River and transported approximately 660 km to the Cartagena seaport for export. |
| ● | Dry stack tailings (“DSF”) facility: The flotation tailings will be mixed with crushed waste rock and transported by conveyor to the DSF where it will be placed and compacted. Provision is made in the plant equipment and layout for dry filtered tailings to be returned to the mine as fill if required. |
Table 1.3 provides the mineral production summary.
Table 1.3: Mineral Processing Production Summary
| Production Summary | Unit | Value | ||
| Plant feed |
||||
| Length of production |
years | 10 | ||
| LOM feed |
Mt | 24.8 | ||
| Average gold grade |
g/t | 6.22 | ||
| Average silver grade |
g/t | 34.39 | ||
| Average copper grade |
g/t | 1,884 | ||
| Copper Concentrate |
||||
| LOM concentrate production |
kt | 229.5 |
| Effective Date January 1, 2021 | Aris Gold | |||
| Page 10 of 384 |
| SRK Consulting | Soto Norte NI 43-101 – Feasibility Study |
| Production Summary | Unit | Value | ||
| Average concentrate Au grade |
g/t | 300 | ||
| LOM concentrate contained fine gold |
Moz | 2.2 | ||
| Average concentrate Ag grade |
g/t | 1,663 | ||
| Average concentrate Cu grade |
% | 15.03 | ||
| Pyrite Concentrate |
||||
| LOM concentrate production |
kt | 1,989.7 | ||
| Average concentrate Au grade |
g/t | 36.9 | ||
| LOM concentrate contained fine gold |
Moz | 2.4 | ||
| Average concentrate Ag grade |
g/t | 188.5 | ||
| Total Production |
||||
| LOM gold production |
Moz | 4.57 | ||
| Average gold recovery |
% | 92.4 | ||
| Gold in copper concentrate |
% | 48.4 | ||
| Gold in pyrite concentrate |
% | 51.6 | ||
| LOM silver production |
Moz | 24.33 | ||
| Average silver recovery |
% | 88.9 | ||
| Silver in copper concentrate |
% | 50.4 | ||
| Silver in pyrite concentrate |
% | 49.6 | ||
| LOM copper production |
tonne | 34,499 |
1.11 Project Infrastructure
1.11.1 Introduction
There will be two principal areas of operation on site, including Padilla and Emboque, which are separated by 13 km of road. Padilla is located near the municipality of Suratá and comprises the camp area, processing plant, dry filtered tailings facility, operation laydown, box cut, and main utility facilities. Emboque is the mine area, consisting of ventilation terraces, access roads, and tunnel access.
1.11.2 Power
The Project requires 41.7 MW, 46.2 MVA during operation. 47.2 MVA will be supplied from the existing Palos substation, controlled by ESSA, to the main plant substation at Padilla. This will require the installation of a new 50 MVA transformer at the Palos substation, and construction of a new 35 km long double circuit 34.5kV, 24 MVA transmission line from Palos to the Padilla substation, providing a total of 48 MVA. Site power distribution will be at primary 34.5 kV and secondary 13.8 kV at the Padilla substation.
1.11.3 Dry Filtered Tailings and Waste Management
The Project will produce over 22.5 Mt of dry filtered tailings and 12.8 Mt of waste rock over the life of mine. All of the dry filtered tailings and 2.5 Mt of the waste rock will be co-disposed in the DSF, with the remainder of the waste rock used underground as backfill. The DSF design has a capacity of 28.5 Mt, allowing for additional capacity should the life of mine plan be extended through additional drilling, mineral resource and reserve estimates, and positive technical and economic studies.
The thickened tailings from the process plant will be filtered to a filter cake with a moisture content of less than 15%, and conveyed to the DSF, where it will be deposited, upstream stacked, and compacted to achieve the required density for static and seismic stability.
The main DSF engineering and design components including planning and handling of the dry filtered tailings and waste rock deposition schedule, a starter facility, surface water management including diversion of non-contact surface water, collection and treatment of contact surface water, drainage systems, instrumentation, water quality monitoring systems, liner system, progressive rehabilitation, and a cover
| Effective Date January 1, 2021 | Aris Gold | |||
| Page 11 of 384 |
| SRK Consulting | Soto Norte NI 43-101 – Feasibility Study |
system at closure. The cover system, subject to availability of material, will consist of soil, a drainage blanket, and topsoil with vegetation cover, designed to prevent future infiltration of surface water into the DSF.
The DSF will be designed to the Canadian Dam Association standards to provide a safe and environmentally acceptable facility.
| 1.11.4 | Water Management |
The importance of water resources in the vicinity of the Project was recognised early in the Project development process and a complete hydrogeological assessment was carried out by SRK for the PFS, FS, and EIA development.
Surface Water Management and impact mitigation
The Project site is situated in a mountainous region with a wide range of altitudes varying from 1,620 masl to 4,200 masl. The mountains are incised by steep river valleys, with villages/hamlets scattered along the rivers hugging the slopes of the hills. The mine area sits within the La Baja catchment, with its two key tributaries (Angostura and Paez) draining the upland páramo. The La Baja stream joins the Vetas River, which ultimately discharges into the Suratá River. The Padilla plant site, including DSF and associated water treatment facilities, have been planned in minor tributaries of the Suratá River.
Baseline water quality has been evaluated against standard Colombian hydrological indices. The predominant water quality in the Project area is ‘Acceptable’ with some local streams of “Regular” and “Poor” quality. The water resource is also of high potential for contamination due to non-regulated mining activities and the lack of sewage treatment plants in the rural area. The upper portion of the La Baja stream is of poor quality due to small scale mining operations discharging their wastewater without treatment. The lower portions of the La Baja stream show better quality due to dilution by non-impacted tributaries.
Non-contact water systems consisting of diversion channels are proposed for the principal mine facilities in the Padilla area to minimise surface water impacts. The channels are provided at the upstream side to divert non-contact surface water away from the process facilities and then discharge to natural drainage courses leading to the Suratá river. Potential surface water impacts in the underground mine area are associated with reductions in baseflow due to dewatering as discussed below.
Groundwater Management and Impact Mitigation
Conceptual and numerical hydrogeological models were constructed, requiring data inputs from surface and subsurface parameters such as lithology, structures, geomechanics, hydraulic properties, water quality, water levels and stream flows, amongst others. --
The underground dewatering strategy was designed with the following overall aims:
| • | To minimise groundwater inflows to the underground mine and therefore maximise mining productivity, through cover drilling, pre-grouting and pre-dewatering of production areas |
| • | To separate clean and dirty water streams and thereby minimise water settlement and treatment requirements and costs |
| • | To minimise any potential drawdown impacts on the surrounding environment. |
The design flow rates of pumping stations are driven to a large degree by peak groundwater inflow rates
| Effective Date January 1, 2021 | Aris Gold | |||
| Page 12 of 384 |
| SRK Consulting | Soto Norte NI 43-101 – Feasibility Study |
(<350 L/s) during mine development. Dewatering rates are predicted to range between 125 L/s and 225 L/s for the majority of mine life. The modular nature of the dewatering and water treatment systems will help to facilitate optimisation of the dewatering design based on observed groundwater inflow rates and piezometer responses during mine development.
From an ecological perspective, there are two perceived or potential issues related to drawdown around the underground mine:
| • | Potential risks to aquatic ecosystems reliant on the La Baja stream, which may be affected during periods of dry weather when the rivers are no longer fed by groundwater discharge (instead they become a source of groundwater recharge). Minesa will monitor the flow in the La Baja stream in accordance with standard industry practices and will add water to the system to maintain minimum ecological flow requirements, as determined in agreement with ANLA. |
| • | Perceived risks to the sensitive páramo habitat located upgradient of the mine workings. The risk of dewatering activities impacting the ecologically sensitive vegetation of the páramo is negligible. Shallow groundwater conditions are present within the páramos as a result of low permeability bedrock, with the vegetation relying on occult precipitation (fog and drizzle) and reduced evapotranspiration to sustain its ecologically sensitive vegetation. There is limited hydraulic connection between the páramos and the La Baja valley, and its moisture rich organic superficial soils are disassociated from the deeper groundwater. Furthermore, no dewatering impacts are expected to propagate as far as the páramo as the mine intends to pre-grout areas of inflow potential where necessary, particularly in the La Bodega zone to the east and closest to the páramo. |
Based on the groundwater modelling, the main water supplies to villages such as California are not expected to be impacted by the drawdown. Minesa has guaranteed in the environmental management plan (EMP) the availability of water resources for users potentially affected by impacts from drawdown (if any) or changes to stream flow. A cultural spring at El Pocito is expected to be impacted during the dry months and a management plan has been put in place (SOC-13).
Water Balance
The Soto Norte Project involves multiple facilities and various sources of dewatering flows. During the first three years, tunnelling from Padilla and the underground development at Emboque will not be connected so will need to be handled as separate schemes. During the operations phase, most of the groundwater will be routed from the mine through the TBM tunnel access and handled at the Water Treatment Plant in Padilla. The outflow from the treatment plant will be recycled for service water use within the processing plant and underground mine with any excess discharged as permitted to the Suratá river.
A spreadsheet based, steady state, site-wide water balance has been produced for four construction and four operational scenarios, considering average and peak construction with average and wet climatic conditions. The project has a net positive water balance and a relatively low water demand, and water shortages are considered a low risk.
Water Treatment
Geochemical modelling of contact underground dewatering discharge water quality suggests concentrations of some determinants will be above the relevant surface water environmental quality standards (particularly Zn, but also Cu and U) during the first few years of mining. To appropriately address this possibility, a modular ion-exchange water treatment system will treat this water at Emboque prior to
| Effective Date January 1, 2021 | Aris Gold | |||
| Page 13 of 384 |
| SRK Consulting | Soto Norte NI 43-101 – Feasibility Study |
permitted discharge to the La Baja stream during mine construction, thereafter, contact water will be sent to the main water treatment facility at Padilla for treatment.
Closure
At closure the groundwater levels will rebound, and La Baja River is expected to return to a gaining river, receiving groundwater baseflow. A portion of this baseflow will have flowed through the mine workings. Predictive models indicate that the risk of surface water impacts post-rebound can be minimised by using a rapid-fill approach to groundwater rebound, however, there remains a risk of elevated zinc concentrations in La Baja following rebound and treatment may still be required to meet discharge limits. The groundwater model predicts seepage from the covered DSF to meet discharge limits at closure, therefore minimal treatment may be required.
| 1.12 | Permitting, Social and Community Impact, and Environment |
| 1.12.1 | Permitting |
The Soto Norte Project has been designated by the National Government of Colombia as a mining Project of National Strategic Interest. As such, the key permitting processes are undertaken at the national level. The two main regulatory agencies responsible for the permitting of the Project are:
| • | National Mining Agency (ANM or the “Mining Authority”): the governmental authority responsible for granting exploration and mining concessions, enforcing mining legislation, and regulating and promoting the sector. The agency’s main goal is to develop a strong sector within a framework of social and environmental sustainability. |
| • | National Bureau of Environmental Licences (“ANLA”): the government authority responsible for granting applications for licences, permits, and environmental procedures to develop projects that contribute to the country’s sustainable development. |
Minesa’s Integrated Concession 095-68 resulted from the integration of concession contracts 095-68 and HDB-081, as approved by the National Mining Agency (“ANM”) by means of Resolution No. 002922 dated 6 November 2015, and from an exploration program previously approved by the ANM under writ VSC No. 000210 dated 26 October 2015.
Ingetec commenced an ESIA process on behalf of Minesa in 2016. Ingetec completed the baseline studies building on previous ESIA studies undertaken by MCS in 2016 and Servicios Ambientales y Geograficos in 2013.
Minesa undertook comprehensive environmental and social studies to address the criteria required by Colombian regulatory authorities and good international industry practice (“GIIP”), as represented by the Equator Principles and associated IFC Performance Standards (2012). These studies have been undertaken as part of ESIA processes and have included water resources, soils, geology, land use, biodiversity and ecosystem services, air quality, greenhouse gas emissions, noise and vibration, socioeconomics, archaeology and cultural heritage.
The ESIA report was subject to feedback consultation with local communities and regulators (referred to in Colombia as socialisation) and was submitted to ANLA in August 2017. During the evaluation process, Minesa withdrew the ESIA to facilitate a further update of the ESIA report to reflect most of the project design changes arising since the previous submission. This decision was taken to avoid lengthy licence
| Effective Date January 1, 2021 | Aris Gold | |||
| Page 14 of 384 |
| SRK Consulting | Soto Norte NI 43-101 – Feasibility Study |
modification processes in the future.
Also during this period, a works and construction program (“PTO” or ‘Programa de Trabajo y Obras’) was submitted in May 2017 and a mining licence granted by ANM on 13 October 2017 through resolution VSC No. 000195. The PTO is currently in an amendment process to align with the environmental and social impact assessment (“ESIA”). As per global industry standards, any future PTO amendments will be submitted to the mining authority for approvals based on the Project strategic requirements and compliance with regulatory guidelines.
The updates to the ESIA were subject to a second round of feedback consultation between 29 May and 22 December 2018 and Minesa filed the final ESIA report in February 2019. The report evaluation process should not take more than about four months, excluding requests to evaluate additional information, the lifting of bans, and public hearings. The evaluation by ANLA formally recommenced on 8 March 2019. After submission of the ESIA, two scheduled site visits were completed and additional information was requested by ANLA, which Minesa provided in January 2020.
On 2 October 2020, ANLA issued a writ ordering the closure of the file for the study of the Soto Norte project’s environmental license, based on the consideration that the information provided in the ESIA was not sufficient to continue the environmental assessment process and issue an opinion on the viability of the Soto Norte project. Minesa was notified of such decision on October 13, 2020, and within the 10 business-days’ statutory term, Minesa filed the corresponding reconsideration request against the writ that ordered the closure of the environmental licensing process. Minesa made 10 legal arguments on why ANLA was mistaken in its decision to close the file and requested that the Authority continue with the environmental licensing process and issue a decision on the merits of the project.
ANLA issued a decision dated 19 January 2021 whereby it rejected all reconsideration requests filed against its 2 October 2020 writ (including the one filed by Minesa) and thus confirmed its decision to close the file on the environmental license request for the Soto Norte Project before deciding on the merits of the application. Because ANLA’s decision to close the file on the Soto Norte Project application is based a procedural conclusion on the perceived insufficiency of the information submitted, Minesa is not barred from resubmitting a new application.
Updates to the mine design and other future design variations arising in response to ANLA’s concerns will require additional studies including a re-evaluation of environmental and social impacts, and a re-start of the environmental permitting process and time frames. Once approved, the environmental license is valid for the life of the project, subject to compliance audits by the environmental authority. The license may be modified for changes arising as the Project evolves.
To support Minesa’s plans to seek international financing for the Project, a “bankable” ESIA (“BESIA”) was prepared in July 2019 to communicate the findings of the ESIA and provide additional information to fulfil the relevant requirements of the IFC Performance Standards and to address any gaps. The BESIA has an action plan of approximately 36 measures required to assess or manage the impacts expected from the Project in accordance with international standards. Most of these are planned for completion during the pre-construction phase.
Currently, Minesa has the licenses it requires for the exploration phase of the Project. With respect to commencing construction and moving into the exploitation phase, the key permissions are the amendment of the existing PTO to reflect changes to the ESIA, and approval of the ESIA to obtain the construction permit (a process of approximately 45 business days), followed by approval of the mining permit.
| Effective Date January 1, 2021 | Aris Gold | |||
| Page 15 of 384 |
| SRK Consulting | Soto Norte NI 43-101 – Feasibility Study |
| 1.12.2 | Social Setting |
The Soto Norte project is located in the Soto Norte Province of Santander Department. Communities located inside or in the vicinity of the area of influence are the rural municipalities of California, Suratá, Matanza, Vetas, Charta, and Tona. These six municipalities make up the province of Soto Norte.
Soto Norte Province has a population of approximately 23,000, with an estimated 3,459 located in the area of influence. The provincial economy is based on agriculture and mining related activities. These economic activities are developed differently in each of the Soto Norte municipalities. California, closest to the mine area, is dominated by agriculture, dairy and meat farming, ecotourism (which is growing in importance), and artisanal mining, which is common in many active mines across Colombia. Suratá, downstream of the Padilla processing and DSF area, has ranching, agriculture, and forestry as its main economic generators. The other municipalities have different combinations of the same types of livelihoods. Population dynamics indicate the working age population is migrating from Suratá to the mining economy in California, presumably as a result of a growing disinterest in agriculture livelihoods in Suratá in contrast to the mining opportunities in California.
| 1.12.3 | Management Approach and Corporate Social Responsibility |
Minesa’s 1% Investment Plan was developed in response to Decree 2099 of 2016 that dictates a value of not less than 1% the value of the project’s capital expenditure and associated development costs must be invested in environmental and/or sustainability related projects. In accordance with the investment rules, Minesa indicated in its ESIA application that its investment plan would consider projects focused on management of water resources, management of environmental heritage and management of biodiversity and its ecosystem services.
Minesa has a stakeholder management plan that was developed in 2016 and is regularly updated. The objective of the plan is to facilitate the approval of the ESIA and the communication strategy is being modified to co-ordinate post-approval topics such as land purchases, resettlement and communicating the EMP.
Minesa’s stakeholder engagement activities to date have mainly focussed on information disclosure of the ESIA, known in Colombia as ‘socialisation’. Minesa has carried out ten engagement phases between February 2017 and January 2020 to disclose information on the process of preparing and filing the ESIA. Earlier engagements were undertaken by the previous owners so there is wide familiarity of the Project in the region.
Minesa will develop the Project, specifically its EMP, in consultation with communities and authorities. Many of the management programmes include addressing impacts that involve decision-making by the families living in the area of influence, and therefore the nature of these programmes will be participatory. Stakeholders will also be involved in external monitoring of the project to further promote a transparent relationship between the project and surrounding communities.
Minesa’s social management model was formulated in a participative way based on meetings with the different communities of the municipalities of California, Suratá, Matanza, Vetas, and Charta. Minesa has already undertaken a number of social, labour and community related programmes with the aim of meeting the above stated objectives. Since mid-2016, Minesa’s Corporate Social Responsibility (“CSR”) plan has been generating programmes focused on infrastructure, education for children, access to and the protection of water, promotion of culture and traditions, promotion of local entrepreneurship and co-existence with local miners; these being the key issues identified as important to both Minesa and the Soto Norte
| Effective Date January 1, 2021 | Aris Gold | |||
| Page 16 of 384 |
| SRK Consulting | Soto Norte NI 43-101 – Feasibility Study |
community by means of focus group discussions. The programmes implemented to date will be updated to include obligations from the social EMP.
In addition to CSR programmes, Minesa has established a series of alliances with NGOs, universities and other organisations and some of these alliances are incorporated into the Minesa CSR plan.
Minesa monitors the perceptions of its stakeholders to the project through analysis of Stakeholder Management Plan indicators, monitoring media and social networks, and surveys by independent sources.
Based on the findings of a perceptions survey in November 2018, the project is supported to different extents by the communities in California, Suratá and Matanza. Support for the project, mainly in California and Matanza, is largely due to the economic expectations of the local communities in relation to jobs and service development. The mayors of the six municipalities in the Soto Norte Province, especially Suratá and California, expect the Minesa hiring policy to prioritise the inhabitants of the region for production and administrative positions with training to be provided by Minesa. This is already an active Minesa policy and training has already started for production positions.
Minesa acknowledges the risks associated with potential opposition from local communities. The risk register rates ‘loss of social licence to operate’ and ‘community unrest’ as very high and risk of protests, demonstrations or blockages as high. In the worst case, opposition could potentially result in the Project not being able to proceed. Key management programmes to address these risks include the stakeholder engagement plan, resettlement programme and coexistence plan. If successfully implemented, these management plans should facilitate maintaining public support in those areas closest to the mine.
| 1.12.4 | Land Acquisition and Resettlement |
Additional land acquisition for construction and operation of the Project will result in physical displacement (relocation) and economic displacement (loss of assets or access to assets affecting livelihood) for some members of the surrounding communities.
Minesa has undertaken efforts to minimise the scope of displacement through design modifications and alternatives to the Project’s footprint, resulting in a reduction from 827 to 755 hectares (ha). Further Project refinements may cause minor alterations to the resettlement footprint; however, based on the anticipated Project footprint, Minesa has identified 85 properties that will need to be acquired, provisionally affecting 213 households. Minesa is still evaluating the areas to which affected households will be relocated to determine their appropriateness in terms of proximity to point of origin, availability of land, and similar productive capacity to enable continuity of livelihoods for affected populations.
In terms of the impact assessment, resettlement was identified as the most significant negative impact of the Project and consequently is a key focus of the management programs.
Minesa has developed a Framework Resettlement Action Plan (“FRAP”) to guide the resettlement planning process and undertaken the necessary studies and negotiations required to prepare a final Resettlement Action Plan (RAP). Minesa intends to manage resettlement impacts in compliance with Colombian regulations and in accordance with the IFC Performance Standards. Implementation of the RAP will commence when the Project’s environmental licence is issued and is expected to take four years. Resettlement will be carried out in phases to facilitate construction commencing nine months following receipt of the environmental licence. As the environmental licence has not been issued, the resettlement process has not commenced.
| Effective Date January 1, 2021 | Aris Gold | |||
| Page 17 of 384 |
| SRK Consulting | Soto Norte NI 43-101 – Feasibility Study |
| 1.12.5 | Artisanal Mining and Historical Liabilities |
Historically, Minesa’s current tenement areas were held by artisanal miners with small concessions that are considered non-compliant with national law. Significant environmental effects have arisen from these historical workings and processing plants, with monitoring data showing impacts on the La Baja River. Existing adits continue to discharge water affected by acid rock drainage and/or metal leaching, and there is erosion and mobilisation of sediments near the mine workings and processing areas, however, this small-scale mining also provides a significant contribution to local livelihoods.
These small concessions were acquired by successive companies, and lastly by Minesa, with the aim of consolidating a large-scale operation, the Soto Norte Project. Workers of those former tenements were dismissed but continued with illegal mining activities within the now Integrated Concession area. Minesa has notified the mining agency for the relevant risk mitigation actions, which are under review. The Mining Code provides for a legal mechanism in favour of the title holder for disturbances in the area of a mining title caused by third parties (in this case, the illegal miners), called administrative relief (“amparo administrativo”). This includes the eviction of illegal miners from the concession area. Legal action is also possible under the Colombia Penal Code for environmental crimes caused by illegal mining.
Rather than pursuing criminal prosecution, Minesa is prioritising formalisation of the artisanal activities within the concession area through development and implementation of the Coexistence Programme. The purpose of this programme is to help artisanal miners to develop a small-scale mining collective that complies with environmental, labour, technical, and financial requirements. Minesa identified a suitable area within its mining concessions for the miners to carry out their currently disperse activities in a more concentrated and formalised manner that reduces environmental impact and increases physical and social security for those involved.
To date, the negotiations for the mining development proposal for informal miners (Calimineros) have been completed. The signing of the Formalisation Subcontract, as well as the start and filing of an EIA and the PTO for the formalised activities, is planned for the months following the receipt of the environmental license for the Soto Norte Project. Negotiations with traditional miners (considered separately from informal miners) have commenced and a business proposal is planned with similar terms to the informal miners. As per global industry standards, any future PTO amendments will be submitted to the mining authority for approvals based on the Project strategic requirements and compliance with regulatory guidelines.
Although the legislation makes it clear that Minesa is not responsible for the environmental liabilities associated with historical artisanal workings, Minesa is working with regulatory authorities to remediate damage where possible. ANM has issued a resolution (VSC-545) giving Minesa permission to close unauthorised mine entrances excavated by illegal miners within Minesa’s 095-68 mining title. Minesa is therefore monitoring the water quality within its concessions at a number of monitoring points that includes areas of historical process plants, and artisanal and illegal mining tunnels. It has been sealing off illegal mines as part of a mine closure program and it has an ongoing program of disassembling process plants and removing contaminants left behind due to past mining and processing activities. Minesa intends to fund ongoing rehabilitation out of its 1% Investment Plan.
| 1.12.6 | Environmental Setting |
The Project site is situated in a mountainous region with a wide range of altitudes varying from 1,620 metres above sea level (“masl”) to 4,200 masl. The mountains are incised by steep river valleys, with villages/hamlets scattered along the rivers hugging the slopes of the hills.
| Effective Date January 1, 2021 | Aris Gold | |||
| Page 18 of 384 |
| SRK Consulting | Soto Norte NI 43-101 – Feasibility Study |
The mine area sits within the La Baja catchment, with its two key tributaries (Angostura and Paez) draining the upland páramo. The La Baja stream joins the Vetas River, which ultimately discharges into the Suratá River. The Padilla plant site, including DSF and associated water treatment facilities, have been planned in minor tributaries of the Suratá River.
The project area is characterised by two main ecosystems: the High Andean Orobiome that covers 89% of the area of influence and the Sub-Andean Orobiome that mainly consists of anthropogenic transformed ecosystems. The area of influence does not contain any strategic or sensitive ecosystems, except for the priority areas for conservation established by the National Council of Economic and Social Policy – CONPES 3680. These CONPES areas currently exhibit signs of degradation or transformation of the vegetation cover. The most relevant strategic ecosystem is the páramo; however, the high elevation boundary of the Project footprint is located 300 m below the formally designated Páramo de Santurbán.
| 1.12.7 | Water Management |
The importance of water resources in the vicinity of the Project was recognised early in the Project development process. Several studies were commissioned to collect and evaluate baseline data and use these to develop conceptual and numerical models to evaluate the potential impacts.
Impacts on water resources are an emotive issue for stakeholders and a sensitive issue for regulators. Through the ESIA and supported by modelling and analyses, Minesa has outlined specific management measures to mitigate, control and monitor the impacts on water resources in the area of influence in management programmes.
Due to the greater permeability of the rocks around the mine workings, inflow of groundwater is expected. This inflow will be managed by grouting certain areas to minimise the volumes entering the workings and by directing inflow to a water treatment plant so that it can be treated and discharged according to the standards of the discharge permits. The groundwater modelling predicts a zone of drawdown around the workings and the Padilla access tunnel over the life of the mine.
From an ecological perspective, there are two potential and perceived issues related to this drawdown:
| • | Potential risks to aquatic ecosystems reliant on the La Baja stream, which may be affected during periods of dry weather when the rivers are no longer fed by groundwater discharge. Minesa will monitor the flow in the La Baja stream in accordance with standard industry practices and will add water to the system to maintain minimum ecological flow requirements, as determined in agreement with ANLA. |
| • | Perceived risks to the sensitive páramo habitat located upgradient of the mine workings. Based on the findings of the studies, the risk of dewatering activities impacting the ecologically sensitive vegetation of the páramo is negligible. Shallow groundwater conditions are present within the páramos, and its ecologically sensitive vegetation is sustained by occult precipitation (fog and drizzle) and reduced evapotranspiration of the land and vegetation. There is limited hydraulic connection between the páramo and the La Baja valley, and the moisture rich organic superficial soils of the páramo are disassociated from the deeper groundwater. Furthermore, no dewatering impacts are expected to propagate as far as the páramo as the mine intends to manage this by grouting areas of inflow potential where necessary, particularly in the La Bodega zone to the east and closest to the páramo. |
Based on the groundwater modelling, the main water supplies to villages such as California are not expected to be impacted by the drawdown. Minesa has guaranteed the availability of water resources for users potentially affected by impacts from drawdown (if any) or changes to stream flow, in the EMP.
| Effective Date January 1, 2021 | Aris Gold | |||
| Page 19 of 384 |
| SRK Consulting | Soto Norte NI 43-101 – Feasibility Study |
Geochemical studies have been completed to develop an understanding of the weathering behaviour of the mine waste (dry filtered tailings and waste rock) and exposed materials in the underground mine, and to ascertain whether contact waters could present a risk to the environment through acid rock drainage and/or metal leaching (“ARDML”) during operations and on closure.
Based on kinetic testing data, it is considered that the dry filtered tailings are unlikely to generate acid during operations as the surface will be continually renewed by deposition of fresh dry filtered tailings. The waste rock deposited in the DSF will likely have the potential to be acid generating, however, as the materials will be co-disposed, the waste rock will be buried/smothered by compacted dry filtered tailings, limiting oxidation and acid release.
Subject to the results of pilot testing, the DSF seepage will be passed through a high-density sludge plant to remove metals, an ion exchange plant to remove uranium (if required) and a rotating biological contactor to remove nitrogen species. At closure, the DSF will be covered with a low permeability cover to reduce infiltration. This will decrease the rate of drainage from the facility. Current predictions from the groundwater model suggest the seepage at closure from the DSF will not require treatment to meet effluent limits, but this will continue to be monitored and confirmed as the Project progresses.
The predicted composition of the underground contact water is expected to remain around pH 8 and the concentrations of several metal constituents are not expected to exceed the mine water effluent standards, however, the models predict concentrations of cadmium and zinc could exceed the proposed feasibility study effluent criteria, which will be monitored and treated to the necessary standard, if required.
The models indicate that solute treatment may be required, and that solute loading could potentially be reduced by optimising the management of waste rock backfill. For instance, cementing or encapsulating the waste rock to reduce the contact/flushing could reduce the rate of solute release and therefore reduce the treatment requirements.
Given the sensitivity of water-related aspects in underground mining, Minesa has committed to implementing robust follow-up and monitoring plans to control the effectiveness of the planned measures, which are expected to be scrutinised by regulators, academic and professional organizations, local communities, government and other key stakeholders. The costs for implementing these measures are included as either capital and/or operational costs for each individual project component.
The impacts and associated management programmes related to water resources have been presented to stakeholders inside and outside the area of influence (local and regional communities, mining and environmental authorities, government officials, academic representatives, etc), by means of the ongoing socialisation and communication process.
| 1.13 | Cost Estimates |
| 1.13.1 | Capital Costs |
The capital cost estimate has a base date of Q3 2019 which has been escalated accordingly. The estimate is expressed in United States dollars (USD) and uses a flat exchange rate of 3,600 COP to the USD.
The overall range accuracy of the capital expenditure estimate is considered to fall into the Expected Accuracy Range for an American Association of Cost Engineers (“AACE”) Class 3 Estimate (Typical Variation Low: -10% to -20%, and High: +10% to +30%).
| Effective Date January 1, 2021 | Aris Gold | |||
| Page 20 of 384 |
| SRK Consulting | Soto Norte NI 43-101 – Feasibility Study |
Where possible, the existing vendor supply and construction contractor pricing was utilised following review and validation by the SNC engineering and estimation teams to develop the direct and sustaining capital cost estimate.
The estimated capital expenditure for the LoMP is presented in Table 1.4, excluding any operating costs incurred during the pre-production period.
Table 1.4: LoMP Capital Expenditure Estimate (excluding pre-production operating costs)
| Capital Expenditure | Units | Project | Sustaining/
|
Total LoM | ||||
| Mining |
||||||||
| Growth |
(USDm) | 172 | - | 172 | ||||
| Development |
(USDm) | 92 | 44 | 136 | ||||
| Equipment |
(USDm) | 25 | 180 | 205 | ||||
| Labour |
(USDm) | 62 | - | 62 | ||||
| Other |
(USDm) | 31 | 20 | 52 | ||||
| Mining Total |
(USDm) | 383 | 244 | 627 | ||||
| Processing/DSF/EPCM |
||||||||
| EPCM |
(USDm) | 54 | 37 | 90 | ||||
| Process Plant |
(USDm) | 139 | - | 139 | ||||
| Water Services |
(USDm) | 37 | - | 37 | ||||
| Dry Stacking/Material Handling |
(USDm) | 6 | - | 6 | ||||
| Distributed Control System (DCS) |
(USDm) | 4 | - | 4 | ||||
| Mobile Equipment |
(USDm) | 10 | 33 | 43 | ||||
| Processing/DSF/EPCM Total |
(USDm) | 250 | 69 | 319 | ||||
| Other EPC |
||||||||
| Roads Access - Offsite |
(USDm) | 12 | - | 12 | ||||
| Site Utilities |
(USDm) | 134 | 0 | 134 | ||||
| Other Contracts / POs |
(USDm) | 84 | - | 84 | ||||
| Other EPC Total |
(USDm) | 231 | 0 | 231 | ||||
| Owner’s Cost |
(USDm) | 9 | - | 9 | ||||
| G&A |
(USDm) | 3 | 5 | 8 | ||||
| Contingency |
(USDm) | 138 | - | 138 | ||||
| Total |
(USDm) | 1,014 | 318 | 1,333 | ||||
| (USD/t ore) | 53.8 | |||||||
| (USD/oz Au) | 306.5 |
1.13.2 Operating Costs
The estimate applies 2020 USD estimates as a basis with a nominal accuracy of +/-15%. The estimates have been escalated from 2019 to 2020 prices according to the official CPI rates for COP and USD which are 1.61% and 1.4%, respectively.
The mine operating costs were developed based on first principle estimation techniques and, where possible, quotes were sourced for the supply of equipment and consumables. In the event that quotations were of similar quality, a preference was given to local suppliers in order to align with Minesa’s sustainable social management program.
Total estimated LoMP operating costs are presented in Table 1.5, and the annual schedule is shown in Figure 1.3 (excluding post closure environmental monitoring costs). The pre-production period is considered up to Year 05 Q1 (from NTP), and while the values for this period are included in Table 1.5, they are excluded from Figure 1.3, as they are considered capitalised.
| Effective Date January 1, 2021 | Aris Gold | |||
| Page 21 of 384 |
| SRK Consulting | Soto Norte NI 43-101 – Feasibility Study |
Table 1.5: LoMP Operating Cost Estimate
| Operating Costs | Units | Pre- production |
Production | Post- Closure |
LoM | |||||
| Mining |
||||||||||
| Development |
(USDm) | - | 64 | - | 64 | |||||
| Ore Production |
(USDm) | - | 71 | - | 71 | |||||
| Equipment |
(USDm) | - | 191 | - | 191 | |||||
| Labour |
(USDm) | - | 213 | - | 213 | |||||
| Power |
(USDm) | - | 54 | - | 54 | |||||
| Other |
(USDm) | - | 100 | - | 100 | |||||
| Mining Total |
(USDm) | - | 693 | - | 693 | |||||
| Processing |
||||||||||
| Labour |
(USDm) | - | 17 | - | 17 | |||||
| Consumables |
(USDm) | - | 141 | - | 141 | |||||
| Maintenance |
(USDm) | - | 41 | - | 41 | |||||
| Power |
(USDm) | - | 100 | - | 100 | |||||
| Mobile Equipment |
(USDm) | - | 8 | - | 8 | |||||
| Other |
(USDm) | 6 | 0 | - | 6 | |||||
| Processing Total |
(USDm) | 6 | 307 | - | 313 | |||||
| Realisation |
||||||||||
| Treatment Charges |
(USDm) | - | 251 | - | 251 | |||||
| Refining Charges |
(USDm) | - | 56 | - | 56 | |||||
| Penalties |
(USDm) | - | 50 | - | 50 | |||||
| Freight |
(USDm) | - | 231 | - | 231 | |||||
| Realisation Total |
(USDm) | - | 589 | - | 589 | |||||
| Environmental Management Plan |
(USDm) | 62 | 38 | 15 | 116 | |||||
| Mine Site G&A |
(USDm) | 45 | 85 | 0 | 131 | |||||
| Allocated Overhead Costs |
(USDm) | 47 | 160 | 0 | 208 | |||||
| Royalties |
(USDm) | 0 | 272 | 0 | 272 | |||||
| Closure |
(USDm) | - | 10 | 30 | 41 | |||||
| Change in Working Capital |
(USDm) | 5 | 5 | 0 | 10 | |||||
| Total |
(USDm) | 166 | 2,160 | 46 | 2,372 | |||||
| (USD/ore) | 6.7 | 87.2 | 1.9 | 95.8 | ||||||
| (USD/oz Au) | 38.1 | 496.8 | 10.6 | 545.5 |
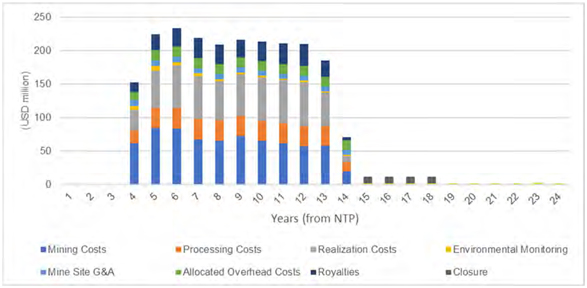
Figure 1.3: LoMP Operating Cost Schedule
| Effective Date January 1, 2021 | Aris Gold | |||
| Page 22 of 384 |
| SRK Consulting | Soto Norte NI 43-101 – Feasibility Study |
| 1.14 | Economic Analysis |
SRK has undertaken an economic evaluation to assess and confirm the Probable Mineral Reserve estimate, as reported in this Technical Report, comprising 24.8 Mt at 6.22 g/t Au, 34.4 g/t Ag and 0.19% Cu, producing on average 450 koz of payable gold per annum over the steady state production years (NTP years 5-13).
The economics are presented on a 100% attributable basis (versus a part equity ownership basis). The financial model is expressed in real money terms at a NTP date. The financial analysis has been conducted using metal price assumptions of USD1,675 per ounce of gold, USD20 per ounce of silver, and USD3 per pound of copper. These metal prices were selected as being in line with the median of the long-term forecasts of a group of banks and financial institutions, as at the end of December 2020.
The economic evaluation has been conducted on a post-tax, pre-finance basis, in real money terms. The Project cash flows are therefore assessed before the impact of debt interest and repayment calculations. The currency presented below is in USD, with an assumed exchange rate of COP3,600 per USD.
The results of the economic evaluation are presented in Table 1.6. Undiscounted payback is achieved 3.9 years after the start of processing (NTP = 4).
At a base 5% discount rate, the post-tax net present value (“NPV”) of the Project is USD1,486m with an internal rate of return (“IRR”) of 20.8%. A sensitivity to discount rate is shown in Table 1.7.
The cash flows schedule on an undiscounted basis is shown in Figure 1.4 (not shown are the post closure environmental monitoring costs).
Table 1.6: Economic Evaluation Results
|
Key Indicators
|
Units
|
Breakdown
|
Total
| |||
| LOM Total Au Production (payable) |
(koz) | 4,348 | ||||
| Average Annual Production |
(koz) | 450 | ||||
| LOM Average Net C1 Cash Cost (1) |
(USD/oz) | 271 | ||||
| LOM Average AISC (2) |
(USD/oz) | 471 | ||||
| LoM (Mining) |
(Years) | 14 | ||||
| LoM (Processing) |
(Years) | 11 | ||||
| Gross Revenue |
(USDM) | 7,946 | ||||
| Operating Costs (incl. realisation) |
(USDM) | (2,211) | ||||
|
| ||||||
| EBITDA |
(USDM) | 5,735 | ||||
| Tax |
(USDM) | (1,480) | ||||
| Project Capital |
(USDM) | (982) | ||||
| Pre-production Sustaining Expenditure |
(USDM) | (34) | ||||
| Capitalised Operating Expenditure |
(USDM) | (114) | ||||
| Capitalised Allocated Overhead Costs |
(USDM) | (47) | ||||
|
|
||||||
| Initial Capital including pre-production costs |
(USDM) | (1,177) | ||||
| Sustaining |
(USDM) | (317) | ||||
|
| ||||||
| Net Free Cash, Undiscounted |
(USDM) | 2,761 | ||||
| NPV at 5% (Post-Tax) |
(USDM) | 1,486 | ||||
| IRR (Post-Tax) |
(%) | 20.8 | ||||
| Payback period (from start of operations, NTP = 4) |
(Years) | 3.9 | ||||
1 C1 cash costs exclude royalty and allocated overheads, inclusive of by-product credit and capitalised operating costs.
2 AISC as per World Gold Council.
| Effective Date January 1, 2021 | Aris Gold | |||
| Page 23 of 384 |
| SRK Consulting | Soto Norte NI 43-101 – Feasibility Study |
Table 1.7: NPV at Variable Discount Rates
|
Discount rate
|
Units
|
Pre-Tax NPV
|
Post Tax NPV
| |||
| 0.0% |
(USDm) | 4,242 | 2,761 | |||
| 2.0% |
(USDm) | 3,398 | 2,166 | |||
| 4.0% |
(USDm) | 2,721 | 1,689 | |||
| 5.0% |
(USDm) | 2,433 | 1,486 | |||
| 7.0% |
(USDm) | 1,941 | 1,142 | |||
| 9.0% |
(USDm) | 1,542 | 863 | |||
| 10.0% |
(USDm) | 1,370 | 744 | |||
| 12.0% |
(USDm) | 1,075 | 539 | |||
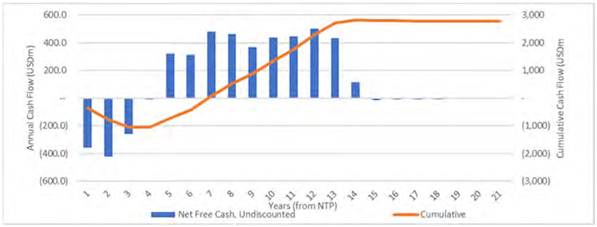
Figure 1.4: Net Free Cash Flow Schedule
Generic sensitivities on metal prices, operating costs, and capital expenditure, are presented in Figure 1.5, which shows that the project economics are most sensitive to metal prices but are sufficiently robust to remain economically positive over the range of cost increases assessed.
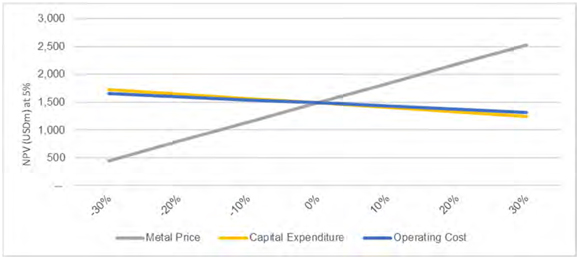
Figure 1.5: NPV (5%) Sensitivity to Metal Price and Costs
The economic evaluation demonstrates the economic viability of the Mineral Reserve under the currently assumed valid set of assumptions, as presented above.
| Effective Date January 1, 2021 | Aris Gold | |||
| Page 24 of 384 |
| SRK Consulting | Soto Norte NI 43-101 – Feasibility Study |
| 1.15 | Conclusions |
The Soto Norte Project is anticipated to become one of the largest and most technologically advanced, underground hard-rock mines in Colombia in the coming years. Minesa has taken a long-term view of the Project with an approach to incorporate significant development, infrastructure and equipment capital investment which should provide greater efficiencies and the benefit of lower operating costs. The parallel vein systems in the Soto Norte Project area are defined over a strike length of 2.6 km and the two main vein systems considered, Mascota and Gigante, each have strike lengths of around 2.0 km. Other minor vein structures of mining interest have strike lengths as low as 15 m. The vein structures extend to surface, and are open at depth and along strike, presenting opportunities for expansion through exploration drilling.
The 14-year life of mine plan and economic analysis are based on a Probable Mineral Reserve estimate of 24.8 Mt at 6.22 g/t Au, 34.4 g/t Ag, and 0.19% Cu, producing on average 450 koz of payable gold per annum over the steady state production years. Life of mine capital expenditures are estimated at USD1,014m. Undiscounted payback is achieved 3.9 years after the start of processing. At a base 5% discount rate, the post-tax NPV of the project is USD1,486m with an internal rate of return of 20.8%.
Extensive trade-off studies, detailed modelling exercises and feasibility study revisions (following external reviews) have taken place to further optimise and de-risk the Project. Practical solutions have been determined for locating surface infrastructure and underground access in challenging terrain in order to minimise impact to settlements in the vicinity of the Project as well as materials handling and sourcing of waste underground for backfill requirements.
The Minesa Risk Management Framework defines the systematic application of management policies, procedures and practices to the activities of setting risk appetite, identifying, analysing, evaluating, treating, monitoring and reviewing risk. Effective risk management can minimise the potential for a project or operation to suffer unplanned and unwanted events and outcomes. Selected Risk levels by SRK, included in the Risk Register, are summarised below:
| ● | Coexistence Program: Minesa has sought to preserve traditional mining practice in California (specifically within the Soto Norte Project area) while reducing incursions on Minesa’s land and the environmental contamination arising from the artisanal miners’ use of mercury and cyanide. |
| ○ | The highest risks identified for Coexistence are: |
| – | Illegal Mining and community unrest. |
| – | Inadequate community relationships / Loss of social license to operate. |
| ○ | Minesa has created the Coexistence Program to consolidate and formalise artisanal miners under an organisational structure to provide them access to better mineral resources, safer working conditions, and more environmentally sustainable infrastructure. |
| ● | Project Execution: The highest risks identified are: |
| ○ | Delays in obtaining land access. |
| ○ | Inadequate roads and key infrastructure. |
| ○ | Incorrect TBM & other critical path contractor selection. |
| ○ | Long lead items delay. |
| • | Environment Management Plan: The highest risks identified are: |
| Effective Date January 1, 2021 | Aris Gold | |||
| Page 25 of 384 |
| SRK Consulting | Soto Norte NI 43-101 – Feasibility Study |
| ○ | Delay in approval of ESIA. |
| ○ | Rejection or additional conditions by the ANLA. |
| ○ | Public perception of negative effects that mining will have on the environment. |
| ● | Marketing: The Soto Norte Project will produce a copper concentrate with high gold content and a gold bearing pyrite concentrate. Both concentrates are regarded as precious metal concentrates because most of the value is due to the gold content. |
| ○ | The highest risks identified for marketing are: |
| – | Volatility of commodity prices. |
| – | Failure of an off taker to take the volume. |
| ○ | Minesa has previously engaged BlueQuest Resources AG to assist in the development of a comprehensive marketing and logistics strategy and set up its in-house marketing team to further engage with potential offtakers. |
Minesa has the risk management plan developed to define the responsibilities and activities to implement effective risk management to the pre-execution, execution and operation project phases. Other potential risks identified by SRK for the Project include:
| ● | Mine Development and Production: |
| ○ | Development rates will be reliant on investigating and successfully managing ground and water conditions ahead of development. |
| ○ | Grade control is essential for stope delineation, prior to mining in order to manage mining recovery and dilution. |
| ○ | Stope (and pillar) stability will need to be continuously monitored and managed through backfill and pressure grout stabilisation. |
| ● | Environmental Permitting: Due to uncertainties on the timing for future award of permits the project schedule is based on a yet to be determined NTP. Minesa will need to prepare a strategy and timeline for project development as well as permitting through discussions with its advisors and the government regulators. Minesa will need to continue working closely with the regulatory authorities and provide detailed information to prove the effectiveness of the planned mitigation measures to manage the various impacts. |
There are numerous opportunities to further investigate and optimise the project development plan leading into a producing mine. There are a couple of years of project development time once NTP commences where additional geotechnical and hydrogeological investigation can be undertaken to better understand the challenges and appropriate means of management.
SRK believes that with good quality management and a commitment to investment, these challenges can be overcome which is incorporated into the mining approach. The lead time to develop access into the mine provides an opportunity to investigate and gather key geotechnical and hydrogeological data to inform a future, more detailed mine plan. The mine design and schedule can be further optimised with respect to mining methods, backfill approach and materials handling, particularly in the initial years of the mine life.
There will be significant opportunities for refinement of the mine plan as it is developed, particularly how to treat and support challenging ground and water conditions for development and stability of production
| Effective Date January 1, 2021 | Aris Gold | |||
| Page 26 of 384 |
| SRK Consulting | Soto Norte NI 43-101 – Feasibility Study |
stopes. Where possible, the opportunities for increasing stope sizes to reduce the stope turnover and minimise development should be investigated.
Minesa has an opportunity to build on its ongoing community development initiatives to maintain its social licence to operate and, by showing a proactive approach to both environmental and social management, show how modern mining can enhance an area rather than degrade it. Commitments to affect this management and monitoring are clearly laid out in the ESIA and should assist in managing the above risks and uncertainties.
The mine design and scheduling work undertaken is sufficiently detailed to have confidence that the currently identified Measured and Indicated Mineral Resources are sufficient in tonnage and grade to achieve a sustainable production rate of 2.6 Mtpa over a 7-year period. The economic assessment undertaken achieves a positive economic outcome under the current set of assumptions as listed, and hence supports the Mineral Reserve estimate. The Project economics are sufficiently robust to remain economically positive over a range of cost increases and metal price decreases.
It is the conclusion of the QPs that the FS summarised in this technical report contains sufficient detail and accuracy to support a feasibility level analysis. Standard industry practices, equipment, and design methods were used in this FS and except for those outlined in this section, the report authors are unaware of any unusual or significant risks or uncertainties that would affect project reliability or confidence based on the data and information made available.
The main priority for the Project is to address the design concerns of ANLA which is likely to require additional studies including a re-evaluation of environmental and social impacts, and re-start of the environmental permitting process and timeframes.
| 1.16 | Recommendations |
Key considerations to achieve the planned mine development and production schedule for Soto Norte is the availability of highly skilled management, technical team, mine operators, and maintenance support. Minesa will require significant support from the Owner team, international contractors, and suppliers to develop access and maintain steady state production at a rate of 2.6 Mtpa.
SRK considers that there are several geotechnical risks that will require addressing and mitigating during further study iterations or during preliminary mine development. These are:
| • | The 3D geotechnical model should be expanded to include underground capital infrastructure and proposed quarry stopes that lie outside the current extents of the model. Specific ground investigation programmes will need to be commissioned for these prior to final design and excavation. |
| • | The mine is located in a structurally complex area with a potentially complex in situ stress regime. To improve and validate the numerical modelling site specific in situ stress measurements will be required at some stage. This can either by done in deep boreholes or during initial trial mining. |
| • | For the TBM access tunnel, out of necessity, geotechnical conditions have been interpolated over long distances between site investigation boreholes. Probe drilling will need to be employed during tunnel excavation to confirm ground conditions ahead of the advancing face. |
| • | This geotechnical modelling was conducted using assumed theoretical stresses, however, the models should be computed with real field stress measurements once these become available. |
| Effective Date January 1, 2021 | Aris Gold | |||
| Page 27 of 384 |
| SRK Consulting | Soto Norte NI 43-101 – Feasibility Study |
The mine plan is highly dependent on the ore pass system for underground materials handling and efforts should be directed to optimise the design and cost while minimising the likely risks for production. Some of the main work identified for the underground mining aspects of the Project are summarised as follows:
| ● | Underground electrical and underground communication packages need to be updated. |
| ● | To successfully implement mining of pillars under grout stabilised fill at Soto Norte, laboratory testing and trial pillar extraction will need to be undertaken to refine the equipment, consumables and approach. |
| ● | Further geotechnical numerical modelling is recommended for execution particularly: |
| ○ | The possibility of connection between the uppermost stopes and the surface |
| ○ | The stress state around the decline. |
| ● | Prior to excavating quarry waste stopes, sterilisation drilling should be undertaken to identify any gold mineralisation in the designated areas and refine stope locations. |
| ● | Optimisation of the ventilation design considering: |
| ○ | In the design of the Emboque shaft bottom area, high pressure losses are expected which requires additional design consideration such as larger or parallel drifts. |
| ○ | This study focused on a wide range of operating years to estimate fan and power requirements over the life of the project. Additional modelling of initial start-up of the mine could provide better resolution to this critical stage and could help identify any bottlenecks or potential design issues during the first two years of the development. |
The importance of water resources in the vicinity of the Project was recognised early in the Project development process. SRK recommends the following further work:
| ● | Consider further studies to better predict the dewatering water quality to assess whether temporary water treatment at Emboque will be required and therefore reduce the early project capital. |
| ● | Monitor groundwater inflow rates and piezometer responses during the initial months of mine development and update models and modify design inflow rates where appropriate. |
| ● | Conduct the additional site investigations required to optimise grouting design and establish the viability of dewatering wells in the Emboque decline area. |
| ● | The predictive geochemical models indicate acid rock drainage and metal leaching is a potential for waste rock, dry filtered tailings and mine working contact water, and thus treatment at various locations is planned to manage it appropriately. SRK has identified that further optimisation studies are required to ensure the chosen treatment technologies can produce the required discharge quality. This will need to be confirmed through bench scale and pilot scale testing. |
SRK notes and endorses the following recommendations made by Ausenco in relation to metallurgical testwork:
| ● | Flotation testwork using (simulated) process water, to assess the impact of water quality. SRK adds that such testwork should use site water as the starting water source |
| ● | Geometallurgical testwork extended to weathered and oxidised material |
| Effective Date January 1, 2021 | Aris Gold | |||
| Page 28 of 384 |
| SRK Consulting | Soto Norte NI 43-101 – Feasibility Study |
| ● | Thickening and filtration testwork “at design conditions” for concentrates and dry filtered tailings. |
SRK understands that the selection of a single stage SAG mill was made on the basis of assumptions including a reduced plant footprint requirement and a reduced capital cost for the milling circuit. SRK recommends that the SAG mill is fitted with a twin chamber pulp lifter (Outotec Turbo Pulp Lifter or similar) to maximise the mill’s discharge efficiency.
SRK recommends that future work on the DSF should focus on:
| ● | Further geotechnical testing on representative tailings samples from filtration tests to determine residual strength and whether the materials are contractive or dilative at the point of failure and to determine whether they are at moisture contents representative of those that can be achieved during operation. Additional geotechnical testing should be completed on representative tailings samples from all areas and stages of the LoMP ore to confirm parameters for both future stability analyses and design. |
| ● | Review the footprint area available on the DSF upper deck to ensure there is sufficient area for storage of off-specification dry filtered tailings during periods of high rainfall. |
| ● | The design documentation highlights the importance of managing seepage, drainage and surface water flows to ensure that design constraints are not exceeded. The sizing of the critical contact and non-contact water management features should be updated for design storm annual exceedance probabilities (“AEP”) that are appropriate to a ‘High Consequence’ tailings storage facility. |
| ● | The cost estimates prepared for the DSF design should be updated to reflect additional capital costs associated with forming the proposed benched geometry (basal slope areas) and construction of additional surface and drainage water management features (cut/fill to form access roads and channels and concrete drop structures adjacent to the main embankment; increased drain and pond sizes). Operating cost estimates should also be re-appraised, to ensure that the costs associated with rework and compaction of dry filtered tailings on the DSF are factored into the cost model. |
SRK makes the following recommendations regarding the on-site infrastructure:
| ● | Conduct additional testwork (flow tests and transportable moisture content) to provide more detail on the design of the dry filtered tailings conveyor system from the plant to the edge of the DSF. |
The capital and operating cost estimates have been by numerous contributors including Minesa and third-party consultants. The Project has undergone many changes and would benefit from a full rebuild of first principles cost estimate going forward for the base case with an improved formatting and streamlining of inputs, assumptions and unit cost costs.
| Effective Date January 1, 2021 | Aris Gold | |||
| Page 29 of 384 |
| SRK Consulting | Soto Norte NI 43-101 – Feasibility Study |
| 2 | INTRODUCTION |
| 2.1 | Terms of Reference and Purpose of the Report |
This Technical Report has been prepared for Aris Gold Corporation (Aris) by SRK Consulting (UK) Limited, SNC Lavalin, and Sociedad Minera de Santander S.A.S., to disclose the results of mineral resource and reserve estimates and the results of a Feasibility Study, in accordance with (NI) 43-101 on the Soto Norte Gold Project in Colombia.
The quality of information, conclusions, and estimates contained herein is consistent with the level of effort involved in SRK’s services, based on i) information available at the time of preparation, ii) data supplied by outside sources, and iii) the assumptions, conditions, and qualifications set forth in this report. This report is intended for use by Aris Gold subject to the terms and conditions of its contract with SRK and relevant securities legislation. The contract permits Aris to file this report as a Technical Report with Canadian securities regulatory authorities pursuant to NI 43-101, Standards of Disclosure for Mineral Projects. Except for the purposes legislated under Canadian securities law, any other uses of this Technical Report by any third party is at that party’s sole risk. The responsibility for this disclosure remains with Aris. The user of this document should ensure that this is the most recent Technical Report for the property as it is not valid if a new Technical Report has been issued.
Unless otherwise stated, information, data, and illustrations contained in this Technical Report or used in its preparation have been prepared by the Qualified Persons (QP) for the purpose of this Technical Report.
| 2.2 | Qualified Persons and Details of Site Inspection |
This Technical Report has been prepared based on a technical and economic review by a team of consultants sourced from SRK’s offices in the United Kingdom and USA. These consultants have extensive experience in the mining and metals sector and are members in good standing of appropriate professional institutions. The consultants comprise specialists in the fields of geology and resource estimation; mining engineering and mineral reserves; mining geotechnical engineering; hydrogeology/hydrology; mineral processing; waste and dry filtered tailings engineering; geochemistry; water management; environmental and social; and financial evaluation (hereinafter the “Technical Disciplines”).
SRK will receive a fee for the preparation of this Technical Report in accordance with normal professional consulting practices. This fee is not dependent on the findings of this Technical Report and SRK will receive no other benefit for the preparation of this Technical Report. SRK does not have any pecuniary or other interests that could reasonably be regarded as capable of affecting its ability to provide an unbiased opinion in relation to the Mineral Reserves, the technical economic parameters (“TEP”), the LoMP for the Project and the projections and assumptions included in the various technical studies completed by Minesa, opined upon by SRK and reported herein.
The following individuals, by virtue of their education, experience and professional association, are considered QPs as defined in the NI 43-101 standard, for this Technical Report, and are members in good standing of appropriate professional institutions. Table 2.1 provides a summary of the designated Qualified Persons responsible for the disclosure in this Technical Report and Table 2.2 details of the personal inspections undertaken. SRK was given full access to the relevant data requested and conducted discussions with Minesa technical staff and management as well as other consulting groups who contributed to the Technical Studies. QP certificates of authors are provided in Appendix A.
| Effective Date January 1, 2021 | Aris Gold | |||
| Page 30 of 384 |
| SRK Consulting | Soto Norte NI 43-101 – Feasibility Study |
The MRE was undertaken by Mr Ben Parsons MSc MAusIMM(CP), who is a full-time employee of and Principal Consultant (Resource Geology) at SRK Consulting (US) Incorporated. Mr Parsons is registered as a Member and Chartered Professional Resource Geologist with the Australasian Institute of Mining and Metallurgy, a “professional association” within the meaning of NI 43-101. Mr Parsons has over 19 years’ experience in the mining and metals industry and has sufficient experience which is relevant to the style of mineralisation and type of deposit under consideration and to the activity which he is undertaking to qualify as a QP.
The QP who has reviewed and is responsible for the Mineral Reserve estimate and the LoMP is Mr Chris Bray, BEng, MAusIMM(CP), who is a full-time employee of and Principal Consultant (Mining) at SRK. He is a Member of and Chartered Professional in the Australasian Institute of Mining and Metallurgy, a “professional association” within the meaning of NI 43-101. Mr Bray is a Mining Engineer with over 20 years’ experience in the mining and metals industry, including operational experience in underground gold mines, and as such qualifies as a QP. He has also been involved in the reporting of Mineral Reserves on various properties internationally for over 10 years.
Mr Robert Anderson (Mineral Processing Manager for Minesa) is designated as a non-independent QP for preparation of Sections 13 (Mineral Processing and Metallurgical Testwork) and 17 (Recovery Methods) of this Technical Report due to his extensive involvement with the mineral process and geometallurgical testwork and the consulting groups undertaking the process plant design.
Dr John Willis is an independent Principal Consultant (Mineral Processing) for SRK is designated as the QP for review of Sections 13 (Mineral Processing and Metallurgical Testwork) and 17 (Recovery Methods) of this Technical Report.
Dr Henri Sangam is designated as independent QP for the preparation of Section 18.6 (Dry Filtered Tailings and Waste Management) of this Technical Report. Dr Sangam is a Senior Geotechnical engineer with over 20 years experience in relevant area of tailings and mine waste management. Dr Sangam is a senior consultant with SNC-Lavalin Inc. and has been involved in previous Prefeasibility (“PFS”) and FS work on the Soto Norte Project.
With the exception of Mr Robert Anderson, neither SRK nor the QPs, as identified above, who are responsible for authoring this Technical Report, nor any Directors of SRK have at the date of this Technical Report, nor have had within the previous two years, any shareholding in Minesa, Aris, the Project or MIC, or any other economic or beneficial interest (present or contingent) in any of the assets being reported on. SRK is not a group, holding or associated company of Minesa or Aris. None of SRK’s partners or officers are officers or proposed officers of any group, holding or associated company of Minesa or Aris.
Further, with the exception of Mr Robert Anderson, no Qualified Person involved in the preparation of this Technical Report is an officer, employee or proposed officer of Minesa or Aris or any group, holding or associated company of Minesa or Aris.
Consequently, with the exception of Mr Robert Anderson, SRK, the Qualified Persons and the Directors of SRK consider themselves to be independent of Minesa and Aris, their directors, senior management and MIC.
| Effective Date January 1, 2021 | Aris Gold | |||
| Page 31 of 384 |
| SRK Consulting | Soto Norte NI 43-101 – Feasibility Study |
Table 2.1: Qualified Persons and Contributors to this Technical Report
|
Qualified Persons Responsible for the Preparation of this Technical report
| ||||||||||||
|
Qualified Person
|
Position
|
Employer
|
Independence
|
Date of Last
|
Professional
|
Sections of
| ||||||
| Ben Parsons | Principal Consultant (Resource Geology) |
SRK Consulting (US) | Minesa and Aris | Jul-17 | MSc. MAusIMM(CP) |
7-12, 14 | ||||||
| Christopher Bray | Principal Consultant (Mining) | SRK Consulting (UK) | Minesa and Aris | Feb-16 | BEng, MAusIMM(CP) | 1-6, 15,
16, 18-28 | ||||||
| Robert Anderson | Process Manager | Minesa | Aris | Aug-19 | P.Eng. | 13, 17 | ||||||
| Dr John Willis | Principal Consultant (Mineral Processing) Reviewer | SRK Consulting (UK) | Minesa and Aris | none | PhD, BE (MET), MAusIMM(CP) | 13, 17 | ||||||
| Dr Henri Sangam | Consultant (Geotechnical and Mine Environment) | SNC | Minesa and Aris | Feb-16 | PhD, P.Eng. | 18.6 | ||||||
Table 2.2: Details of Site Inspection by the Qualified Persons and Other Experts
| Qualified Person |
Employer |
Independence |
Expertise |
Date(s) of Visit |
Details of Inspection | |||||
| Ben Parsons | SRK | Minesa and Aris | Mineral Resources | 24 – 27 July 2017 (earlier visits in February and August 2016) | Assess logistical aspects and other practicalities relating to the property, discuss geological interpretation and inspect drill core, review the sample preparation methodology. Ascertain the geological and geographical setting of the Soto Norte deposit. During the site inspection SRK inspected the drilling rig(s), verification of selected sample locations. | |||||
| Christopher Bray |
SRK |
Minesa and Aris |
Mining and Mineral Reserves |
10 to 11 March 2015 | Visit to the Soto Norte project site for familiarisation prior to commencing the early- stage concept study for the Project. Designated SRK Project Manager and mining study lead. | |||||
| 29 February to 01 March 2016 | Kick-off meeting for the Pre-Feasibility study with review of Soto Norte site locations for processing and tailings options, underground exploration adit, core storage facilities, exploration drilling and site offices. Also visited the Impala River Port facilities at Barrancabermeja considered for concentrate logistics. | |||||||||
| Dr Henri Sangam | SNC | Minesa and Aris | Tailings and Waste Management | 29 February to 01 March 2016 | Kick-off meeting for the Pre-Feasibility study with review of Soto Norte site locations for processing, waste rock and tailings, underground exploration adit, core storage facilities, exploration drilling and site offices. Also visited the Impala River Port facilities at Barrancabermeja considered for concentrate logistics. | |||||
| Robert Anderson | SNC | Aris | Mineral Processing | August 14, 2019 | I visited the site several times in 2019 while resident at the Bucaramanga office including participating in the site visit for EPCM contract bidders and the Ausenco Optimization commencement meetings. | |||||
| Other Experts | Employer | Independence | Expertise | Date(s) of Visit | Details of Inspection | |||||
| Fiona Cessford | SRK | Minesa and Aris | Environmental, Social and Permitting | 10 to 11 March 2015 | Visit to the Soto Norte project site for familiarisation prior to commencing the early- stage concept study for the Project. Designated SRK lead for Environmental and Social aspects also following up on tenement obligations, water management and geochemistry considerations. | |||||
| Mark Raynor | SRK | Minesa and Aris | Water Management | February 2017 | Visits to Soto Norte project site, including inspection of the Paez valley (Páramo), La Baja walkover survey, inspection of Padilla TSF site. Meeting with client geologists, geotechnical engineers and mining engineers. Presentation of groundwater modelling results and workshop to discuss dewatering and mine water management plan. |
| Effective Date January 1, 2021 | Aris Gold | |||
| Page 32 of 384 |
| SRK Consulting | Soto Norte NI 43-101 – Feasibility Study |
| 2.3 | Sources of Information |
SRK’s opinion contained herein is based on its review of the technical and scientific information provided to SRK by Minesa throughout the course of its investigations. SRK has relied upon the work of other consultants in the project areas in support of this Technical Report, which is primarily the Feasibility Study managed by SNC, with major authoring contributions from Minesa and SRK.
SRK has conducted a review (which specifically excludes independent verification by means of recalculation) and assessment of all material technical issues likely to influence the Technical Information included in the LoMP and the associated TEP, which included:
| • | Inspection visits to the Project site for technical work from earlier studies as shown in Table 2.1 |
| • | Enquiry of key project and head office personnel from Minesa and consultants (SNC-Lavalin- and Ausenco) who contributed to the Feasibility Study and Environmental Impact Assessment (“EIA”) |
| • | An examination, review and where appropriate identification of the key technical risks and opportunities as they relate to the Technical Information reported herein. |
SRK has also assessed the reasonableness of the macro-economic and commodity price assumptions as currently assumed in the projections for inclusion in the Mineral Resource and Mineral Reserve estimates and the TEP as incorporated in the LoMP and all other Technical Information reported herein.
Accordingly, Minesa has provided technical data to SRK for the purpose of this Technical Report as cited throughout this Technical Report and listed in the References Section 27. SRK confirms that it has performed all validation and verification procedures deemed necessary and/or appropriate by SRK to place an appropriate level of reliance on such technical information.
In presenting the Mineral Resource and Mineral Reserve estimates, TEP, and other technical information as reported in this Technical Report, the following apply:
| • | Measured and Indicated Mineral Resources are inclusive of those Mineral Resources modified to produce Mineral Reserves; that is, they are reported on an ‘inclusive basis’. |
| • | Commodity long-term price (“LTP”) assumptions are as included in the LoMP and reported in Minesa’s financial model |
| • | The forward-looking mine plan is based on commencement milestone referred to as the Notice to Proceed (NTP). The actual timing for the NTP will vary based on project financing and the required permits to be granted by the Government of Colombia. |
| 2.4 | Effective Date |
The effective date of this Technical Report is 01 January 2021 (the “Effective Date”) with reliance on:
| • | The Mineral Resource estimate reported in accordance with the NI 43-101 guidelines and the 2014 Canadian Institute of Mining and Metallurgy definition standards for reporting Mineral Resources and Mineral Reserves (the “2014 CIM Definition Standards”) with an effective date of 22 May 2019 |
| • | The Mineral Reserve estimate reported in accordance with the NI 43-101 guidelines and the 2014 CIM Definition Standards, with an effective date of 01 January 2021. |
| Effective Date January 1, 2021 | Aris Gold | |||
| Page 33 of 384 |
| SRK Consulting | Soto Norte NI 43-101 – Feasibility Study |
| 2.5 | Units of Measure |
Currency is expressed in United States dollars (USD) unless stated otherwise; units presented are typically metric units, such as metric tonnes, unless otherwise noted.
| Effective Date January 1, 2021 | Aris Gold | |||
| Page 34 of 384 |
| SRK Consulting | Soto Norte NI 43-101 – Feasibility Study |
| 3 | RELIANCE ON OTHER EXPERTS |
| 3.1 | Introduction |
The QPs have relied upon the following other expert reports, which provided information regarding mineral rights, surface rights, property agreements, royalties, environmental, permitting, closure planning and social and community impacts, depreciation/taxation and marketing included in sections of this Technical Report.
| 3.2 | Mineral Tenure, Surface Rights and Royalties |
SRK has confirmed that the Mineral Resources reported herein are within the licence boundaries given below. SRK has not performed an independent verification of land title and tenure as summarised in Section 4 of this Technical Report. The QPs have not independently reviewed ownership of the Project area and any underlying property agreements, mineral tenure, surface rights, or royalties. The QPs have fully relied upon, and disclaim responsibility for, information derived from Minesa and legal experts retained by Minesa for this.
This information is used in Section 4 of the Report. The information is also used in support of the Mineral Resource estimate in Section 14, the Mineral Reserve estimate in Section 15, and the economic analysis in Section 22.
| 3.3 | Market Studies, Contracts, and Logistics |
The QPs have not independently reviewed the marketing or metal price forecast information. The QPs have fully relied upon, and disclaim responsibility for, information derived from Minesa staff and experts retained by Minesa for this information through the document “BlueQuest Resources AG marketing and logistics strategy”.
This information is used in Section 19 (Market Studies and Contracts) and in support of the financial analysis in Section 22 and the Mineral Reserves estimate in Section 15. Metals marketing, global concentrate market terms and conditions, and metals forecasting are specialised businesses requiring knowledge of supply and demand, recent economic activity and other factors that are highly specialised. The QPs consider it reasonable to rely upon BlueQuest Resources AG for such information as the company is known as a leading commodity trading house, active in the global physical trade of refined non-ferrous metals, minerals, non-ferrous and precious metal concentrates and provides independent analysis and advice on assets, companies and markets to these industries.
| Effective Date January 1, 2021 | Aris Gold | |||
| Page 35 of 384 |
| SRK Consulting | Soto Norte NI 43-101 – Feasibility Study |
| 4 | PROPERTY DESCRIPTION AND LOCATION |
| 4.1 | Project Location |
The Soto Norte Project an advanced exploration stage underground gold project located in the Soto Norte Province of the Santander Department. Communities located inside or in the vicinity of the area of influence are the rural municipalities of California, Suratá, Matanza, Vetas, Charta, and Tona. These six municipalities make up the province of Soto Norte.
The Soto Norte Project is being developed under the 095-68 mining concession contract. Since taking ownership in 2015, MIC owns the following companies: “Sociedad Minera de Santander – Minesa”, “Sociedad Minera Calvista Colombia SAS” and “Galway Resources Holdco Ltd Colombia Branch” that in turn hold the various mining tenements.
The Soto Norte Project (Figure 4.1) is located within a traditional mining area called California - Vetas at approximately 350 km north of Bogota and 55 km northeast of the city of Bucaramanga, the capital of Department of Santander. The Project is situated 9 km NE from the town of California.
Location coordinates in Universal Transverse Mercator (“UTM”) of the area that encloses Soto are as follows:
| • | North: 1,306,000 - 1,308,000 |
| • | East 1,128,000 - 1,130,000. |
| Effective Date January 1, 2021 | Aris Gold | |||
| Page 36 of 384 |
| SRK Consulting | Soto Norte NI 43-101 – Feasibility Study |
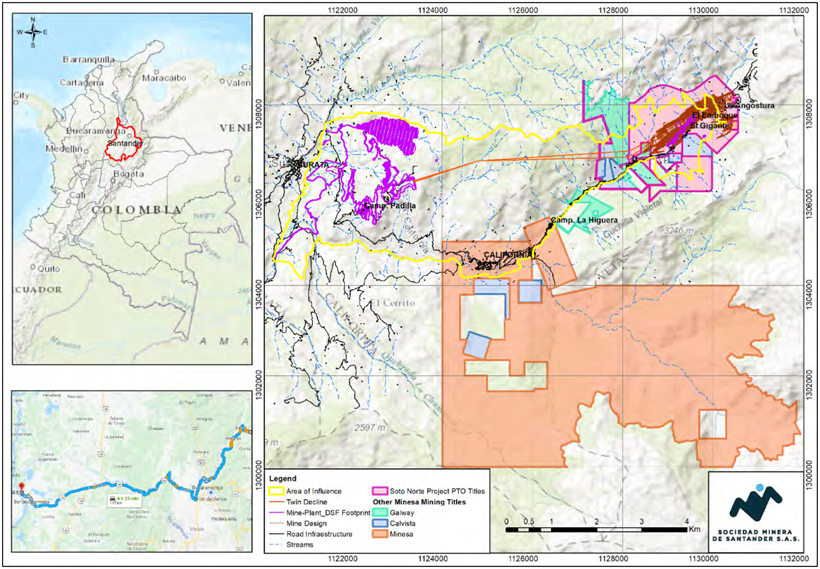
| Figure 4.1: | Soto Norte Project Location |
| Effective Date January 1, 2021 | Aris Gold | |||
| Page 37 of 384 |
| SRK Consulting | Soto Norte NI 43-101 – Feasibility Study |
| 4.2 | Property Ownership |
MIC is the 100% owner of the Minesa Group, consisting of AUX Colombia S.A.S. (AUX), currently known as Sociedad Minera de Santander (Minesa), Sociedad Minera Calvista Colombia S.A.S. (Calvista) and Galway Resources Holdco Ltd. Sucursal Colombia (Galway), as part of the redemption of Mubadala’s original investment in the Brazil-based EBX Group. Minesa is the 100% owner of the Soto Norte Project.
Section 20.3 provides a summary of the rights and obligations associated with mining titles in Colombia as well as the status of the Soto Norte Project as of the Effective date with respect to the ESIA and permitting process and the permissions required to secure an environmental license and mining concession.
| 4.3 | Concessions (Titles) |
Minesa and its affiliates Galway and Calvista hold 21 mining titles (Table 4.1) in the Soto Norte area.
The Soto Norte Project is developed in Concession 095-68 and has a PTO approved by the National Mining Agency (ANM) as a program of mine development and production, Act number 000195 of October 13th, 2017. The area of the Integrated Concession 095-68 resulted from the integration of areas of concession contracts 095-68 and HDB-081 approved by ANM by means of Resolution No. 002922 dated November 6th, 2015; the area also undertook an exploration program approved by the ANM under writ VSC No. 000210 dated October 26th, 2015.
Minesa plans to strategically integrate concessions through Article 101 of the Colombian Mining Code. Article 101 states that titles may be integrated if they are contiguous or neighbouring and where mineral occurrence within the titles can be demonstrated to be part of the same deposit. In addition to the first requirement, further exploration must be demonstrated through the structure of an Exploration and Exploitation Program (“Programa Único de Exploración y Explotación” or “PUEE”). It must be noted that the PUEE can only consist of subsurface exploration (drilling programs and exploration tunnels) and excludes primary exploration methods (soil sampling, surface chip sampling, geophysics). Figure 4.2 shows the standalone concessions of Minesa with the legend indicating the company to which they belong: Minesa, Galway or Calvista.
Once approved by the mining authority, some of the titles currently held by Minesa will be consolidated into independent concessions. Table 4.1 shows how the concessions will be consolidated after the approval.
| Effective Date January 1, 2021 | Aris Gold | |||
| Page 38 of 384 |
| SRK Consulting | Soto Norte NI 43-101 – Feasibility Study |
Table 4.2 provides a summary of the classification, status and expiration dates of the Minesa Mining titles for the Soto Norte Project.
Table 4.1: Soto Norte Mine Titles (Source: Minesa)
| Concession | Titles | |||||
| Soto Norte | 0095-68 | |||||
| San Juan | 037-68 | 100-68 | 108-68 | |||
| 109-68 | 090-68 | 0106-68 | ||||
| 0111-68 | 0144-68 | HDB-08001X | ||||
| HDB-08002X | HDB-08003X | FCC-814 | ||||
| San Marcos | 041-68 | |||||
| San Celestino | 14947 | |||||
| Matacho | 127-68 | |||||
| La Plata | 13921 | |||||
|
Independent |
132-68 | |||||
|
Independent |
0099-68 | |||||
|
Independent |
125-68 | |||||
|
Independent |
14031 |
Note: that concession 0125-68 will not be part of the integration process as it will form part of a coexistence project outlined in Section 21.0 (Coexistence). The remaining concessions could not be integrated as they did not meet the integration criteria as determined by Colombian Law.
| Effective Date January 1, 2021 | Aris Gold | |||
| Page 39 of 384 |
| SRK Consulting | Soto Norte NI 43-101 – Feasibility Study |
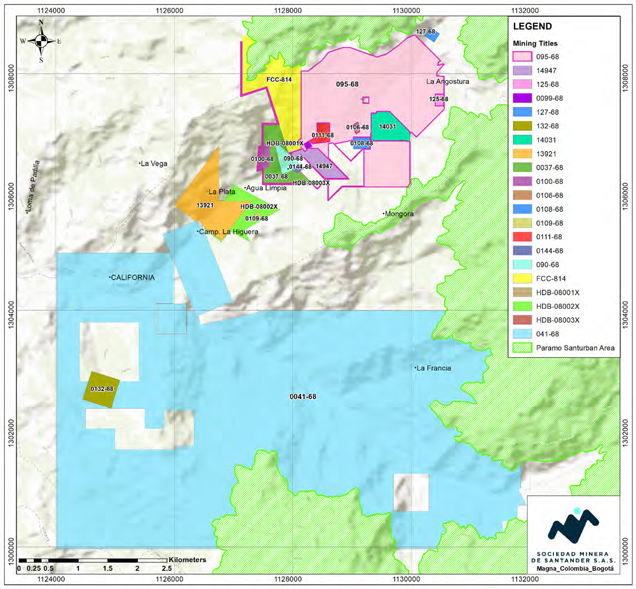
Figure 4.2: Minesa, Galway and Calvista Mine Titles (Source: Minesa)
| Effective Date January 1, 2021 | Aris Gold | |||
| Page 40 of 384 |
| SRK Consulting | Soto Norte NI 43-101– Feasibility Study |
Table 4.2: Soto Norte Mining Title Status
| Mining Title |
Classification | Area (ha) | Title Holder | RMN1 Registration Date |
Status | Expiration Date | ||||||
| 095-68 | Concession Agreement | 379.4 | Sociedad Minera de Santander S.A.S | 2016-01-19 | PTO approved by the mining authority of Colombia, through Act No. 000195 of October 13, 2017. A modified PTO was approved on April 5, 2021 through Act 040. |
2028-06-08 | ||||||
| 037-68 | Exploitation License |
1033.8 | Sociedad Minera Calvista Colombia S.A.S. | 2002-07-12 | Conversion of Exploitation License to Concession Contract requested in accordance with provisions of Article 46 of the Former Mining Code. Request made prior to the concession expiry date and therefore remains active. The expiration date will change once the Concession Contract is granted. Signing of the Contract Concession was required by the mining authority through GEMTN Act No. 249 of June 28, 2021. |
2014-08-19 | ||||||
| 090-68 | Exploitation License |
10.1 | Sociedad Minera Calvista Colombia S.A.S. | 1998-05-21 | Minesa Group exercised the right of preference to obtain a Concession Contract over the same area subject to the Exploitation License, as established by Article 53 of the Current National Development Plan. The expiration date will change once the Concession Contract is granted. |
2018-05-20 | ||||||
| 099-68 | Exploitation License |
1.0 | 85% Galway Resources Holdco Ltd. (merged with Minera Calvista) 15% Edilma Toloza de Guerrero | 1998-06-08 | Minesa Group exercised the right of preference to obtain a Concession Contract over the same area subject to the Exploitation License, as established by Article 53 of the Current National Development Plan. The expiration date will change once the Concession Contract is granted. |
2018-06-07 | ||||||
| 100-68 | Exploitation License |
7.3 | Sociedad Minera Calvista Colombia S.A.S | 1998-05-21 | Minesa Group exercised the right of preference to obtain a Concession Contract over the same area subject to the Exploitation License, as established by Article 53 of the Current National Development Plan. The expiration date will change once the Concession Contract is granted. |
2018-10-08 | ||||||
| 106-68 | Exploitation License |
1.3 | Galway Resources Holdco Ltd. Sucursal Colombia (merged with Minera Calvista) | 1998-06-08 | Minesa Group exercised the right of preference to obtain a Concession Contract over the same area subject to the Exploitation License, as established by Article 53 of the Current National Development Plan. The expiration date will change once the Concession Contract is granted. |
2018-06-07 | ||||||
| 108-68 | Exploitation License |
5.7 | Sociedad Minera Calvista Colombia S.A.S | 1998-10-08 | Minesa Group exercised the right of preference to obtain a Concession Contract over the same area subject to the Exploitation License, as established by Article 53 of the Current National Development Plan. The expiration date will change once the Concession Contract is granted. |
2018-10-08 | ||||||
| 111-68 | Exploitation License |
7.7 | Sociedad Minera de Santander S.A.S | 2009-02-20 | Minesa Group exercised the right of preference to obtain a Concession Contract over the same area subject to the Exploitation License, as established by Article 53 of the Current National Development Plan. The expiration date will change once the Concession Contract is granted. |
2021-02-08 | ||||||
| 144-68 | Exploitation License |
1.4 | Sociedad Minera de Santander S.A.S | 1998-06-08 | Minesa Group exercised the right of preference to obtain a Concession Contract over the same area subject to the Exploitation License, as established by Article 53 of the Current National Development Plan. The expiration date will change once the Concession Contract is granted. |
2018-06-08 | ||||||
| 14031 | Exploitation License |
26.7 | Sociedad Minera Calvista Colombia S.A.S | 1992-06-29 | Conversion of Exploitation License to Concession Contract requested in accordance with provisions of Article 46 of the Former Mining Code. Request made prior to the |
2008-06-08 | ||||||
| 1 | RMN: Registro Minero Nacional (National Mining registry) |
| Effective Date January 1, 2021 | Aris Gold | |||
| Page 41 of 384 |
| SRK Consulting | Soto Norte NI 43-101 – Feasibility Study |
| Mining Title |
Classification | Area (ha) | Title Holder | RMN1 Registration Date |
Status | Expiration Date | ||||||
| concession expiry date and therefore remains active. The expiration date will change once the Concession Contract is granted. |
||||||||||||
| FCC-814 |
Concession Agreement |
132.0 | Sociedad Minera de Santander S.A.S. And Sociedad Minera Calvista Colombia S.A.S | 2007-02-15 | Current |
2037-02-14 | ||||||
| HDB- 08001X |
Concession Agreement | 0.02 | Sociedad Minera de Santander S.A.S. | 2010-03-10 | Current |
2040-03-10 | ||||||
| HDB- 08003X |
Concession Agreement | 0.2 | Sociedad Minera de Santander S.A.S. | 2010-02-24 | Current |
2040-02-24 | ||||||
| 109-68 | Exploitation License | 1.0 | Sociedad Minera Calvista Colombia S.A.S. | 1998-10-02 | Based on the provisions of the Current National Development Plan, application filed on October 21, 2015 for conversion to a Concession Contract. The expiration date will change once the Concession Contract is granted. |
2018-10-01 | ||||||
| 041-68 | Concession Agreement | 2,579.5 | Sociedad Minera Calvista | 2019-08-26 | Current |
2049-08-25 | ||||||
| Colombia S.A.S. and Sociedad |
||||||||||||
| Minera de Santander S.A.S |
||||||||||||
| 132-68 | Exploitation License | 25.0 | Sociedad Minera Calvista | 1998-05-21 | Based on the provisions of the Current National Development Plan, application filed |
2018-05-27 | ||||||
| Colombia S.A.S. | on October 21, 2015 for conversion to a
Concession |
|||||||||||
| will change once the Concession Contract is granted. |
||||||||||||
| HDB- 08002X |
Concession Agreement | 32.8 | Sociedad Minera de Santander S.A.S. | 2010-03-09 | Current |
2040-03-09 | ||||||
| 125-68 | Concession Contract | 3 | Sociedad Minera de Santander S.A.S. | 2020-05-08 | First right executed, in ANM study. The Concession contract was inscribed on the National Mining Registration on May 5, 2020. |
2040-05-07 | ||||||
| 13921 | Concession Agreement | 78.6 | Sociedad Minera Calvista Colombia S.A.S. | 2020-05-27 | Current. |
2040-05-27 | ||||||
| 127-68 | Exploitation License | 3.45 | Sociedad Minera de Santander S.A.S. | 2000-04-19 | Based on the provisions of the Current National Development Plan, application filed on October 21, 2015 for conversion to a Concession Contract. The expiration date will change once the Concession Contract is granted |
2020-04-18 | ||||||
| 14947 | Concession Contract | 20.9996 | Daysi Matilde Moreno Delgado | 2019-09-24 | Current |
2049-09-23 | ||||||
| Effective Date January 1, 2021 | Aris Gold | |||
| Page 42 of 384 |
| SRK Consulting | Soto Norte NI 43-101– Feasibility Study |
| 4.4 | Surface Rights and Access |
Minesa currently owns land within the Suratá, California, Vetas and Matanza municipalities totalling 107.68 ha (some shared with third parties) and rents land totalling 1.04 ha.
Minesa will purchase additional land for project development and operation and has applied for new concessions in the SW of the project area mainly in areas where Minesa has infrastructure planned or where it may need infrastructure or natural resources in the future.
| 4.5 | Royalties and Encumbrances |
Pursuant to Paragraph 9 of Article 16 of Law 141- 1998, royalties shall be liquidated at 4% over 80% of the international price, published by the London Metal Exchange in its meridian past version (average of the month before it will be in force-FIX PM) and converted into USD per gram.
Paragraph 9 of the law states: “The value of the gold, silver and platinum gram at the mine’s entry, adit or border to calculate the royalty, will be eighty per cent (80%) of the International average price for the last month, published by the London Metal Exchange”.
In practice, the value to pay for gold royalties:
| ● | Is already averaged in the London FIX PM |
| ● | Is applied at a rate of 80% |
| ● | Is converted from troy ounces to grams and based upon the value announced every month by the Central Bank (Colombian main bank). |
For the Soto Norte economic assessment, royalties are treated as an in-direct operating cost and payable to the Colombian State at 4% for gold and silver payable on 80% of the previous month’s metal price as per the London Metal Exchange (“LME”), and at 5% for copper in concentrates on 80% of the copper produced based on the government agency for mines and energy (“UPME) price determined at the time of sale.
| 4.5.1 | Insurance Bond |
The Current Mining Code requires a mining and environmental bond to be affected for each concession to ensure compliance with mining and environmental obligations, as follows: 5% of the budget for the annual investment during the exploration and construction and assembly phases, and 10% of the result of multiplying the estimate of annual production (volume) and the price of the mineral at the mine entry.
| 4.6 | Environmental Liabilities and Permitting |
| 4.6.1 | Potentially Material Environmental and Social Matters |
The environmental studies, permitting and social or community impact aspects of the Project are covered in Section 20 and the key issues raised include:
| ● | The closure of the environmental licence application by the regulatory authority, resulting in uncertainty about the likelihood, cost and timeframe for obtaining the environmental licence |
| ● | Potential opposition from local communities, addressed through implementation of the stakeholder engagement plan, resettlement programme and coexistence plan |
| Effective Date January 1, 2021 | Aris Gold | |||
| Page 43 of 384 |
| SRK Consulting | Soto Norte NI 43-101– Feasibility Study |
| • | Perceived and potential impacts on water resources and water users (including communities, sensitive biodiversity and cultural sites), managed through the ABI-03 Water Management programme, specific control measures and proactive management and close monitoring of these receptors to confirm the low impact predictions |
| • | The need for land acquisition and resettlement following approval of the environmental license and potential delays to this process, managed through SOC-02 (Resettlement and Livelihood Restoration Program) and a Framework Resettlement Action Plan (FRAP) |
| • | Management of artisanal mining communities, addressed by the Coexistence Programme, however risk of lack of buy-in or agreement among the artisanal miners to the programme remains. |
| 4.6.2 | Required Permits and Status |
Discussion related to mining in Colombia, the Mining and Environmental Codes, as well as the current status, permits and authorisations necessary for mineral exploration and exploitation is provided in Section 20.3.
| 4.7 | Other Significant Factors and Risks |
There are no known significant factors or risks that may affect access, title or right or ability to perform work on the property with the exception of the future environmental license applications and approval.
| Effective Date January 1, 2021 | Aris Gold | |||
| Page 44 of 384 |
| SRK Consulting | Soto Norte NI 43-101– Feasibility Study |
| 5 | ACCESSIBILITY, CLIMATE, LOCAL RESOURCES, INFRASTRUCTURE, AND PHYSIOGRAPHY |
| 5.1 | Project Setting |
The Project site is situated in a mountainous region with a wide range of altitudes varying from 1,620 masl to 4,200 masl. The mountains are incised by steep river valleys, with villages/hamlets scattered along the rivers hugging the slopes of the hills.
The mine area sits within the La Baja catchment, with its two key tributaries (Angostura and Paez) draining the upland páramo. The La Baja stream joins the Vetas River, which ultimately discharges into the Suratá River. The Padilla plant site, including DSF and associated water treatment facilities, have been planned in minor tributaries of the Suratá River.
The economy of the Department of Santander has shown strong growth in the last decade. The Gross Domestic Product (“GDP”) showed a positive average variation of 4.9% from 2000 to 2015, with a slowdown in 2015 to 2016 due to the general slowing down of the Colombian economy and decline in oil prices.
The Soto Norte province has a population of approximately 23,000, with an estimated 3,459 located in the area of influence. The provincial economy is based on agriculture and mining-related activities. These economic activities are developed differently in each of the Soto Norte municipalities. California, closest to the mine area, is dominated by agriculture, dairy and meat farming, ecotourism (which is growing in importance), and artisanal mining. Suratá, downstream of the Padilla processing and DSF area, has ranching, agriculture, and forestry as its main economic generators. The other municipalities have different combinations of the same types of livelihoods. Population dynamics in the ESIA indicate the working age population is migrating from Suratá to the mining economy in California, presumably as a result of a growing disinterest in agricultural livelihoods in Suratá in contrast to the mining opportunities in California.
| 5.2 | Accessibility |
The Project can be accessed by vehicle from the City of Bucaramanga via 54 km of paved and unpaved road to the town of California and then by 9 km of single-lane dirt road to the Project. The dirt road from California cuts through the centre of the Soto Norte Project, smaller roads and foot trails provide further access throughout the property.
There are several daily jet or turboprop domestic flights from Bogota and Medellin to Bucaramanga. Additionally, international flights to and from Panama City and Fort Lauderdale to Bucaramanga are available. There are three main access roads to Bucaramanga:
| ● | Road Bucaramanga: Santa Marta (539 km): fully paved road, connects the city with the Caribbean coast and is a potential route to transport mineral concentrate out of the country |
| ● | Road Bucaramanga: Bogota (397 km): fully paved road, connects the city with centre of the country and the capital city |
| ● | Road Bucaramanga: Barrancabermeja (115 km): fully paved road, connects the city with Barrancabermeja, a city with a river port that is one potential option to transport mineral concentrate out of the country. This road also has branches that connect with Bogota and Medellin, two of the main cities in the country. |
| Effective Date January 1, 2021 | Aris Gold | |||
| Page 45 of 384 |
| SRK Consulting | Soto Norte NI 43-101– Feasibility Study |
| 5.3 | Climate |
The climate at the Soto Norte Project area is cool and humid. The average annual temperature is 18.5°C, varying with elevation and weather conditions. Two rainy seasons generally occur in September to November and March to May. Average annual precipitation is about 1,025 mm. Exploration and mining activities, including dry stacking, can operate year-round. Evaporation measurements from the Vivero Suratá weather station (~2.3 km from the processing plant location, ~2.0 km from the DSF and ~1.7 km from Padilla camp) from 1968-2012 were used to estimate monthly evaporation and evapotranspiration values at the Project area. Average monthly evaporation ranges between 43 and 237 mm, and evaporation for an average year is 1,415 mm.
The average wind speed during the year is similar for all months, it fluctuates around 1 m/s (0.82 to 1.19 m/s), which indicates “light air” in the Beaufort scale. Maximum wind speeds of 4.9 m/s were recorded during the driest months of the year, January and February, indicating a “gentle breeze” on the Beaufort scale.
| 5.4 | Local Resources and Infrastructure |
The Soto Norte Region has well-developed infrastructure and a local work force familiar with basic mining operations. Minesa has identified that there is enough skilled and unskilled labour in the region for the construction and operational phases of the Project.
Water is in plentiful supply within the Project, with water for drilling, camp, sewage treatment, and other activities readily available from different locations. Permits for the current site infrastructure have been approved by local environmental and municipality authorities.
The current power supply and power grid infrastructure, which feeds the existing Minesa facilities, is provided by the local electrical utility company Electrificadora de Santander S.A (“ESSA”) through a 32 km,
34.5 kV power line. The power line infrastructure starts in Palos, Bucaramanga, passing through substations in Matanza and Portico before reaching El Emboque (mine access and associated infrastructure). This power line supports a maximum demand of 32 MVA. The current installed power capacity at El Emboque is 5 MVA drawn from the main existing power line. It is expected that 10 MVA power demand will be required at the first year of construction with a peak over 36 MVA. Therefore, the existing power grid is not sufficient to meet the Project needs.
Engineering Group, HMV Ingenieros Ltda (“HMV”), and Electrical Utility Group, Interconexión Eléctrica S.A. E.S.P (“ISA”), completed a power connection trade-off study (HMV, 2019) on behalf of Minesa. This study evaluated two possible alternatives, amongst which the favoured option is the construction of a new two circuit, 35 km long, 34.5 kV line, to supply a power demand up to 39.2 MVA. This line will be connected to 230 kV busbar, in Palos substation, through a 230/34.5 kV transformer.
Other than locally available basic supplies, virtually all provisions and equipment for exploration activities and day to day running of the Project are sourced from Bucaramanga or other locations in Santander. The most common items bought in the Soto Norte Region, Santander, and rest of Colombia areas are:
| ● | Soto Norte Region |
| ○ | Drilling services |
| ○ | Fuel |
| ○ | Minor civil works |
| Effective Date January 1, 2021 | Aris Gold | |||
| Page 46 of 384 |
| SRK Consulting | Soto Norte NI 43-101– Feasibility Study |
| ○ | Minor iron works |
| ○ | Transportation services |
| ○ | Catering & landscaping services |
| ○ | Sand and aggregates for minor constructions. |
| ● | Santander Region (including Bucaramanga): |
| ○ | Cement and aggregate (local cement fabrication) |
| ○ | Fuel and petroleum related products (from refinery in Barrancabermeja) |
| ○ | Hardware supplies |
| ○ | Major civil works, scaffolding, equipment |
| ○ | Technical studies (civil, electrical, geotechnical) |
| ○ | Survey services |
| ○ | Electricity supply |
| ○ | Clothing and personal protective equipment |
| ○ | Transportation services |
| ○ | Main office rental and catering |
| ○ | Marketing, communication and advertisement |
| ○ | Insurance policies |
| ○ | Engineering services |
| ○ | Security services. |
| ● | Rest of Colombia: |
| ○ | Engineering services |
| ○ | Professional services (audits, legal and environmental services, etc) |
| ○ | Communications services (promotional videos, etc) |
| ○ | Solar electricity equipment. |
It is envisaged that consumables and general supplies for the pre-construction, construction and operation phases will continue to be sourced locally.
The Project area consists of several areas with infrastructure that are either owned or rented by Minesa (see Section 4.4). Most of these areas will be used for various functions during project construction and/or operation, including:
| ● | La Higuera Camp (lodging, Project administrative control) |
| ● | Padilla Camp (lodging, core storage and emergency response) |
| ● | Social Houses in California, Suratá, and Matanza |
| ● | Coexistence House in California |
| Effective Date January 1, 2021 | Aris Gold | |||
| Page 47 of 384 |
| SRK Consulting | Soto Norte NI 43-101– Feasibility Study |
| ● | El Emboque (mine entrance) |
| ● | El Cuatro (mine entrance) |
| ● | El Portico (core logging area) |
| ● | Calvista (warehouse and workshop) |
| ● | Llano Redondo (core storage). |
Minesa will have to purchase land for project development and operation and has applied for new concessions in the SW of the project area (Error! Reference source not found. and Error! Reference source not found.). The applications mainly consist of areas where Minesa has infrastructure planned or where it may need infrastructure or natural resources in the future. This includes but is not limited to future planned areas designated for process facilities, surface dry filtered tailings and waste storage and underground access at Padilla and associated infrastructure.
ANM will evaluate the application according to the Mining Code, on a first-come, first-serve basis. Once granted, the authority will issue a concession agreement to the applicant (or concessionaire) for the minerals applied for in the specified area.
| 5.5 | Physiography |
Most of the mining facilities are in steep, mountainous and rugged terrain at elevations up to 2,800 masl, where the predominant slopes are within the range of 50-75% and the main landscape feature is a steep valley hosting La Baja stream.
The processing plant and associated facilities will be placed in lower lying land (Municipality of Suratá), in smooth to moderately steep terrain at elevations up to 2,200 masl, where the predominant slopes are within the range of 25 to 50% and a good portion of vegetation cover (forest) is already altered by agricultural activities.
Current topographic (survey) control for the Project is based on a 1 m contour Light Detection and Ranging (“LIDAR”) survey carried out in 2012, with local adjustments for geographic features incorporated using orthophotos and conventional ground surveys.
| 5.6 | Seismicity |
In the case of Colombia, seismicity is mainly related to subduction of the Nazca plate beneath the South American plate, whose interaction has led to the formation of the Andes and the Colombo-Ecuadorian ocean trench. On the continent, this activity has formed different mountain ranges separated by valleys and mountainous depressions, associated mainly along the main fault systems that limit the relief.
Both municipalities, Suratá and California, are classified as “high seismic hazard” category in the National Seismic Map from the Colombian Regulation for Anti-Seismic Construction (“NSR-10”). In addition, Ausenco carried out a specific seismic hazard study for the project area in 2013. The resulting probabilistic peak ground accelerations at bedrock surface (International Building Code (“IBC”) Site Class B) for various return periods, are shown in Table 5.1. Site Class B corresponds to bedrock material, which is not uniform over the Project area. Therefore, seismic amplification parameters were used for specific infrastructure over C-type ground (soft rock/stiff soil), such as the processing plant and the DSF.
| Effective Date January 1, 2021 | Aris Gold | |||
| Page 48 of 384 |
| SRK Consulting | Soto Norte NI 43-101– Feasibility Study |
Seismic design criteria from NSR-10 indicate 0.25 peak ground acceleration for a 1:475 years earthquake, while Ausenco (2013) indicates 0.27 peak ground acceleration for the same return period. The Project’s design criteria use the more conservative earthquake, and therefore, design earthquakes for the project’s infrastructure are based on Ausenco (2013), shown in Table 5.1.
Table 5.1: Peak Ground Accelerations
| Return Period (Year)
|
30 | 50 | 100 | 250 | 475 | 975 | 2,475 | 5,000 | 10,000 | |||||||||
|
Peak Ground Acceleration (G) |
0.12 | 0.14 | 0.17 | 0.23 | 0.27 | 0.33 | 0.40 | 0.47 | 0.55 |
In addition to Ausenco’s report, Geotecnología, a Colombian engineering contractor, developed a site-specific seismic hazard assessment for the DSF, in 2020. This assessment uses a deterministic approach to establish the potential earthquake magnitudes and ground accelerations that could impact the DSF area, as an improvement to Ausenco’s report, this assessment considers the effects of the Suratá Fault, which is the closest and most critical geological structure to the DSF (Geotecnología, 2020). The results show that, the strongest earthquake would be of Momentum Magnitude Scale (“Mw”) 7.44 and the near-source ground acceleration in the DSF (at rock level) would be 0.30g (note that g = 981 cm/s2). This ground acceleration does not consider site amplification effects, such as soil materials, geological structures, and topography.
The DSF Detail Engineering Contractor revised Geotecnología’s report in December 2020 and recommended that it should be further complemented to comply with the state-of-the-art methodologies. This includes two aspects: to re-calculate the earthquake magnitudes and ground accelerations using the NGA West methodologies developed by the Pacific Earthquake Engineering Research (“PEER”) Centre, and to include a probabilistic analysis to complement the existing deterministic approach. These complementary assessments should be carried out as an input for the DSF Detail Engineering.
| Effective Date January 1, 2021 | Aris Gold | |||
| Page 49 of 384 |
| SRK Consulting | Soto Norte NI 43-101 – Feasibility Study |
| 6 | HISTORY |
| 6.1 | Ownership |
The key events in the ownership history are as follows:
| ● | Artisanal miners in the mining district of California-Vetas held small-scale tenements in the area called La Bodega. Ventana Gold Corporation (Ventana), a TSX listed Canadian company, via CVS Explorations Ltda (CVS), a Colombian subsidiary, acquired small-scale tenements from artisanal miners and formed the La Bodega Project in December 2005. |
| ● | CVS owned 100% of the outstanding equity capital of Bodega Ventana Baja S.A.S (BVB), a Colombian company owning an important tenement in the project area. |
| ● | In March 2009, EBX started to buy shares of Ventana through its Proprietary Investments Division as a portfolio investment. |
| ● | In January 2011, EBX continued with the take-over of Ventana with the view to turnaround the technical and management approaches. On 15 February 2011, Ventana agreed to support the AUX Canada bid, as an EBX’s investment vehicle, and the price per share was increased to CDN 13.06. |
| ● | On 27 March 2011, AUX Canada announced that it had successfully completed its acquisition by acquiring 96.7% of Ventana´s shares. AUX Canada then began a compulsory acquisition for the remaining shares. The compulsory purchase of the final 3.3% of Ventana was completed on May 25th, 2011 and valued the business at USD 1,409m. AUX changed the Project name to El Gigante shortly after taking over the project. |
| ● | On 30 June 2011, AUX Canada merged with Ventana and moved from British Colombia to Luxembourg as AUX Acquisitions S.A.R.L (AUX Acquisitions). |
| ● | On 8 August 2011, CVS changed its corporate name to AUX Colombia Ltda and in October 2012, merged with BVB, consolidating the project under AUX Colombia S.A.S. |
| ● | AUX Colombia S.A.S. took over the adjacent Calvista Gold Corporation (Calvista) and Galway Resources (Galway) in December 2012. Calvista completed an arrangement agreement on 11 December 2012, with AUX Acquisitions whereby AUX Acquisitions agreed to acquire all outstanding issued and common shares and in-the-money warrants by way of a statutory plan of arrangement at a price of CDN 1.10 per common share in cash and pay the in-the-money value for the outstanding options (a valuation of USD 63m). |
| ● | Galway (plus a 10% interest in Galway Gold Inc) was acquired by AUX on 20 December 2012, for a total cash consideration of approximately USD 273m. |
| ● | In January 2012, Mubadala Investment Company formed a strategic partnership with EBX through a USD 2.0 billion preferred equity investment. |
| ● | In January 2013, AUX Acquisitions directly owned 100% of the outstanding equity capital of AUX Colombia S.A.S. |
| ● | EBX ran into financial difficulties in 2013 after which Mubadala and EBX entered discussions to restructure Mubadala’s investment in EBX. These discussions led to a series of transactions through which Mubadala took ownership of the Project (amongst other assets) as a redemption on the original investment. |
| Effective Date January 1, 2021 | Aris Gold | |||
| Page 50 of 384 |
| SRK Consulting | Soto Norte NI 43-101 – Feasibility Study |
| ● | From mid-2013 until the first quarter of 2015, the Project was under care and maintenance. |
| ● | MIC took ownership of AUX in February 2015, rebranding both the company AUX Colombia S.A.S to Sociedad Minera de Santander S.A.S. (Minesa) and the Project El Gigante to Soto Norte Project on 6 November 2015. |
| 6.2 | Exploration History |
| 6.2.1 | Ventana |
The first modern exploration program on the Soto Norte Project (then known as the La Bodega Project) was undertaken by Ventana, commencing in December 2005.
At the start of exploration activities, some information was known about the main veins from old workings and current artisanal mining. Also, Greystar Resources, immediately to the NE, had already been carrying out intermittent exploration since 1994 and had published some reports available within the public domain.
In early 2006, Ventana began surface and underground geochemical sampling. This was accompanied by ground magnetic and induced polarisation (“IP”) geophysics and was followed by a separate ground magnetic and pole-dipole IP resistivity surveys. Diamond drilling from surface started in August 2006.
Progress and funding of this work program was supported by study work prepared in accordance with NI
43-101 requirements. In November 2010, a Scoping Study was completed by Samuel Engineering.
By the end of March 2011, a total of 143,568 m of drilling had been carried out when Ventana was taken over by AUX Canada.
| 6.2.2 | AUX |
AUX drilled a further 200,124 m over a strike length of 2.5 km, between 2011 and 2013.
During this exploration period, AUX Canada also acquired the adjacent Galway and Calvista exploration properties, inheriting cores of 104,714 m of drilling from those properties, which covered another 800 m of strike length to the SW.
Coffey Mining Pty Ltd (“Coffey Mining”) prepared an Independent Technical Report on the Project Mineral Resources (excluding Galway and Calvista) for AUX in January 2013 (Coffey, 2013). In July 2013, all exploration activities by AUX were terminated. From mid-2013 until the first quarter of 2015, the Project was under care and maintenance.
| 6.2.3 | Galway Resources |
The exploration activities carried out by Galway consisted of:
| ● | 445 hand and channel samples were taken in the areas of San Celestino, La Baja, San Juan, Machuca and Catalina between 2009 and 2012 |
| ● | 648 soil samples taken between 2008 and 2009 and analysed using Mobile Metal Ion (“MMI”) |
| ● | 261 diamond drillholes completed between December 2009 and January 2013 totalling 85,332 m. |
SRK Consulting (US) Inc completed a NI 43-101 technical report in October 2012 (SRK, 2012).
| Effective Date January 1, 2021 | Aris Gold | |||
| Page 51 of 384 |
| SRK Consulting | Soto Norte NI 43-101 – Feasibility Study |
| 6.2.4 | Calvista Gold Corporation |
The exploration activities carried out by Calvista Gold Corporation consisted of the following:
| ● | 216 km airborne geophysics magnetometry and radiometry survey flown in November 2010, by MPX Geophysics |
| ● | 61 channel samples taken in the northern sector of the Calvista license between September and October 2010 |
| ● | 351 soil samples taken in 2012 analysed using Enzyme Leach at Act laboratories |
| ● | 49 diamond drillholes completed between July 2010 and March 2012, totalling 20,043 m. |
A NI 43-101 technical report and Mineral Resource estimate was prepared in October 2012 (TechnoTectonics, 2012).
| 6.2.5 | Minesa |
The exploration activities carried out by Minesa, during 2016 and 2017, consisted of the following:
| ● | 80 soil samples (MMI) and 22 rock samples were taken in concession FCC-814 between September and October 2015 |
| ● | 134 channel samples were taken in historical tunnels with concessions 095-68 and 204-68 between January and April 2017 |
| ● | 77 diamond drillholes were completed between January and September 2016, totalling 35,940 m |
| ● | 18 geotechnical boreholes that provided geological and geotechnical information for the access tunnel were drilled between September 2016, and November 2019, totalling 4,816 m. An additional 6 holes were drilled in 2019 adding 1,755 m of borehole information to the database. |
No further exploration activities on concession 095-68 have been undertaken since 2017.
| 6.3 | Historical Mineral Resource Estimates |
Since 2006, seven (7) MRE have been carried out for the Project:
| ● | Samuel Engineering, 8 November 2010 (CIM) |
| ● | Coffey Mining, 31 July 2012 (CIM) |
| ● | Coffey Mining, 31 January 2013 (CIM) |
| ● | SRK, 18 February 2016 (JORC) |
| ● | SRK, 26 January 2017 (JORC) |
| ● | SRK, July 2017 (JORC). |
| ● | SRK, May 2019 (JORC) |
It must be noted that the information used in the different MRE changed with time due to the continuous increase in available data, principally derived from drilling, assay data and associated geological interpretation and cut-off grades applied. Block models varied in block size and the software and statistics used to construct the block models varied depending on geological knowledge and consultant experience.
| Effective Date January 1, 2021 | Aris Gold | |||
| Page 52 of 384 |
| SRK Consulting | Soto Norte NI 43-101 – Feasibility Study |
| 6.3.1 | Samuel Engineering, November 2010 |
Samuel Engineering produced an MRE for Ventana Gold Corporation as part of an NI 43-101 Technical Report (Samuel Engineering, 2010). The MRE used a cut-off grade of 2.0 g/t Au. Table 6.1 shows the Mineral Resource as stated in the NI 43-101 Technical Report.
Table 6.1: Samuel Engineering Mineral Resource Estimate – November 2010
|
Summary of Mineral Resource – La Bodega Property – Ventana Gold Corp
| ||||||||||||||
|
8 November 2010 – Cut-off Grade 2.0 g/t Au Applied
| ||||||||||||||
| Resource Category |
Tonnage (kt) |
Gold (g/t) |
Silver (g/t) |
Copper (%) |
Gold (koz) |
Silver (koz) |
Copper (klb) | |||||||
| Measured | - | - | - | - | - | - | - | |||||||
| Indicated | - | - | - | - | - | - | - | |||||||
| Inferred | 27,795 | 3.88 | 21.49 | 0.14 | 3,470 | 19,200 | 84,600 | |||||||
| 6.3.2 | Coffey Mining, July 2012 |
Coffey Mining produced an MRE for AUX as part of an Independent Technical Report on Mineral Resources (Coffey, 2012). The MRE produced by Coffey Mining used a cut-off grade of 2.0 g/t Au. Table 6.2 shows the Mineral Resource as stated in the Independent Technical Report on Mineral Resources.
Table 6.2: Coffey Mining Mineral Resource Estimate – July 2012
| Summary of Mineral Resource – El Gigante Project – Aux Colombia Ltda
| ||||||||||||||
|
31 July 2012 – Cut-off Grade 2.0 g/t Au Applied
| ||||||||||||||
|
Resource Category |
Tonnage (kt) |
Gold (g/t) |
Silver (g/t) |
Copper (%) |
Gold (koz) |
Silver (koz) |
Copper (klb) | |||||||
| Measured | - | - | - | - | - | - | - | |||||||
| Indicated | 19,612 | 6.96 | 34.56 | 0.196 | 4,390 | 21,789 | 84,411 | |||||||
| Inferred | 33,603 | 5.67 | 24.36 | 0.169 | 6,130 | 26,320 | 125,228 | |||||||
| 6.3.3 | Coffey Mining, January 2013 |
Coffey Mining produced an updated MRE for AUX in January 2013, using a cut-off grade of 1.5 g/t Au. Table 6.3 shows the Mineral Resource as stated in the Independent Technical Report on Mineral Resources (Coffey, 2013).
Table 6.3: Coffey Mining Mineral Resource Estimate – January 2013
| Summary of Mineral Resource – El Gigante Project – Aux Colombia Ltda.
| ||||||||||||||
|
31 January 2013 – Cut-off Grade 1.5 g/t Au Applied
| ||||||||||||||
|
Resource Category |
Tonnage (kt) |
Gold (g/t) |
Silver (g/t) |
Copper (%) |
Gold (koz) |
Silver (koz) |
Copper (klb) | |||||||
|
Measured |
14,593 | 6.76 | 37.96 | 0.20 | 3,172 | 17,811 | 62,722 | |||||||
|
Indicated |
28,507 | 5.68 | 31.28 | 0.17 | 5,207 | 28,668 | 105,388 | |||||||
|
Inferred |
27,526 | 5.03 | 22.14 | 0.14 | 4,447 | 19,595 | 85,280 | |||||||
| Effective Date January 1, 2021 | Aris Gold | |||
| Page 53 of 384 |
| SRK Consulting | Soto Norte NI 43-101 – Feasibility Study |
| 6.3.4 | SRK, February 2016 |
SRK produced an MRE for Minesa in February 2016, using a cut-off grade of 1.5 g/t Au and shown in Table 6.4 (SRK, 2016a).
The Measured Resource category reported by Coffey Mining was reduced to an Indicated category in the SRK estimate. It was the opinion of SRK that the Measured category was too spotty and inconsistent to be classified as Measured, considering the Joint Ore Reserves Committee of the Australasian Institute of Mining and Metallurgy, Australian Institute of Geoscientists and Minerals Council of Australia (“JORC”) Code guidelines.
Table 6.4: SRK Mineral Resource Estimate – February 2016
| Summary of Mineral Resource – Soto Norte Project – Sociedad Minera de Santander S.A.S.
| ||||||||||||||
|
3 February 2016 – Cut-off Grade 1.5 g/t Au Applied
| ||||||||||||||
| Resource Category | Tonnage (kt) |
Gold (g/t) |
Silver (g/t) |
Copper (%) |
Gold (koz) |
Silver (koz) |
Copper (klb) | |||||||
| Measured | - | - | - | - | - | - | - | |||||||
| Indicated | 36,831 | 6.0 | 29.0 | 0.19 | 7,052 | 34,339 | 151,617 | |||||||
| Inferred | 31,967 | 5.4 | 34.4 | 0.17 | 5,531 | 35,403 | 119,286 | |||||||
| 6.3.5 | SRK, January 2017 |
SRK produced an MRE for the 2017 PFS using an NSR cut-off of USD60/t, shown in Table 6.5.
The NSR was determined based on metal price assumptions, metallurgical recovery assumptions from initial test work, mining costs, processing costs, G&A costs, and other NSR factors. The final NSR calculation was based on average assumptions for the deposit and determined using:
NSR (USD/t) = 29.99 x (gold grade (g/t Au)) + 0.44 x (silver grade (g/t Ag))—1.490 x (copper grade (% Cu))
Metal price assumptions considered for the calculation of metal equivalent grades were USD1,300/oz of gold, USD18/oz of silver, and USD5,000/t of copper. Metallurgical recoveries used were gold (92%), silver (92%) and copper (76%).
Table 6.5: SRK Mineral Resource Estimate – January 2017
| Summary of Mineral Resource – Soto Norte Project – Sociedad Minera de Santander S.A.S.
| ||||||||||||||
|
26 January 2017 – Cut-off USD60/t
| ||||||||||||||
|
Resource Category |
Tonnage (kt) |
Gold (g/t) |
Silver (g/t) |
Copper (%) |
Gold (koz) |
Silver (koz) |
Copper (klb) | |||||||
|
Measured |
- | - | - | - | - | - | - | |||||||
|
Indicated |
39,434 | 6.2 | 40.0 | 0.21 | 7,891 | 51,308 | 185,196 | |||||||
|
Inferred |
25,506 | 5.3 | 27.0 | 0.20 | 4,370 | 22,336 | 110,960 | |||||||
| 6.3.6 | SRK, July 2017 |
SRK completed an updated MRE for Minesa in July 2017 for the Soto Norte Project, using an NSR cut-off of USD47/t (shown in Table 6.6). This update was completed as there were outstanding core logging and
| Effective Date January 1, 2021 | Aris Gold | |||
| Page 54 of 384 |
| SRK Consulting | Soto Norte NI 43-101 – Feasibility Study |
assay data at the time of the January 2017 MRE.
The NSR was determined based on metal price assumptions, metallurgical recovery assumptions from initial test work, mining costs, processing costs, G&A costs, and other NSR factors. The final NSR calculation was based on average assumptions for the deposit and determined using:
NSR (USD/t) = 33.96 x (gold grade g/t Au) + 0.424 x (silver grade g/t Ag) + 0.0031 x (copper grade % Cu)
Metal price assumptions considered for the calculation of metal equivalent grades were USD1,300/oz of gold, USD18/oz of silver, and USD5,000/t of copper. Metallurgical recoveries used were gold (92%), silver (92%) and copper (76%).
Table 6.6: SRK Mineral Resource Estimate – July 2017
|
Summary of Mineral Resource – Soto Norte Project – Sociedad Minera de Santander S.A.S.
| ||||||||||||||
|
30 July 2017 – Cut-off USD47/t
| ||||||||||||||
| Resource Category |
Tonnage (kt) |
Gold (g/t) |
Silver (g/t) |
Copper (%) |
Gold (koz) |
Silver (koz) |
Copper (klb) | |||||||
|
Measured |
986 | 10.43 | 47.91 | 0.42 | 330 | 1,518 | 9,117 | |||||||
|
Indicated |
42,323 | 5.81 | 42.52 | 0.20 | 7,910 | 57,853 | 184,880 | |||||||
|
Inferred |
33,308 | 4.78 | 29.81 | 0.18 | 5,115 | 31,923 | 135,538 | |||||||
| 6.4 | Historical Mineral Reserve Estimates |
There is one recent historical Mineral Reserve estimate completed on the Project which was reported in accordance with the JORC code guidelines and summarised in the following subsection.
| 6.4.1 | SRK, August 2017 |
The 2017 PFS used the MRE with effective date 26 January 2017 (Table 6.5) as a basis for the underground mine plan with paste backfill. The operating NSR cut-off applied was USD100/t which covers the estimated cost of mining, processing, general and administration and includes an operating profit margin. The marginal NSR cut-off of USD60/t was also applied to utilise the planned underground development to increase the economically mineable tonnage.
A separate Competent Persons Report was prepared which reported the statement of Ore Reserves in accordance with the JORC code guidelines effective 01 August 2017 (Table 6.7).
Table 6.7:SRK Mineral Reserve Estimate – 01 August 2017
|
Tonnes |
Au | Ag | Cu | Au | Ag | Cu | ||||||||
|
Classification
|
(kt) | (g/t) | (g/t) | (%) | (koz) | (koz) | (klb) | |||||||
|
Proved |
- | - | - | - | - | - | - | |||||||
|
Probable |
28,153 | 6.3 | 35 | 0.20 | 5,716 | 31,544 | 125,496 |
| 6.5 | Recent studies Completed on the Soto Norte Project |
The following provides a summary of the recent studies completed on the Project since 2015:
| Effective Date January 1, 2021 | Aris Gold | |||
| Page 55 of 384 |
| SRK Consulting | Soto Norte NI 43-101 – Feasibility Study |
| ● | Multidisciplinary Gap Analysis (completed March 2015) including a site visit by an SRK team (comprised the following disciplines: geology, mining, infrastructure, environment and social). |
| ● | Concept Development Study (completed May 2015) including: |
| ○ | Consideration of 7 alternative processing methods based on available testwork. |
| ○ | Production rate and cut-off grade analysis. |
| ○ | Assessment of site locations for underground access, process facilities and dry filtered tailings management facilities. |
| ○ | Run of Mine (“RoM”) transport mine to plant: assessment of rope conveyor vs underground conveyor. |
| ○ | Technical-Economic modelling of scenarios. |
| ● | Tenement Review (completed May 2015). |
| ● | Exploration Infill Drilling Programme (completed October 2015). |
| ● | Scoping Study (completed November 2015) including: |
| ○ | Mine Design and Scheduling using Deswik software with production and cut-off grade analysis. |
| ○ | Assessment of two processing methods (Pressure Oxidation and float/gravity concentration). |
| ○ | Assessment of additional site locations for process facilities including estimate of earthworks. |
| ○ | Materials handling assessment (rope conveyor vs underground conveyor). |
| ○ | Hydrology, hydrogeology, dewatering and water treatment review. |
| ○ | Tailings options assessment. |
| ○ | Update details for logistic options. |
| ○ | Technical-Economic modelling of scenarios. |
| ● | Pre-Feasibility Study (completed May 2017) prepared by SNC (2017). |
| 6.6 | Historic Production |
No formal mining has taken place on the veins that make up the Soto Norte Project, however, over the years small-scale operations (informal) have driven several adits and tunnels on various portions of the property exploiting high-grade veins and shoots generally by raising and sub-drifting short distances using haphazard methods. Although no records of this production are available, the tonnage removed is estimated at between 50,000 to 75,000 t. Most of this activity is restricted to mostly mining free gold within the oxidation and transitional zones of the veins and other mineralised structures at or near surface. Roughly 4,000 m of tunnels, drifts and raises are present on the Minesa properties with the most extensive workings developed in the La Bodega mine.
La Baja Valley is littered with small old artisanal processing plants and process waste which comprise an environmental hazard. The principal processes used are crushing with Californian stamps and recovery of gold by amalgamation with mercury or leaching with cyanide. Most of the process waste was dumped in the La Baja River.
| Effective Date January 1, 2021 | Aris Gold | |||
| Page 56 of 384 |
| SRK Consulting | Soto Norte NI 43-101 – Feasibility Study |
| 7 | GEOLOGICAL SETTING AND MINERALISATION |
| 7.1 | Regional Geological Setting |
Colombia is located at the northern end of the Andean orogenic belt where the geology is characterised by the interrelation of the Caribbean, Nazca, and South American tectonic plates (Figure 7.1). The interaction of these plates has created subduction in various directions together with the creation of uplifted blocks and associated magmatism due to subduction and compressional faulting together with the formation of intracontinental basins like the gulf of Maracaibo.
The Soto Norte Project is situated north of the point of division of the Eastern Andean Cordillera into its western and eastern branches (Figure 7.2). The western branch hosts the NNW-trending uplifted Santander Massif, bounded by the Bucaramanga Fault to the west and the Socota-Santander Fault to the east (Figure 7.3). The Project geology is related to magmatic events and contact metamorphism sited centrally between these two faults. This massif is approximately 50 km wide and the intervening uplifted block is cut by a series of NE-trending strike-slip faults (Figure 7.3).
These NE-trending faults are aligned with the trend of the Eastern branch of the Eastern Andean Cordillera, which continues N-Eastwards as the Sierra de Merida in Venezuela (Figure 7.2).
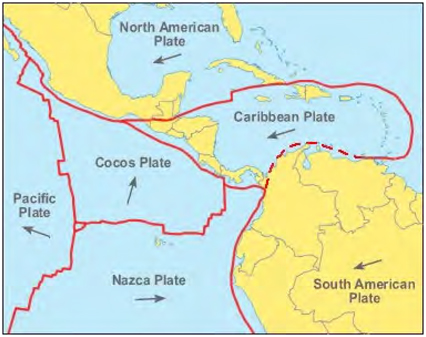
Figure 7.1: Plan of Tectonic Plates and Movement Directions (Source: Ball J., 2008)
| Effective Date January 1, 2021 | Aris Gold | |||
| Page 57 of 384 |
| SRK Consulting | Soto Norte NI 43-101 – Feasibility Study |
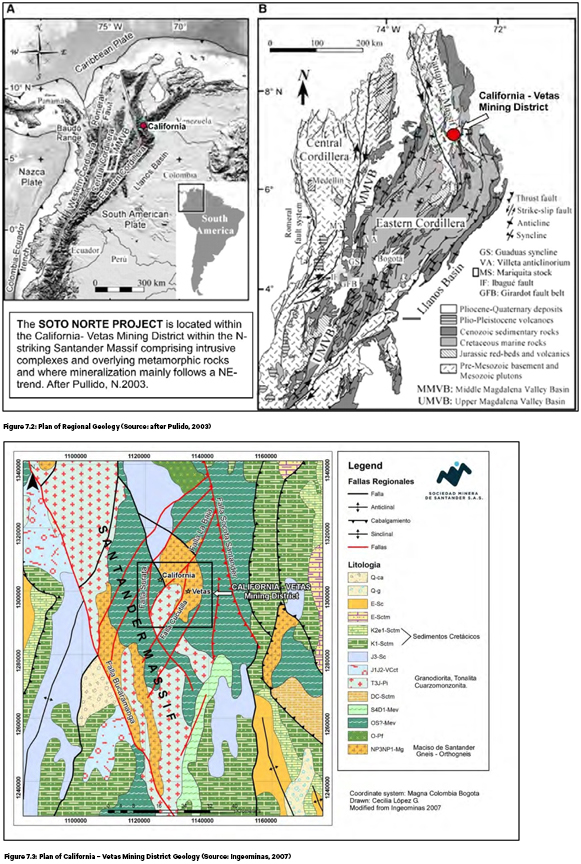
| 7.2 | Local Geological Setting |
The Santander Massif in the Soto Norte Project comprises three major geological units:
| Effective Date January 1, 2021 | Aris Gold | |||
| Page 58 of 384 |
| SRK Consulting | Soto Norte NI 43-101 – Feasibility Study |
(1) The Precambrian Bucaramanga Complex (Ward, 1973) comprising high-grade paragneisses, migmatites, amphibolites, quartzites, marbles, and granulites of early Proterozoic age (Royero, 2001) that were part of the Guyana shield.
(2) A central Santander Plutonic Group comprising late Triassic to early Jurassic intrusive rocks of calc-alkaline affinity that vary in composition from tonalities and granodiorites through to leucogranites.
(3) A thick sequence of Mesozoic and Cenozoic sedimentary rocks partly overlies (1) and (2) to the west. The Mesozoic rocks comprise bedded marine sediments of Jurassic and Cretaceous age, which have been tilted and deformed, and often show complex fold-faulting relationships.
District-scale faulting equates with topographic relief and the dominant NE trending faults, which can broadly be seen to be controlling the shape of the intrusive complex (Figure 7.4 and Figure 7.5). The principal faults comprise the La Baja, Mongora, and Cucutilla faults, which are interpreted to be part of a wider regional structural corridor, which acts as one of the controls over mineralisation throughout the California-Vetas mining district.
The most widespread rocks in the eastern part of the district are metamorphic rocks of the Bucaramanga Complex that form part of the Santander Massif. Granitoids of the Santander Plutonic Group crosscut the gneisses as irregular dike-like bodies. Cretaceous marine sedimentary units outcrop and lie unconformably over the Bucaramanga Complex to the west of the Project area. Miocene porphyritic dyke-like bodies cross-cut some areas of the district and hydrothermal breccias crosscut all the above summarised units while all geology is cut by the NE fault system (SRK, 2016b) and these are cut by continuing post-mineralisation fault activity.
Figure 7.6 shows a more detailed map of the geology of the intrusive complex and shows how the NE-striking Baja Fault cuts along the NW margin of the complex. The fault and sub-parallel branches broadly follow the La Baja River and its V-shaped valley. Intrusive rock on the north side of this fault, and gneiss on the south side of the fault, can be seen between San Celestino and La Bodega. This is where the principal mineralisation comprising Soto Norte is located.
| Effective Date January 1, 2021 | Aris Gold | |||
| Page 59 of 384 |
| SRK Consulting | Soto Norte NI 43-101 – Feasibility Study |
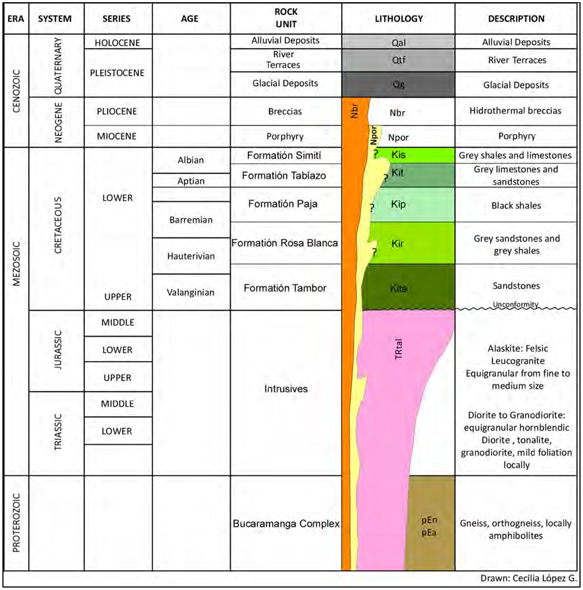
Figure 7.4: District Stratigraphic Column
| Effective Date January 1, 2021 | Aris Gold | |||
| Page 60 of 384 |
| SRK Consulting | Soto Norte NI 43-101 – Feasibility Study |
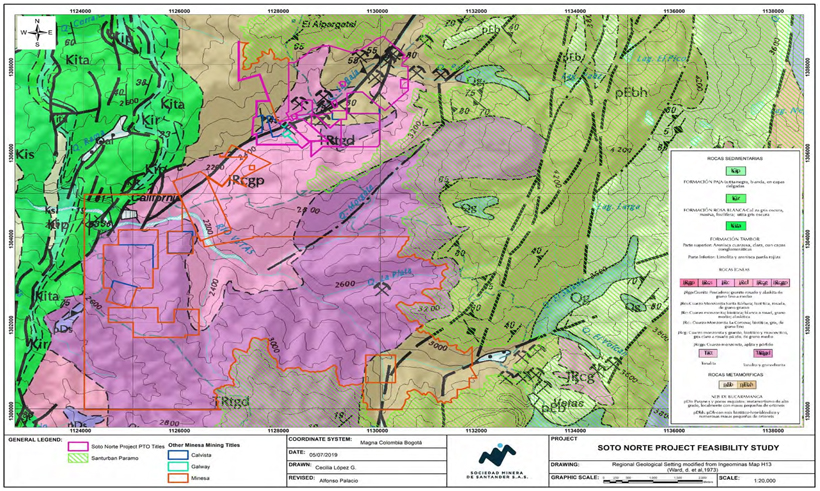
| Figure 7.5: | Plan of Local Geology Modified from the Ingeominas Map H13 (Ward, D. Et Al, 1973) and Mineral Deposit Research Unit,University of British Columbia (MDRU, 2012) and Minesa Project and Exploration Licenses |
| Effective Date January 1, 2021 | Aris Gold | |||
| Page 61 of 384 |
| SRK Consulting | Soto Norte NI 43-101 – Feasibility Study |
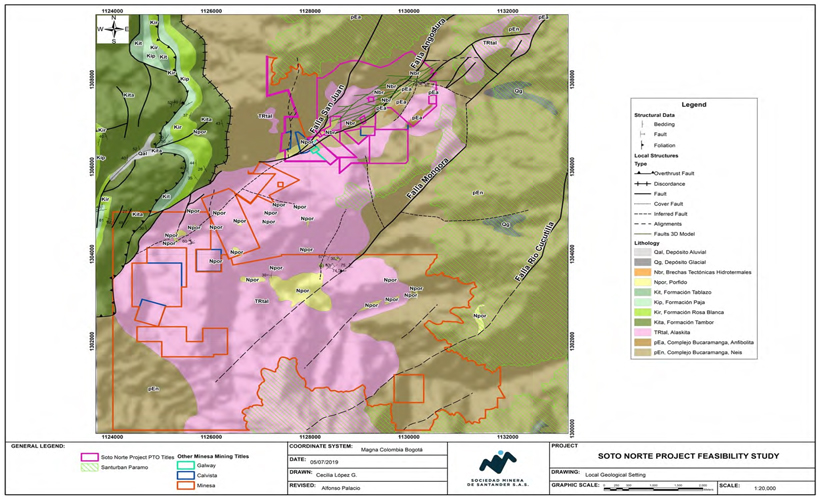
| Figure 7.6: | Plan of Local Geology and the Soto Norte Concessions (Source: MDRU, 2012) |
| Effective Date January 1, 2021 | Aris Gold | |||
| Page 62 of 384 |
| SRK Consulting | Soto Norte NI 43-101 – Feasibility Study |
| 7.3 | Property Geological Setting |
| 7.3.1 | Summary of the Property Geology |
The Project is located within two broad geological domains:
| ● | Sedimentary domain formed by Jurassic to Cretaceous sedimentary units consisting of shale, mudstone and sandstone with minor interbedded layers of limestone and chert |
| ● | Igneous-metamorphic domain formed by Pre-Cambrian gneiss and amphibolite, intruded by Triassic- Jurassic granites. |
The structural geology is typical of a transpressive setting shaped by the uplift of the Eastern Cordillera. The major structural features include:
| ● | N-S striking, W dipping thrust faults found in the sedimentary domain, these structures are locally related to the Suratá fault |
| ● | NE-SW striking, NW dipping strike-slip faults that cross-cut both geological domains, these structures are locally related to the La Baja and Mongora faults. |
The Soto Norte mineral deposit is classified as a high-sulphidation epithermal deposit, with gold, silver and copper occurrences mainly in sulphides. The deposit is related to the Miocene porphyry stocks and dikes that have been identified in the area, cross cutting the older sedimentary, igneous and metamorphic rocks.
The genesis of the deposit is characterised by hydrothermal fluids flowing through fault-related pathways, giving origin to the following hydrothermal alterations:
| ● | background propylitic and phyllic alterations generated during early stages of mineralisation, believed to be developed in a porphyry to epithermal transitional setting |
| ● | silicification and argillic alteration in the core of the main veins, zoned outwards to intermediate argillic and propylitic, believed to be formed during the principal stages of mineral deposition. |
| 7.3.2 | Bucaramanga Complex |
Gneisses of the Bucaramanga Complex are the most prevalent in the immediate Project area. At diamond-drill core scale, the gneisses are typically banded and are referred to as banded gneisses and are composed of quartz-feldspar bands (leucosomes) and amphibolite-biotite rich bands (mesosomes) also referred to as amphibolites. The banding and segregation of K-feldspar rich leucosomes are interpreted to be the result of partial melting during high-grade metamorphism (upper amphibolite facies) resulting in migmatisation and ptygmatic folding. Mesosomes are typically hornblende-rich with minor biotite and disseminated magnetite in some cases. On a local scale, banded gneisses are biotite-rich and may exhibit quartz and feldspar augens. The thickness of these bands may be as wide as a few meters, enough to be distinguished in geological sections.
| 7.3.3 | Santander Plutonic Group |
Plutonic units of the Santander Plutonic Group include tonalites and granodiorites to the south of the Project area at Páramo Rico, leucogranites, and quartz-monzonites, also referred to as alaskites in the central part of the intrusive complex. The igneous rocks from the late Triassic – early Jurassic are volumetrically the
| Effective Date January 1, 2021 | Aris Gold | |||
| Page 63 of 384 |
| SRK Consulting | Soto Norte NI 43-101 – Feasibility Study |
most important rocks in this mineralised district.
Leucogranites in the Project area intrude the Bucaramanga Complex, ranging in granite to monzogranite. Most of these rocks are equigranular and medium to fine grained and composed of white to translucent quartz (approximately 40%), white to dull greenish feldspars (approximately 55%), muscovite (up to 5%) and zircon (<0.1%). Muscovite within these rocks is considered of magmatic origin; therefore, these rocks are considered peraluminous.
Granitic pegmatites in the Project area occur as narrow lenticular or dyke-like bodies. These pegmatites are greenish to white, coarse-grained (crystals <2 cm) and are granitic in composition. These cut the gneiss unit and appear to be related to the granites. They are composed of white to translucent quartz (35%-50%), feldspars (40%-55%) and muscovite (1%-5%).
| 7.3.4 | Sedimentary Rocks |
Sedimentary rocks of Cretaceous age are found to the west of the main mine area and must be mined through from some distance to give access to the proposed mine.
These include the following formations of the Lower Cretaceous:
| ● | Tambor Formation (limonites, sandstone and conglomerate sandstones) |
| ● | Rosa Blanca Formation comprising fossiliferous limestones, grey sandstones and shales |
| ● | Paja Formation (black shales) |
| ● | Tablazo Formation comprising grey flaggy limestones and sandstones |
| ● | Simiti Formation comprising dark grey calcareous shales, and the Upper Cretaceous |
| ● | Luna Formation comprising black shales with thin cherts and limestone concretions carrying fossils. |
| 7.3.5 | Porphyries |
These rocks are observed in the SW of the Soto Norte Project and are grouped with the porphyritic intrusive mined at Pie de Gallo, which is related to the occurrence of Cu-Mo mineralisation within the California-Vetas Mining District. These porphyry rocks cross-cut older units of gneiss, granitic intrusive, and sedimentary rocks. Their composition varies between rhyolite, dacite, and andesite. Quartz and feldspar clasts are observed embedded in a fine-grained matrix.
The age of these porphyry rocks has been established in between 10.9 to 8.4 Ma and are believed to be evidence of the porphyry-epithermal type mineralisation in the area from Miocene and earlier ages.
| 7.3.6 | Structural Geology |
SRK completed a structural review of the Soto Norte property in 2016 (SRK, 2016b). The major faults, provisionally interpreted from field, radiometric, aeromagnetic and topographic data, define a system that is segmented on a range of scale. The fault segments are mostly distributed in a right-stepping arrangement and most appear to be linked by a breaching fault. The perpendicular distance between stepped segments, identifiable from the various datasets in the La Baja Valley, ranges between 40 m (Mascota structure) and 600 m (segmentation between La Rosa Fault Zone – Mascota, and La Baja Fault – El Gigante.
The La Baja Fault Zone is interpreted from aeromagnetic and radiometric data to be linked to the major
| Effective Date January 1, 2021 | Aris Gold | |||
| Page 64 of 384 |
| SRK Consulting | Soto Norte NI 43-101 – Feasibility Study |
Mongora – Cucutilla Fault running along the Mongora Valley. The faults hosting the El Gigante and La Mascota mineralization represent two linking structures between the principal fault traces as shown in Figure 7.7 (SRK, 2016b), where the fault system steps to the right over approximately 600 m. The faults associated with the La Mascota and El Gigante mineralisation are referred to as the La Rosa Fault Zone (“LRFZ”) and the La Baja Fault Zone (“LBFZ”).
The LBFZ generally dips steeply (75°) to the NW (325°), while the LRFZ varies in dip, ranging from sub vertically dipping (85°) to the NNW (330°) at shallow depths to 80° to the SSE (155°) at depth. The faults converge with depth and are indicated to join into a single structure, a basement fault zone, at elevations below 1,850 m (Figure 7.8). High gold grades follow the alignment of the “New” deposit, which is considered a feeder structure. Exploration drilling from surface has not reached the bottom end of the mineral deposit, therefore, there is high exploration potential to target these deep structures from the underground.
As well as being expected to join at depth, these two principal fault zones converge both to the SW and NE, defining a broad lens of faulted rock between them. The compressional setting of the Soto Norte Project has produced positive flower structures, which are related to Mascota and Gigante joining down to single faults evidenced in the existence of the New deposit. This zone is cut by numerous minor faults, which accommodate shape changes within this lens. SRK (2016b) classifies these faults into three groups based upon their displacement, length, orientation, and probable slip characteristics:
| ● | First Order Faults as represented by LRFZ and LBFZ. These preserve strong evidence of post-mineral strike-slip displacements and in drill cores are defined by fault intercepts of >2 m and indicate significant strain characteristics. |
| ● | Four Second Order Faults have been identified within the Project area (Figure 7.10). They are based on the interpretation of drilled fault intervals, together with the correlation of provisionally interpreted fault traces by Carman (2016). These comprise steeply N-dipping faults striking 070° and 095° that connect to one or both First Order Faults. |
| ● | Third Order Faults were identified during the mapping of road sections, where several relatively minor faults were mapped at a relatively high angle to the overall trend. Where observed, these range in strike from NW to NNE and are steeply dipping. Examples of these host mineralisation and are partly exploited by artisanal miners. Additionally, similar structures in tunnels in the Mascota area have been mapped. The detailed geometry of these relatively minor faults is not well exposed or sufficiently distinctive in the drillhole database. There are, however, some indications in the assay data that at least some of these structures host resource-grade mineralisation (Figure 7.10). |
SRK (2016b) concludes “given the occurrence of quartz veins and tectonic-hydrothermal breccias in faults and fault-related structures in the La Baja fault system, it is beyond doubt that the mineralisation took place during active faulting along the structure.”
There is widespread evidence of post-mineralisation faulting throughout the La Baja Valley. Semi-cohesive fault breccia containing fragments of mineralised veins in broad faults, measuring up to 7 m in width, are observed along the main La Rosa (Mascota) and La Baja (El Gigante) structures. It is not clear what individual small-scale displacements (if any) may exist. Only when underground development commences will it be possible to determine how these might affect the resource.
| Effective Date January 1, 2021 | Aris Gold | |||
| Page 65 of 384 |
| SRK Consulting | Soto Norte NI 43-101 – Feasibility Study |
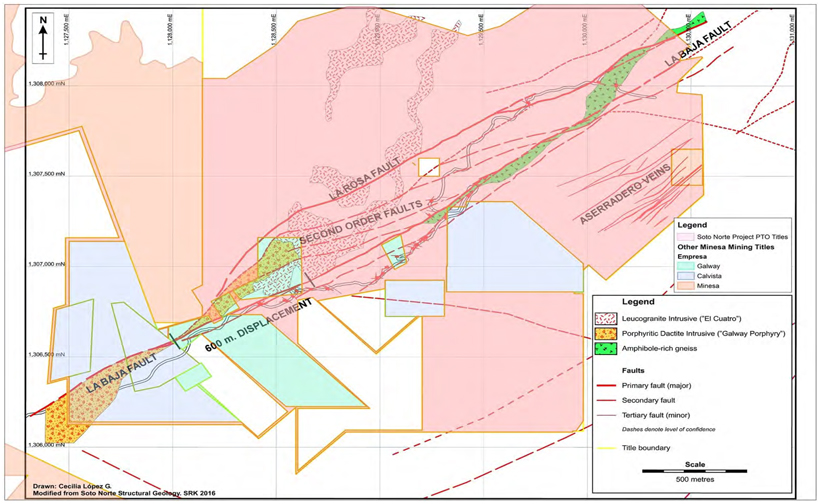
Figure 7.7: Plan of Faults and Lithologies in the Soto Norte Project Area
| Effective Date January 1, 2021 | Aris Gold | |||
| Page 66 of 384 |
| SRK Consulting | Soto Norte NI 43-101 – Feasibility Study |
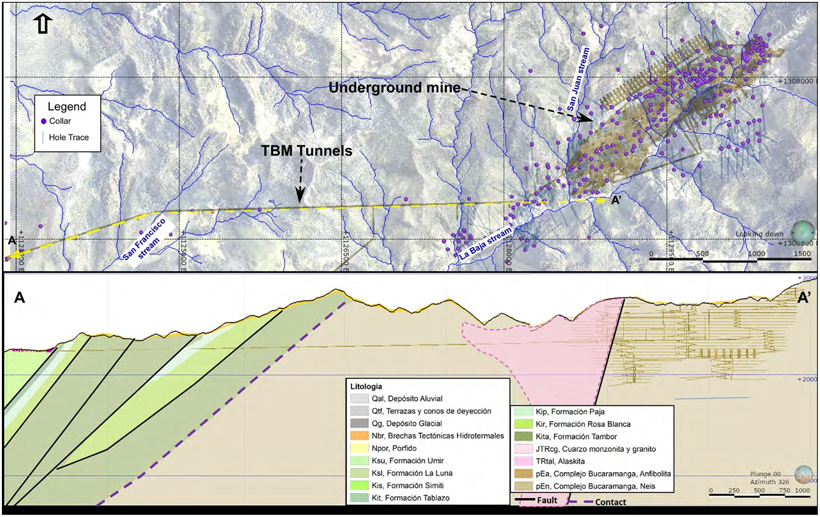
Figure 7.8: Plan and Cross-Section of the Geology Along the Main Access Tunnel and the Soto Norte Mining Area
| Effective Date January 1, 2021 | Aris Gold | |||
| Page 67 of 384 |
| SRK Consulting | Soto Norte NI 43-101 – Feasibility Study |
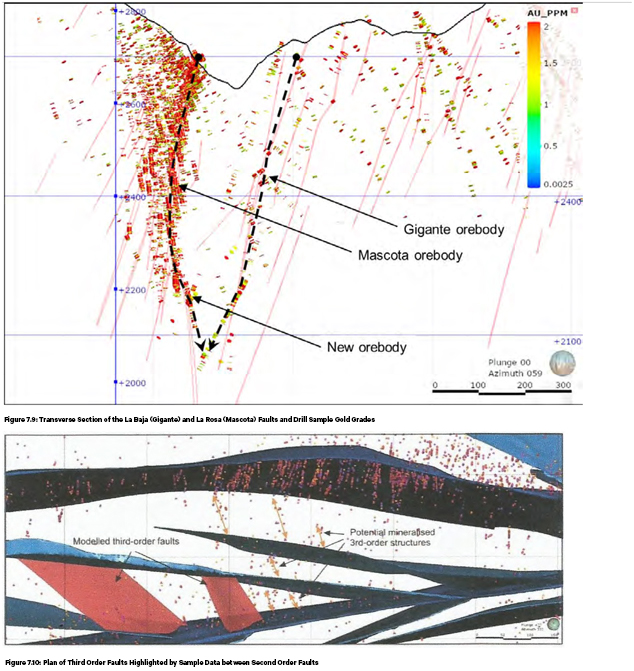
| 7.3.7 | Alteration |
Alteration is strongly related to the presence of faults that host and/or cut the mineralisation. Away from the fault zones, the basement gneissic lithologies and intrusive rocks are relatively fresh and unaltered, sometimes showing signs of weak propylitic alteration. Nearer to the fault zones, propylitic alteration is more common, but gives way to phyllic alteration dominated by sericite. At distances of 5 to 15 m from the core of the fault zone, phyllic alteration is replaced by argillic alteration and intensifies particularly on the hanging-wall side of much of the Mascota veins.
Where the veining is strongly developed, particularly where there are a few 1 to 5 m wide veins encapsulated within one wider structure, the wall rock between veins (and often in the footwall and
| Effective Date January 1, 2021 | Aris Gold | |||
| Page 68 of 384 |
| SRK Consulting | Soto Norte NI 43-101 – Feasibility Study |
hangingwall) is dominated by a pervasive silica alteration. Small cavities in this, and the quartz veining, contain white alunite, an indication of advanced argillic alteration.
In the case of the First Order Faults, wall rock alteration can be quite extensive, and the fault will often be filled with rock-flour, which, with permeation, produces a soft clayey gouge
Clay minerals that may influence process recovery are minor kaolinite (deposit average 1-2%), which is present in late stage fill of open spaces and illite (deposit average 4-6%), which is the predominant clay mineral seen within the La Baja Fault-controlled El Gigante vein. Metallurgical test work using high clay content samples (well above deposit average) returned positive recoveries indicating that clay minerals do not influence metallurgical recoveries.
| 7.3.8 | Mineralisation |
Mineralisation within the Soto Norte Project comprises parallel anastomosing veins which occupy the composite fault system. These veins have various widths and characteristics depending upon the open spaces provided by the fault movements, which occurred over time, as evidenced by multiple mineralised events recorded within the individual vein structures and host rocks.
| ● | Veins at Mascota exhibit open-space filling textures along the Mascota related structures, indicating low overburden stress consistent with a shallow crustal emplacement typical of epithermal vein systems. |
| ● | Brecciation is apparently of a hydrothermal origin (angular fragments, commonly monolithic, locally with jigsaw textures and, typically fragment-supported, dominantly cemented by hydrothermal minerals) and is observed in most mineralised zones, with the common feature that the brecciated fragments consist of local wall rock. |
| ● | The mineralisation has a variety of textures of cement fill that are characteristic of an epithermal environment, with colloform bands of quartz and colloform pyrite that indicate super saturation in a relatively low temperature environment. |
Veining in the El Gigante structure is mostly characterised by more compact, less vuggy and often banded textures. It is also characterised by more heavily altered wallrock and clay content consistent with the veining following the La Baja Fault and where post-mineralisation fault movement has probably taken place.
Overall, the veins cover a strike extent of 2.6 km and have been drilled to a depth of approximately 800 m below the surface. The width of the veins is variable dependent on the major and minor structures, but also pinch and swell within individual structures. On average the ranges are between 1 – 30 m width. A summary of the key dimensions of the known mineralisation for Soto Norte are shown in Figure 7.11. The mineralised structures extend to the surface and are open at depth and along strike, with high exploration potential to target the deep structures from underground drilling stations.
| Effective Date January 1, 2021 | Aris Gold | |||
| Page 69 of 384 |
| SRK Consulting | Soto Norte NI 43-101 – Feasibility Study |
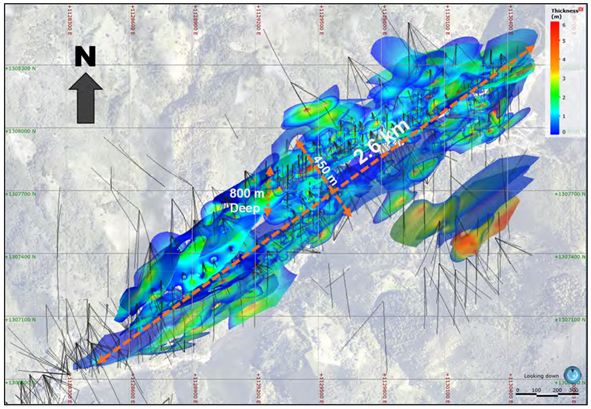
Figure 7.11: Plan of Soto Norte Known Mineralisation Dimensions
| 7.3.9 | Mineralisation Age and Paragenesis |
Dating information shows that mineralisation is very recent, in the range of 1.39 to 3.26 Ma and following the most recent intrusive event when the Pie de Gallo and other quartz-porphyry stocks in the district were emplaced (9.0 to 10.14 Ma).
Rodriguez (2014) studied the paragenesis of minerals in relation to host rock alteration and the introduction of veining comprising the multiple and successive emplacement of gangue and metallic minerals, which resulted in a paragenetic sequence (Figure 7.12).
| Effective Date January 1, 2021 | Aris Gold | |||
| Page 70 of 384 |
| SRK Consulting | Soto Norte NI 43-101 – Feasibility Study |
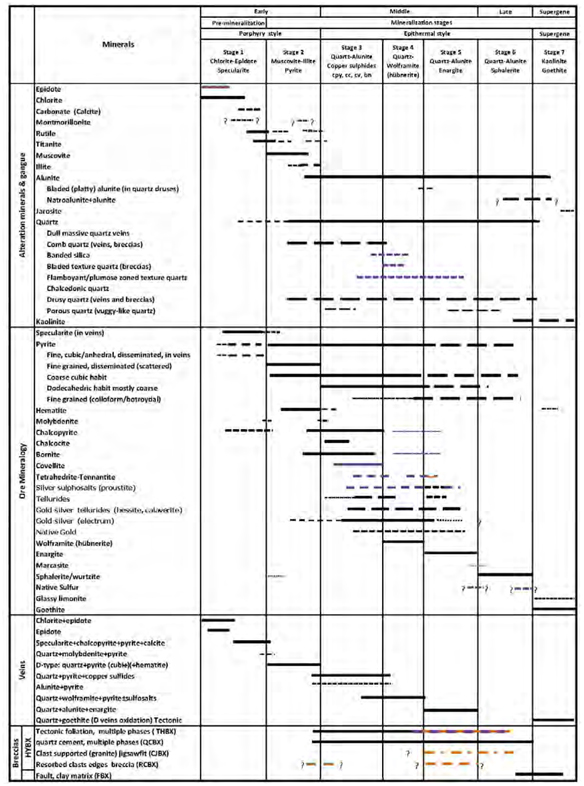
Figure 7.12: Paragenetic Sequence Determined by Rodriguez (2014)
| 7.3.10 | Mineralogy |
Gold and occasional electrum are observed in core and under the microscope as having a strong relationship with fine, crystalline pyrite (not the coarser crystalline pyrite) and occurs either free with the gold, adhering to pyrite particles or encapsulated within the pyrite crystalline lattice. Copper sulphides appear to have a partial affinity for pyrite but have much less of an association with gold than the pyrite
| Effective Date January 1, 2021 | Aris Gold | |||
| Page 71 of 384 |
| SRK Consulting | Soto Norte NI 43-101 – Feasibility Study |
because of its more irregular distribution. Gold also occasionally occurs within telluride minerals like calaverite and petzite, which are rarely visibly identifiable, although their possible presence is reflected in the sporadic distribution of tellurium assays. There is also a perceived relationship with quartz. Several mineralising events which introduce quartz, each time the quartz is introduced, become darker in colour (grading from white to dark grey). The fine crystalline pyrite has an association with this, either encapsulated within the darker quartz or emplaced within the darker quartz.
Silver occurs occasionally as native silver in the shallower SW end of the explored mineralisation in the El Cuatro zone and, more frequently, as silver sulphosalts, pyrargyrite and proustite.
Copper occurs principally as enargite and to a lesser extent as bornite, chalcopyrite, primary chalcocite and tetrahedrite-tennantite. Chalcopyrite is seen as being enriched on a local scale to bornite, covellite, secondary chalcocite and finally to native copper.
Arsenic (a penalty element) is principally associated with enargite. It is rarely seen as arsenopyrite but may be attributable to the presence of tennantite.
Zinc (a potential penalty element) occurs as red to black sphalerite or wurtzite and occurs associated with the distribution of lead, principally occurring as hinsdalite and occasionally as bournonite and possibly boulangerite.
Antimony (a potential penalty element) occurs occasionally as jamesonite and tetrahedrite and on a very small scale in bournonite and boulangerite.
Bismuth (a potential penalty element) occurs as a trace element within the deposits and may be related to bismuthinite or tellurobismuthite.
Tungsten occurs mainly as hubnerite and occasionally as ferberite. Hubnerite occurs as very fine, bright red transparent needles in quartz, is seen throughout the Mascota vein and is one of the indicators that mineralisation continues to the SW towards California.
The near surface to surface oxidation zone, which has an irregular depth and penetrates much deeper around major fractures and faults, is dominated by the reduction of sulphide minerals (being mainly pyrite) to haematite and goethite and limonite. Copper sulphides in the transition zone in old workings are seen commonly reduced to chalcanthite.
| Effective Date January 1, 2021 | Aris Gold | |||
| Page 72 of 384 |
| SRK Consulting | Soto Norte NI 43-101 – Feasibility Study |
| 8 | DEPOSIT TYPES |
The Soto Norte mineral deposit is classified as a high-sulphidation epithermal deposit, with gold, silver and copper occurrences, mainly in sulphides. The deposit is related to the Miocene porphyry stocks and dikes that have been identified in the area, cross cutting the older sedimentary, igneous and metamorphic rocks.
Epithermal gold deposits are a type of lode deposit that contains mineralised material with gold and silver occurrences, and in the case of Soto Norte, low grade base metal values of copper, lead, zinc and bismuth.
Several models have been proposed for characterising porphyry Cu systems that are associated with high-sulphidation epithermal deposits. The first model that determined alteration mineral association envelopes (alteration zonation) and veining relationships was provided by Lowell (1970). Since then, economic geologists have been refining this model, integrating other features of hydrothermal systems.
Temperature and fluid pH are the most important of many factors that influence the mineralogy of hydrothermal systems, followed by host rock and absolute fluid composition. Sillitoe (2010) states: “the alteration and mineralisation in porphyry Cu systems, occupying many cubic kilometres of rock, are zoned outward and upward from the stocks or dike swarms; from barren, early sodiccalcic through potentially ore-grade potassic, chlorite-sericite, and sericitic, to advanced argillic, the last of these constituting the lithocaps, which may attain >1 km in thickness if unaffected by significant erosion”.
Higher sulphidation-state sulphides are generated progressively upward in concert with temperature decline and the concomitant greater degrees of hydrolytic alteration, culminating in pyrite ± enargite ± covellite in the shallow parts of the lithocaps. Relevant characteristics of alteration envelopes and veins relationships within porphyry systems are compiled in
Table 8.1(Sillitoe, 2010).
The genesis of the deposit is characterised by hydrothermal fluids flowing through fault-related pathways, giving origin to the following hydrothermal alterations from Sillitoe, 2010 (Figure 8.1):
| ● | Background propylitic and phyllic alterations generated during early stages of mineralisation, believed to be developed in a porphyry to epithermal transitional setting |
| ● | Silicification and argillic alteration in the core of the main veins, zoned outwards to intermediate argillic and propylitic, believed to be formed during the principal stages of mineral deposition. |
Mineralisation is hosted in Precambrian gneisses of the Bucaramanga Complex and Triassic-Jurassic leucogranites and occurs largely within tabular tectonic-hydrothermal breccia bodies. These hosts are emplaced in dilatant structural settings along the La Baja trend right lateral strike-slip fault zone.
| Effective Date January 1, 2021 | Aris Gold | |||
| Page 73 of 384 |
| SRK Consulting | Soto Norte NI 43-101 – Feasibility Study |
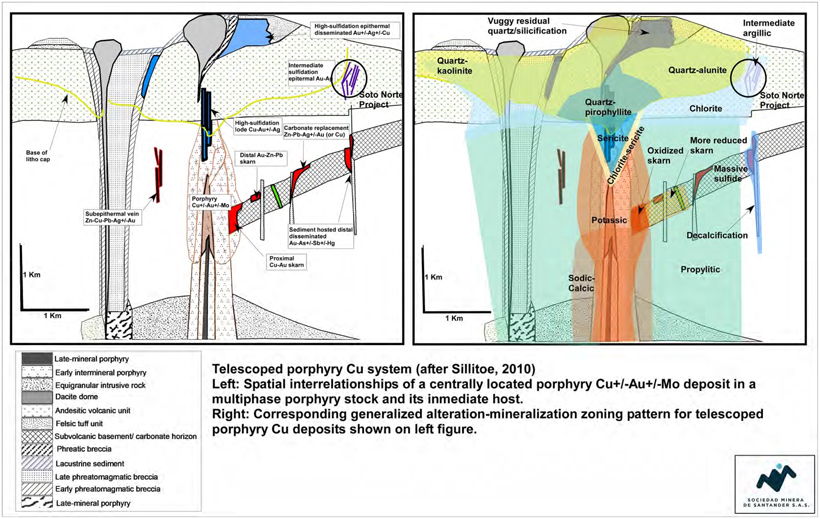
Figure 8.1: Soto Norte Mineralisation Spatial Location According to a Porphyry Copper System
| Effective Date January 1, 2021 | Aris Gold | |||
| Page 74 of 384 |
| SRK Consulting | Soto Norte NI 43-101 – Feasibility Study |
| Table | 8.1: Soto Norte Alteration Type according to Porphyry Copper Systems |
| Alteration type2 (altemative name)
|
Position in system (abundance) |
Key minerals
|
Possible ancillay minerals |
Principal sulfide assemblages (minor) |
Contemporaneous veinlets3 (designation) |
Veinlet selvages |
Economic potential | |||||||
| Sodio-calcic | Deep. Including below porphyry Cu deposits (uncommon)
|
Albite/oligociave. actinolite, magnetite |
Diopside, epidote, garnet | Typically absent | Magnetite ± acdnolite (M-type) | Albite/oligodase | Normallv barren, but locally ore bearing | |||||||
| Potassic (K-silicate) | Core zones of porphyry Cu deposits (ubiquitous} | Biotite. K-feldspar | Acdnolite. epidote, seriate, andalusite, albite. carbonate, tourmaline, magnetite | Pyrite chalcopyrite, chalcopyrite = bonite. bomite = digenite = chalcodte | Biotite (EB-type). K-feldspar, quartz-biotite-seridte- K-fcldspar-andalusite- sulfides ; EDM/“T4-type). quartz-sulfides x magnetite A-tvpe), quartz-molybdenite » pyrite ± chalcopyrite (central suture: B-type) |
DM-type with idte = bioyite = feldspar x andalusite = disseminated chalcopyrite bornite; others none, except locally K-feldspar around A- and B-types
|
Main ore contributor | |||||||
| Propylitic | Marginal parts of systems, below lithocaps (ubiquitous)
|
Chlorite, epidote. albite. carbonate | Actinolite, hematite, magnetite | Pyrite (= sphalerite, galena) | Pyrite, epidote | Barren, except for subepither-mal veins | ||||||||
| Chlorite-sericite (sericiteclay-chlorite (SCC) |
Upper parts of porphyry Cu core zones (common, particularly IN Au-rich deposits)
|
Chlorite. sericite/fllite, hematite (martite, specularite) |
Carbonate, ep:dote, smectite | Pyrite-chalcopyrite | Chlorite = seriate = sulfides | Chlorite, sericite/ulito | Common ore contributor | |||||||
| Sericitic(phyllic) | Upper parts of porphyry Cu deposits (ubiquitous, except with alkaline intrusions) | Quartz, seriate | Pyrophyilite, carbonate, tourmaline, specularite | Pyrite ± chalcopyrite (pyrite=enargite = tennantite, pyrite-bomite = chalcocite, pyritc-sphaterite!
|
Quartz-pyrite a other sulfides (D-type) | Quartz-seriate | Commonly barien, but may constitute ore | |||||||
| Advanced argillic (secondary quartzite In Russian terminology) | Above porphyry Cu deposits, constitutes lithocaps (common) |
Quartz (party residual, VUggy), alunite.* pyrophyllite. dickite, kaolinite
|
Diaspore, andalusite. zunyite, corundum, dumortiehte. topaz. specJarite | Pyrite-enargite. pyrite-chalcodte, pyrite-covellite |
Pyrite-enargite t Cu sulfides (includes veins) |
Quanz-alunite. quartz-pjTophyllite dickite quartz-kaolinite | Locally constitutes ore in Lithocaps and their roots |
1 Excluding those developed in carbonate-rich rocks
1 Arranged from probable oldest (top) to youngest (bottom), except for propylitic that is lateral equivalent of potassic; advanced argillic also forms above potassic early in systems (Fig. 10)
3 Many veinlets in potassic. dilorite-seridte. and sericitic alteration contain anhydrite, which also occurs as late, largely monomineralic veinlets
4 Alunite commonly intergrown with aluminum-phosphate-sulfate (APS) minerals (see Stoffregen and Alpers, 1987)
| Effective Date January 1, 2021 | Aris Gold | |||
| Page 75 of 384 |
| SRK Consulting | Soto Norte NI 43-101 – Feasibility Study |
| 9 | EXPLORATION |
| 9.1 | Historical Exploration |
Limited historical exploration prior to 2006 has been completed at the project which has been captured into the database. Historically small-scale underground mining had been completed which indicated the presence of veins. Modern exploration has been carried out on the Soto Norte project since 2006. A summary of the exploration timeline is described below:
| 9.1.1 | 2006 – 2011 Ventana |
| ● | In early 2006, Ventana began surface and underground geochemical sampling. This was accompanied by ground magnetic and IP geophysics and followed by a separate ground magnetic and pole-dipole IP resistivity survey, with diamond-drilling from surface started in August 2006. |
| ● | Progress and funding of this work program was supported by study work in 2006 and 2008 and, in November 2010, a Scoping Study by Samuel Engineering. |
| ● | By the end of March 2011, a total of 143,568 m of drilling had been carried out when Ventana was acquired by EBX via their subsidiary AUX Canada. |
| 9.1.2 | 2011 – 2013 AUX Colombia |
| ● | AUX Canada drilled a further 200,124 m over a strike-length of 2.5 km. |
| ● | During this exploration period, AUX Canada also acquired the adjacent Galway and Calvista exploration properties, inheriting cores of 104,714 m of drilling from those properties, which covered another 800 m of strike length to the SW. |
| ● | An Independent Technical Report on the Project’s Mineral Resources (excluding Galway and Calvista) was prepared by Coffey Mining in January 2013. In July 2013, all exploration activities by AUX were terminated. From mid-2013 until the first quarter of 2015, the Project was under care and maintenance. |
| 9.1.3 | 2015 – 2017 Minesa |
| ● | 80 soil samples (MMI) and 22 rock samples were taken in concession FCC-814 between September and October 2015. |
| ● | 134 channel samples were taken in historical tunnels with concessions 095-68, PTO or ‘works and construction program’ application, and 204-68 between January and April 2017. |
| ● | 77 diamond drillholes were completed between January and September 2016, totalling 35,939.6 m. |
| ● | 12 geotechnical boreholes that provided geological and geotechnical information for the access tunnel were drilled between September 2016 and May 2017 totalling 3,061.2 m. |
At the commencement of exploration by Minesa, survey control was brought into the area through gyro survey from the National Grid established by the Instituto Geográfico Agustín Codazzi (“IGAC”) using the certified reference point GPS-S-T-136. Three triangulation stations were established in the general Project area, and these are used for topographic control of all exploration activities.
The triangulation stations and the base point were located under the global system World Geodesic System 84 (“WGS- 84”) and later transformed to the local reference coordinate system Magna Sirgas origin Bogotá.
| Effective Date January 1, 2021 | Aris Gold | |||
| Page 76 of 384 |
| SRK Consulting | Soto Norte NI 43-101 – Feasibility Study |
| 9.1.4 | LIDAR and Orthophoto Surveys |
In October 2012, AUX contracted the Brazilian company, Servicios Aéreos Industriais (“SAI”), to carry out a LIDAR survey. This survey produced 40 profiled laser strips which were subsequently processed into a Digital Terrain Model (“DTM”) to obtain 1 m contour lines.
The survey also produced a mosaic of 117 high quality aerial photos covering the whole of the California-La Baja valley and adjacent topographic relief.
The orthophotos produced in the survey were used along with the LIDAR DTM to identify rivers, streams, water sheds and other geographical features.
The LIDAR survey covers the entire Project area (Figure 9.1) and all infrastructure and roads considered within the FS. The orthophotos (Figure 9.2) covered most of the Project area but did not cover the area allocated for the Suratá bypass.
In October 2016, Minesa contracted Geoconsult Group Ltd to carry out an aerial survey to document illegal mining activities along the La Baja River and to revise the location of rivers, streams, water sheds and other geographical features not covered by the 2012 orthophotos. The 2016 aerial survey and associated orthophotos covered the area outlined in green in Figure 9.2.
The topographic data used for the FS is based on the 2012 LIDAR survey with local adjustments for geographic features incorporated using the orthophotos and conventional ground surveys. The LIDAR survey covers all parts of the Project that require construction, infrastructure, or studies. The area covered by the LIDAR study and orthophotos can be seen in Figure 9.1 and Figure 9.2, respectively.
| 9.1.5 | Topographic Field Surveys |
The Minesa survey department carries out land, river and tunnel surveys as required by the Project. The survey equipment is sent for regular certification and calibrations with the hardware consisting of the following:
| ● | Topcon Gr5 of high precision (with double frequency L1 - L2 and supported in the constellations GPS and GLONNAS): |
| ○ | GPS Plomark 800 – Espectra |
| ○ | Spectra Precision GPS Plomark 800. |
| ● | Topcon total stations, OS 105 series (accuracy at 5 seconds, executes transfers with calculated polygons, which guarantees a high precision at 1:25000 scale): |
| ○ | Topcon Total station IS 103 |
| ○ | Topcon laser scanner GSL 2000M |
| ○ | Matrice 200 drone with four cameras. |
The field surveys are incorporated into the master survey drawings on a regular basis. The most common survey work for the exploration and pre-development phase of the Project includes the following:
| ● | Survey pickup of old mine workings in the Project area (underground and surface) |
| ● | Survey pickup of channel samples (underground and surface) |
| Effective Date January 1, 2021 | Aris Gold | |||
| Page 77 of 384 |
| SRK Consulting | Soto Norte NI 43-101 – Feasibility Study |
| ● | Survey pickup of drillhole collar positions, test pit locations and locating points for geophysics lines (seismic, IP, etc.) for exploration and geotechnical investigation |
| ● | Topographic survey of the existent project infrastructure including, Padilla camp, core sheds and El Emboque exploration tunnel |
| ● | Survey and quality control of landscape recovery work which can include road access and drill platform recovery |
| ● | Field and engineering support for social investment projects promoted by Minesa. |
The survey equipment possessed by Minesa is considered adequate for survey control during the construction and early operational stages of the Project, with only minor acquisitions required.
| Effective Date January 1, 2021 | Aris Gold | |||
| Page 78 of 384 |
| SRK Consulting | Soto Norte NI 43-101 – Feasibility Study |
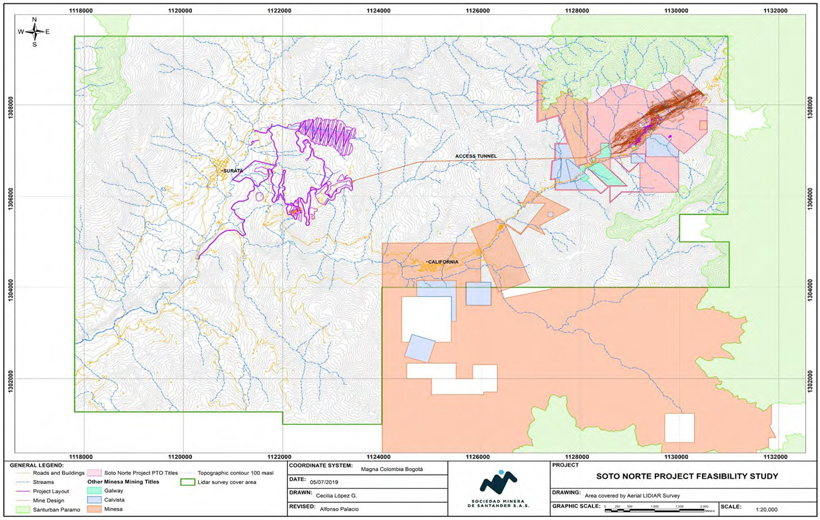
| Figure | 9.1: Plan of Area Covered by Aerial LIDAR Survey |
| Effective Date January 1, 2021 | Aris Gold | |||
| Page 79 of 384 |
| SRK Consulting | Soto Norte NI 43-101 – Feasibility Study |
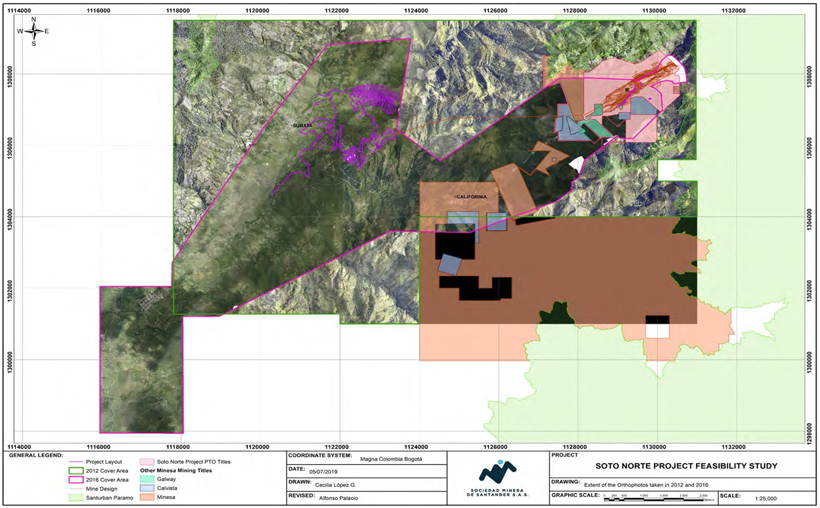
Figure 9.2: Plan of Area Covered by Orthophotos
| Effective Date January 1, 2021 | Aris Gold | |||
| Page 80 of 384 |
| SRK Consulting | Soto Norte NI 43-101 – Feasibility Study |
| 9.2 | Geochemical Sampling |
2006 exploration activities carried out by Ventana began with reconnaissance and the taking of geochemical samples across the Project area. More geochemical data were added during AUX´s tenure and further geochemical data was acquired with the EBX acquisition of the adjacent Galway and Calvista projects. Minesa has added further data through soil and rock sampling campaigns carried out during 2015 and 2017.
The locations of all samples taken for regional exploration are shown on Figure 9.3. The specific soil sampling in the PTO titles is presented in Figure 9.4. The combined results of these various phases of geochemical sampling are brought together in Figure 9.5 at a regional exploration scale. The plotting of the geochemical data sets in the Soto Norte Project area, confirms the NE-SW trend of Au-mineralisation subparallel to La Baja Stream and higher-grade zones on the NE limits towards the La Bodega area. Figure 9.6 shows the location of rock chip samples taken in the Project as part of the geochemical test work.
| Effective Date January 1, 2021 | Aris Gold | |||
| Page 81 of 384 |
| SRK Consulting | Soto Norte NI 43-101 – Feasibility Study |
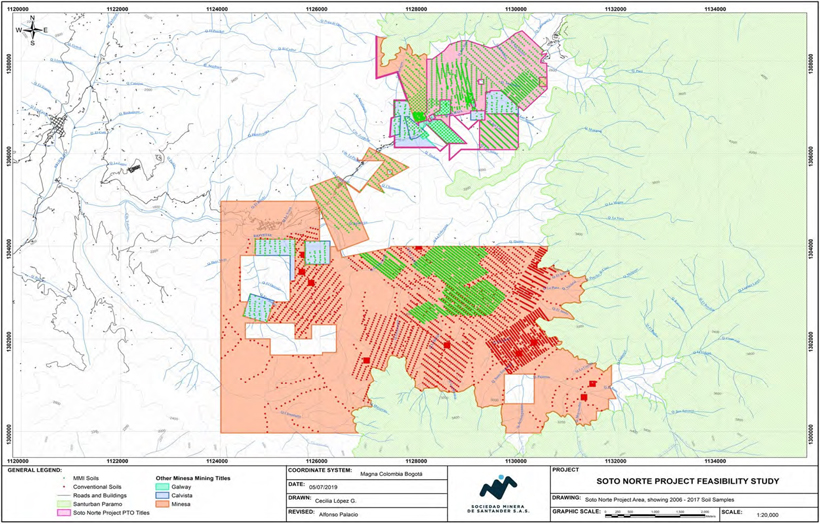
Figure 9.3: Plan of 2006 – 2017 Regional Soil Sample Locations
| Effective Date January 1, 2021 | Aris Gold | |||
| Page 82 of 384 |
| SRK Consulting | Soto Norte NI 43-101 – Feasibility Study |
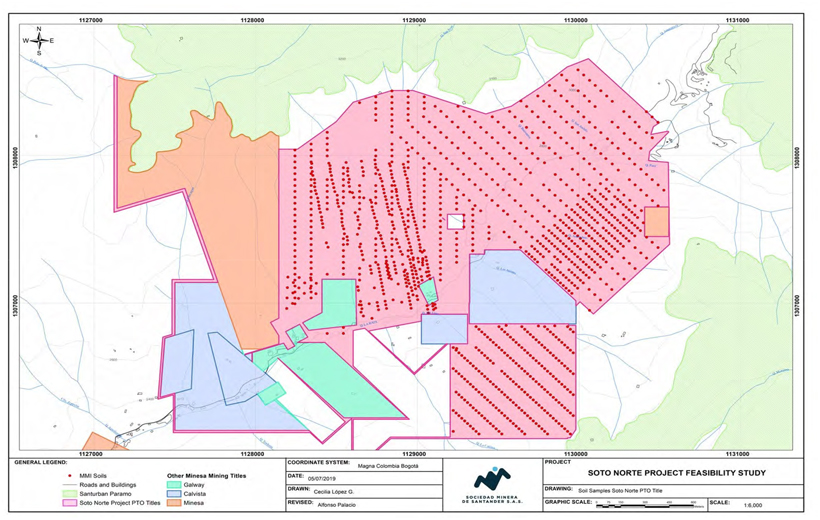
Figure 9.4: Plan of 2006 – 2017 Soto Norte Soil Sample Locations
| Effective Date January 1, 2021 | Aris Gold | |||
| Page 83 of 384 |
| SRK Consulting | Soto Norte NI 43-101 – Feasibility Study |
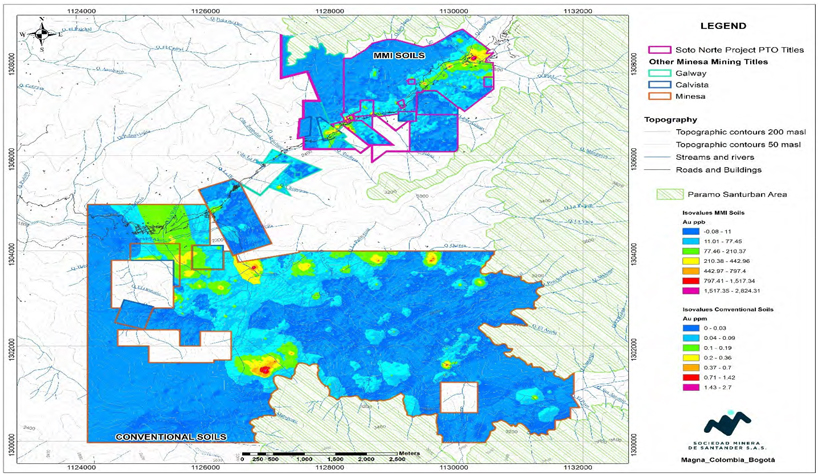
Figure 9.5: Plan of Regional Geochemical Soil Sample Gold Anomalies
| Effective Date January 1, 2021 | Aris Gold | |||
| Page 84 of 384 |
| SRK Consulting | Soto Norte NI 43-101 – Feasibility Study |
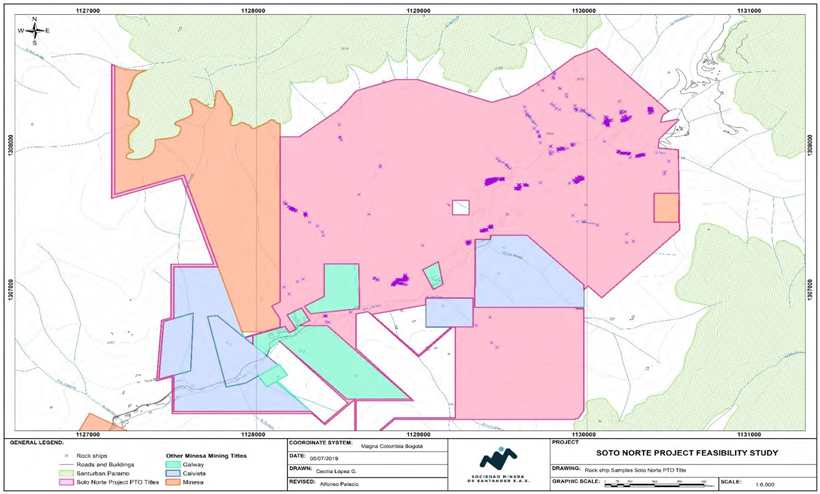
Figure 9.6: Plan of Soto Norte Rock Chip Sample Locations
| Effective Date January 1, 2021 | Aris Gold | |||
| Page 85 of 384 |
| SRK Consulting | Soto Norte NI 43-101 – Feasibility Study |
| 9.3 | Mapping, Surveying and Sampling of Old Mine Workings |
Historical data exist for mapping, surveying and sampling of tunnels since 1947 (Anaconda, 1947). The data had a skewed grid with no precise elevations, and the samples taken had no width values. These data are therefore used as a guide to the location of old underground workings together with reference data regarding the tenor of mineralisation but serves no purpose for Mineral Resource evaluation.
The Ventana channel sample data recorded coordinates without elevations for the channel sample data. These data have been used by Minesa as a guide to the location of old underground workings together with reference data regarding the tenor of mineralisation but served no purpose for Mineral Resource evaluation.
AUX did some mapping and sampling on the El Emboque exploration tunnel (mined July to October in 2012) the TG1, 2, 3 and 14 tunnels in El Gigante vein and the Ventanas/Casita tunnel in Barrientos (Mascota vein system). The mapping and sampling did not have survey control in the work that took place in TG1, 2, 3 and 14 so the exact position of the samples is unknown. All other sampling and mapping followed the AUX protocol.
Figure 9.7 shows the location of the tunnels mapped to date (AUX and Minesa) that have proper survey control, mapping, sampling and Quality Assurance Quality Control (“QA/QC”).
Figure 9.8 shows how the Mascota structures tie in with old workings above (Ventanas/Casita) and below (El Emboque) and how the main body of the Mascota mineralisation has yet to be intersected. Figure 9.9 shows the final survey of Las Haches tunnels along with the proposed upper level of the mine.
Minesa has sampled and mapped tunnels as part of a mine closure program (Figure 9.7). The geology team accompany the mining contractors responsible for closing historical and illegal mine workings on its concessions. Two principal areas, in addition to other tunnels, have been mapped and sampled to date, including 343 samples in 7 tunnels at Las Haches and 263 samples in 6 tunnels at La Bodega.
The old workings only follow the higher-grade mineralisation within wider veins and, therefore, sampling over the full width of the mineralisation is rarely possible. The most important information is the confirmation of surface positions and continuity of the veins modelled by deeper diamond drill intersections. The geological mapping at Las Haches tunnel shows evidence of a continuous Mascota vein for around 60 m along strike (Figure 9.10), in line with the modelled wireframes.
| Effective Date January 1, 2021 | Aris Gold | |||
| Page 86 of 384 |
| SRK Consulting | Soto Norte NI 43-101 – Feasibility Study |
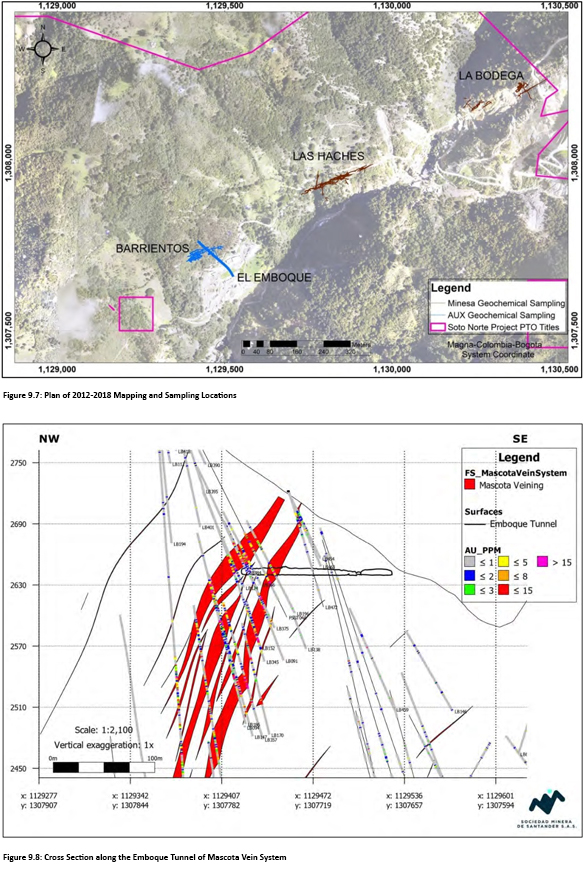
| Effective Date January 1, 2021 | Aris Gold | |||
| Page 87 of 384 |
| SRK Consulting | Soto Norte NI 43-101 – Feasibility Study |
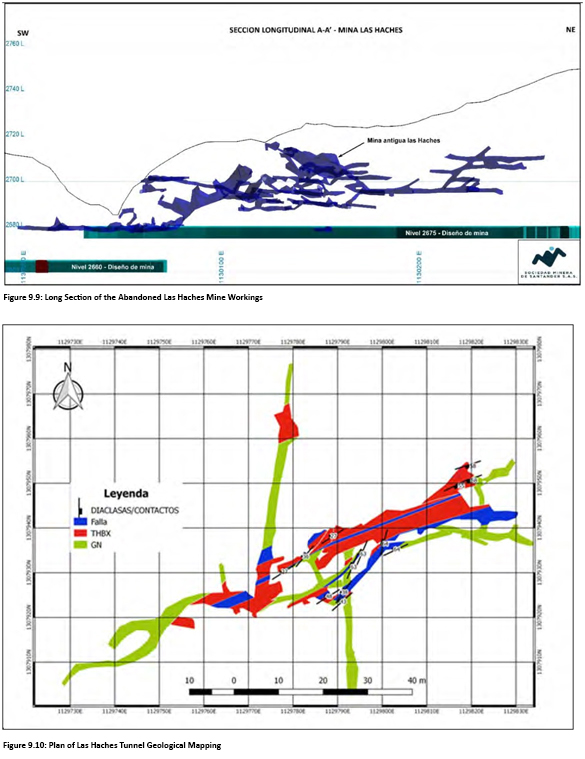
| 9.4 | Geophysical Surveys |
A summary of geophysical surveys in relation to the Soto Norte Project is shown in Table 9.1 (Minesa,2016). Figure 9.11 shows the location and orientation of the 2006, 2012 and 2017 ground magnetics and IP surveys carried out by VDG del Perú S.A.C and Arce Geofísicos Perú.
| Effective Date January 1, 2021 | Aris Gold | |||
| Page 88 of 384 |
| SRK Consulting | Soto Norte NI 43-101 – Feasibility Study |
Table 9.1: Soto Norte Geophysics Survey Summary
| Method
|
Company
|
Date of Report
|
Zone
| |||
|
Ground Magnetics & Induced Polarisation
|
VDG del Peru S.A.C. |
October 2006 |
El Gigante (Soto Norte) | |||
|
Airborne Magnetics & Radiometrics
|
MPX Geophysics |
February 1, 2012 |
El Gigante, Calvetas and surrounding area
| |||
|
Ground Magnetics & Induced Polarisation
|
Arce
Geofisicos, |
March 2, 2012 |
El Gigante (Soto Norte) | |||
|
Ground Magnetics & Induced Polarisation
|
Arce
Geofisicos, |
October, 2012 |
Calvetas | |||
|
Ground Magnetics & Induced Polarisation
|
Arce
Geofisicos, |
December, 2017 |
Calvetas | |||
Figure 9.12 and Figure 9.13 show the combined results from the ground magnetics and IP surveys, respectively.
Ground magnetics show strong anomalies with a NE-SW trend in the eastern part of the combined survey areas, which coincides with the general trend of the mineralisation and the geochemical sampling results. In the western part of the combined survey areas, there is a strong N-S trend which to date has not been drilled and remains unexplained. This area will be intersected when the access tunnel advances through the area towards the mine.
The combined IP results show similar trends but with varying distribution. The most significant results were from the airborne geophysics (radiometry and magnetometry), flown by MPX Geophysics in 2012 (Figure 9.14). This not only indicates anomalous trends within the Soto Norte Project area, but also indicates, in conjunction with the work carried out by Carman (2016) and SRK (2016), that the anomalies continue SW through the Galway and Calvista concessions and onwards to the town of California.
| Effective Date January 1, 2021 | Aris Gold | |||
| Page 89 of 384 |
| SRK Consulting | Soto Norte NI 43-101 – Feasibility Study |
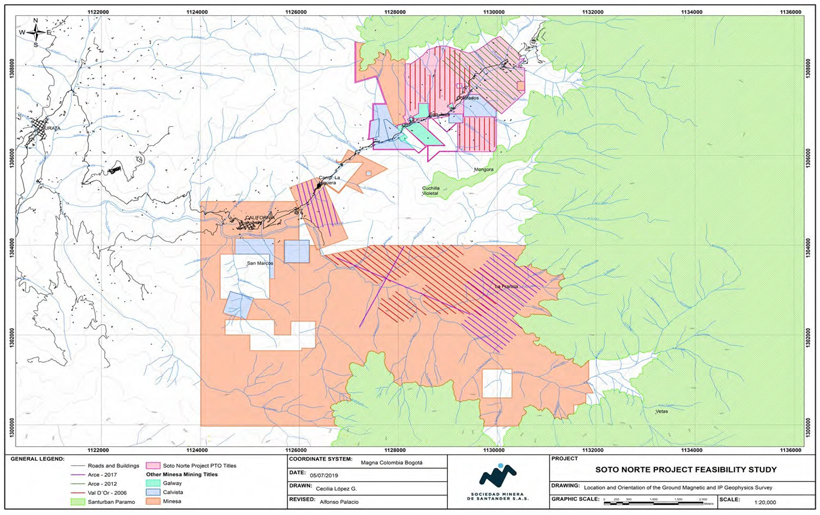
Figure 9.11: Plan of Ground Magnetic and IP Geophysics Survey Locations
| Effective Date January 1, 2021 | Aris Gold | |||
| Page 90 of 384 |
| SRK Consulting | Soto Norte NI 43-101 – Feasibility Study |
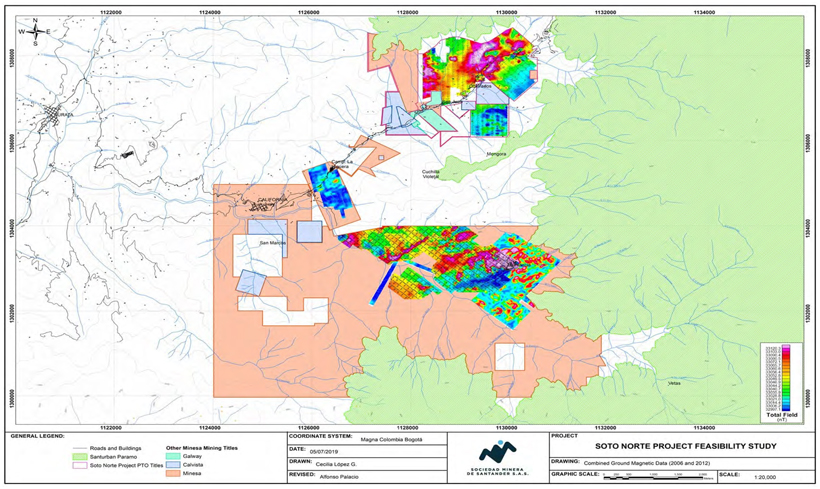
Figure 9.12: Plan of 2006 and 2012 Combined Ground Magnetic Data
| Effective Date January 1, 2021 | Aris Gold | |||
| Page 91 of 384 |
| SRK Consulting | Soto Norte NI 43-101 – Feasibility Study |
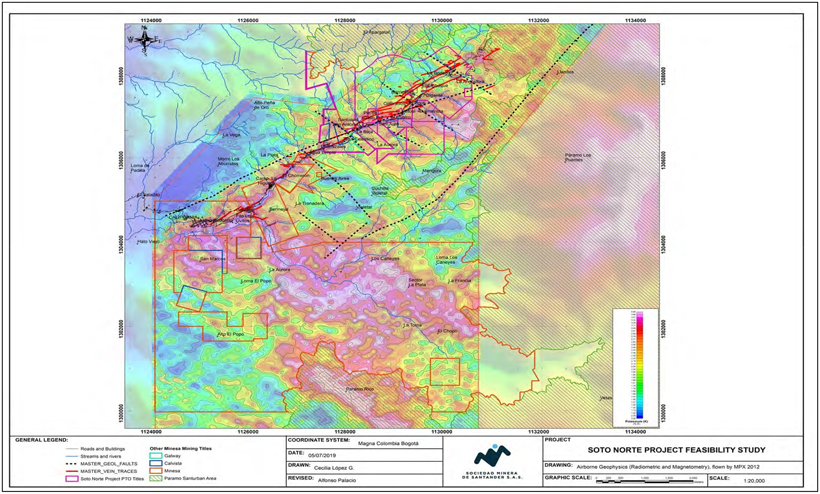
| Figure 9.13: | Plan of 2012 Radiometry and Magnetometry Airborne Geophysics (Source: Modified from Carman Map 6.13 (K-anomaly)) |
| Effective Date January 1, 2021 | Aris Gold | |||
| Page 92 of 384 |
| SRK Consulting | Soto Norte NI 43-101 – Feasibility Study |
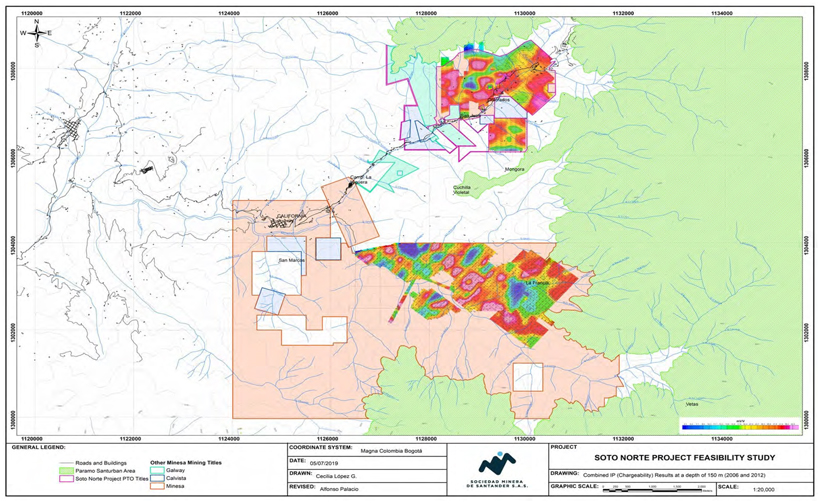
| Figure 9.14: | Plan of 2006 and 2012 Combined IP (Chargeability) Results at a Depth of 150 m |
| Effective Date January 1, 2021 | Aris Gold | |||
| Page 93 of 384 |
| SRK Consulting | Soto Norte NI 43-101 – Feasibility Study |
| 10 | DRILLING |
Diamond drilling was carried out by a range of different contractors during 2006 to 2017. No drilling for the purposes of mineral resource definition has been completed since 2017. The drilling contracts included the provision of drilling machines that could be dismantled and carried by hand. Drill pads and access trails were established by local labourers and the drill rigs were moved manually by crews of 15 to 20 people with the aid of donkeys and as required, helicopter transport. The drilling described is related to exploration only.
Galway and Calvista drillholes were not considered in the MRE as they are outside the PTO application that is the subject of the FS. The drilling platforms are shown in Figure 10.1, classified by year, and in Figure 10.2, classified by exploration company.
A summary of drilling at the Property is shown in Table 10.1 and Figure 10.3. The mineralised structures are open at depth and along strike, with high exploration potential to target the deep structures from underground drilling stations.
Table 10.1: Soto Norte Drilling Summary
| Year
|
Boreholes | Drilled (m) | Company | |||
| 2006
|
12 | 2,991 | VGC | |||
| 2007
|
46 | 12,406 | VGC | |||
| 2008
|
38 | 10,091 | VGC | |||
| 2009
|
85 | 33,157 | VGC | |||
| 2010
|
172 | 66,291 | VGC | |||
| 2011
|
165 | 64,386 | VGC / AUX | |||
| 2012
|
274 | 135,340 | AUX | |||
| 2013
|
30 | 14,990 | AUX | |||
| 2016
|
79 | 34,947 | Minesa | |||
| TOTAL
|
901 | 374,598 | ||||
| Effective Date January 1, 2021 | Aris Gold | |||
| Page 94 of 384 |
| SRK Consulting | Soto Norte NI 43-101 – Feasibility Study |
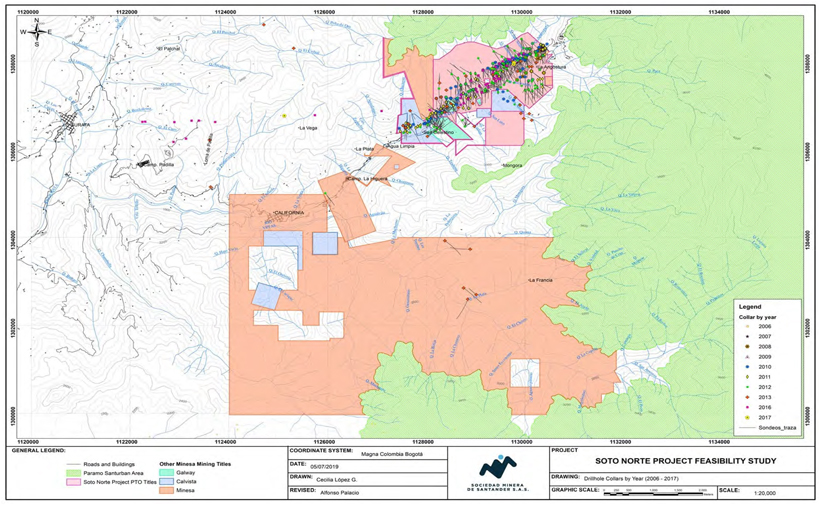
| Figure 10.1: | Plan of 2006 – 2017 Regional Drillhole Collar Locations by Year |
| Effective Date January 1, 2021 | Aris Gold | |||
| Page 95 of 384 |
| SRK Consulting | Soto Norte NI 43-101 – Feasibility Study |
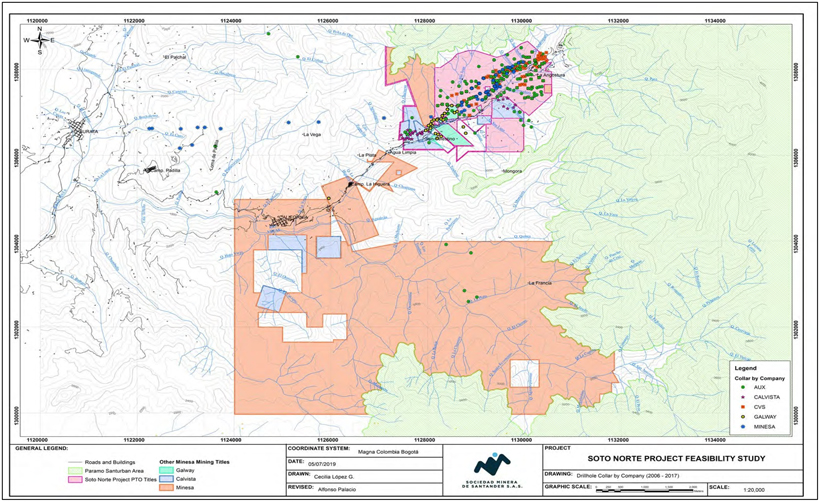
| Figure 10.2: | Plan of 2006 – 2017 Regional Drillhole Collar Locations by Operator |
| Effective Date January 1, 2021 | Aris Gold | |||
| Page 96 of 384 |
| SRK Consulting | Soto Norte NI 43-101 – Feasibility Study |
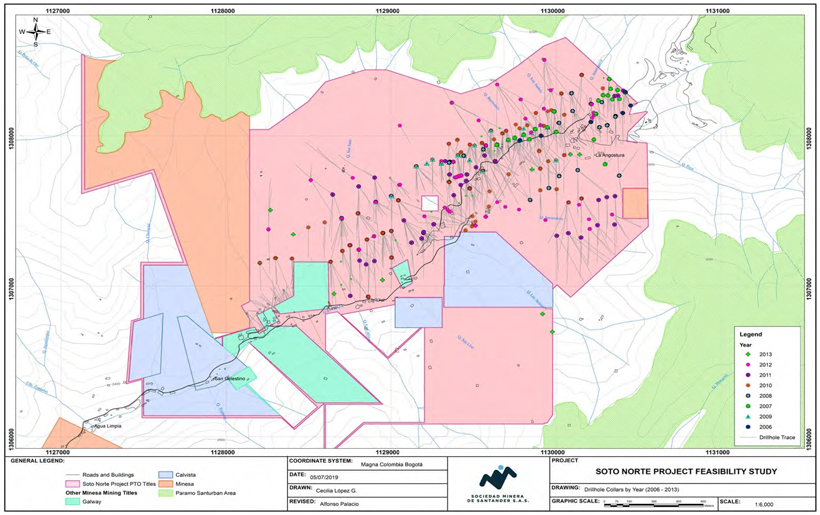
Figure 10.3: Plan of Exploration Drillholes Supporting the Mineral Resource Estimate
| Effective Date January 1, 2021 | Aris Gold | |||
| Page 97 of 384 |
| SRK Consulting | Soto Norte NI 43-101 – Feasibility Study |
| 10.1 | Drilling Grids |
In general terms, after target definition, the drilling was initially carried out on sections spaced by 100 m to verify the characteristics and continuity of the mineralisation. A preliminary study by Henrique de Souza (de Souza, 2012) was carried out to define the ideal drilling grid and concluded the drillhole spacing indicated in Table 10.2 for Resource classification.
Table 10.2: Ideal Drill Spacing
| Vein System |
Classification
|
|||||||||
| Measured
|
Indicated
|
Inferred
|
||||||||
| Mascota | 25 x 12.5 m | 50 x 25 m | >50 x 25 m | |||||||
| Gigante | 25 x 12.5 m | 50 x 50 m | >50 x 50 m | |||||||
In sequence, the grid was first closed to 100 x 100 m, and later to 50 x 50 m. At some locations, this distance was further reduced to 25 x 25 m, according to infill drilling planning to provide the required information for geostatistical studies. In general, the grids are variable across the deposit with the tightest grids focused in the shallower portions (<150m below surface) of the deposit. The drilling grid distribution on the Mascota (M1) vein are shown in Figure 10.4, which has been created by generating a radius of 12.5 m (red), 25 m (green), and 50 m (blue), around the intersections used to generate the wireframe. Areas where infill drilling have been completed are shown by contiguous areas. At depth (below 2,400 m) the drilling intersections remain relatively wide (50 – 100 m) which is a function of the steep intersection angles due to collar limitations from the topography. It is recommended further infill drilling will be completed once underground development is in place to offer more optimised drilling intersections.
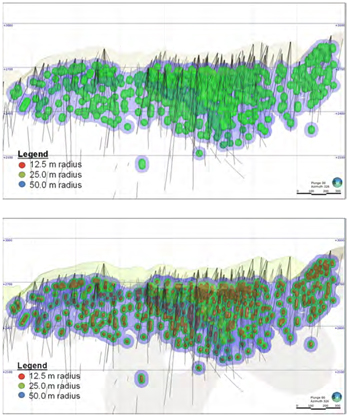
Figure 10.4: Long Section of Initial (Top) and Final (Bottom) Infill Drill Spacing at the Mascota Vein
| Effective Date January 1, 2021 | Aris Gold | |||
| Page 98 of 384 |
| SRK Consulting | Soto Norte NI 43-101 – Feasibility Study |
SRK conducted an initial review of the geological model and grade continuity in 2016 before the 2016 infill program, which established within the main structures that geological continuity could be established at a slightly wider grid spacing of between 40 x 40 m and 50 x 50 m. The 2016 drilling program, carried out by Minesa, therefore comprised further infill drilling where higher grade Inferred Resources required upgrading to Indicated Resources and where there was a need to improve confidence in the continuity of mineralisation.
| 10.2 | Drilling Procedures |
The tough topographic conditions made the preparation and setting up on drill platforms difficult, especially as most of the exploration area is only accessible on foot. Horses and mules were used extensively to transport the drilling equipment, fuel, drilling additives and cores.
Most of the exploration drillholes were angled holes drilled S to SE to cut across the predominant ENE to NE-striking and steeply northwest-dipping trend of mineralisation. The intersections of mineralisation were therefore generally not true widths and, in the case of deep drillholes, sometimes drilled sub-parallel the structure being intercepted. Most drilling platforms had to be prepared by hand.
Drillholes were collared with HT (71 mm diameter) or HQ (63.5 mm), then reduced as drilling conditions required to NT (58.9 mm) or NQ (47.6 mm) and, in some cases as a last resort, reducing to BT (40.8 mm) or BQ (36.5 mm).
During each drilling campaign, the drill core was placed into galvanised steel core boxes with sliding lids. These were secured with tie straps before being transported down slope by mules then by truck to the logging facility.
The preparation of drilling platforms and all drilling site activities were supervised by security, safety, environmental, and geology staff. The collars of most completed drillholes were marked by a concrete plaque with the drillhole ID. Polyvinylchloride (“PVC”) plastic pipe was used to collar the first few meters of the drillholes and mark the drillhole location and general orientation. Platforms were returned to their original landform after drilling was completed.
| 10.3 | Drillhole Surveying |
Early drillhole collars were surveyed by a contracted surveyor using sub-decimetre differential GPS equipment tied into the surface triangulation. Later drillhole collars were tied into the surface triangulation by total station surveying equipment.
Early in the Project, drillhole deviation was measured using Tropari and Pajari single-shot instrumentation with readings taken every 25 m. During 2012-13, magnetometer-accelerometer style multi-shot instruments from Flexit and Icefield were used, with measurements taken every 3 to 6 m.
Drillhole surveying carried out between 2016-2017 used SPT-GIRO surveying throughout each drillhole and ensured that the survey arrived at the same point of departure when it was winched back to surface. A range of geotechnical measurement tools were run at the same time (acoustic and optic televiewers, density determination, induction – gamma ray measurement of conductivity, resistivity, water flows and temperature). The downhole surveying was contracted out separately to Century Wireline Services.
The survey of the boreholes was carried out within the borehole tubing using a North Seeking Gyro tool with measurements taken at set downhole intervals to measure borehole deviation. If the deviation was greater over a given distance than that agreed in the drilling contract, the hole was drilled again or wedged
| Effective Date January 1, 2021 | Aris Gold | |||
| Page 99 of 384 |
| SRK Consulting | Soto Norte NI 43-101 – Feasibility Study |
at the cost of the drilling contractor.
| 10.4 | Drillhole Orientation |
Drillhole orientation is based on available geological and survey data, and was designed, where possible, to intersect veins at suitable angles to provide representative sampling (Figure 10.5). Most drilling was completed with intersections orientated from hangingwall to footwall.
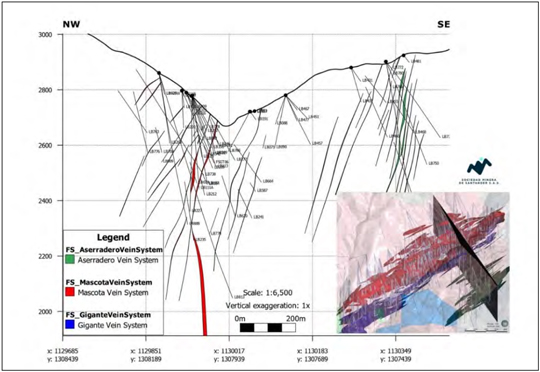
Figure 10.5: Cross Section of Drillholes Relative to Vein Orientation
| 10.5 | Conclusions and Recommendations |
In the opinion of SRK, the drilling procedures appear to generally conform to industry best practices and the resultant drilling pattern is sufficiently dense to interpret the geometry, boundaries and different styles of mineralisation in the deposit with a relatively good level of confidence within well drilled areas. SRK has undertaken a number of site inspections to review drilling procedures in practice and noted that Minesa staff conform to internal defined protocols.
It is highlighted that at depth the intersection angles of the drilling to the veins are not optimised due to the limitation on the collar locations. It is SRK’s opinion that the drilling orientations are sufficiently reasonable to accurately model the geology and mineralisation based on the current geological interpretation. Areas with poor interception angles have been accounted for in the mineral resource classification, and SRK strongly recommends drilling these areas from different positions to improve the angle of intersection in any future programs. Confidence in the geological interpretation decreases in areas of reduced sample coverage.
It is SRK’s opinion that the drilling is suitable for use in the geological model and Mineral Resource estimation process. SRK does not consider there to be any additional factors related to recovery, sampling or intersection angles which have not been discussed in the text, that could materially impact the estimate.
| Effective Date January 1, 2021 | Aris Gold | |||
| Page 100 of 384 |
| SRK Consulting | Soto Norte NI 43-101 – Feasibility Study |
| 11 | SAMPLE PREPARATION, ANALYSIS AND SECURITY |
| 11.1 | Introduction |
As stated in Section 6.2, numerous phases of drilling and sampling have been completed on the project by the various owners between 2005 and 2019.
In 2015 upon the change of ownership to Minesa, Dr Armando Simón, P. Geo. of Geological Consulting Exploration and Mining SpA (“Geoexmin”) undertook an audit on the available QC data, sample preparation laboratory, and procedures. The audit was split in two groups: historical data from 2006 – 2013 and 2016 exploration data.
| ● | The external control and assay results from the Project show low bias and dispersion within the reasonable threshold, therefore, the data come from good analytic accuracy and precision. |
| ● | The QC protocol for sample preparation during 2016 exploration campaign is considered adequate for the mineral species in the deposit. Geoexmin requested that ALS Chemex undertakes two modifications to enhance the analytical precision: increase the sub-sample weight to 0.5 kg (prior to grinding) and increase the fire assay (“FA”) mark to 50 g. |
| ● | All available data from historical and Minesa’s exploration campaigns is considered adequate for a Mineral Resource estimate under industry standards and best practices. |
The following subsections describe the sampling and analysis procedures followed during historical and Minesa’s exploration campaigns.
| 11.2 | Ventana |
Channel Sampling
Ventana started exploration in 2006 through channel sampling of accessible mine workings. The 2006 NI 43-101 Technical Report (Reeves, 2006) states that 203 samples were taken, of which most consisted of 3 m long continuous channel samples taken along the walls of the sections that crosscut the principal vein trend. The number of samples in the Minesa database inherited from AUX indicates a total of 250 channel samples taken by Ventana during 2006. The difference may have been due to surface channel samples that Ventana took that were incorporated into the same database.
The 2006 NI 43-101 Technical Report mentions that the walls were initially cleaned to remove superficial contamination and to provide freshly exposed rock for sampling. Plastic sheeting was placed on the floor to catch the rock chips and continuous channels were cut with hammer and chisel to obtain a representative sample of the material in the selected interval. All samples taken on site were secured with plastic pull locks and placed into larger bags, which were also sealed, at the end of each day. The report commented that “for the channels inspected the samples appear to have been taken in accordance with industry standards”.
At the end of the sampling program, the sealed samples were delivered to DHL in Bucaramanga and sent by airfreight to ACME Analytical Laboratories, Vancouver (“ACME”), for sample preparation and analysis. ACME held ISO 9001 and 17025 accreditations during this time. The samples were prepared at ACME by drying at 60°C, crushing the entire sample to 70% passing 10 mesh, splitting off a 250 g subsample and pulverizing that to 95% passing 150 mesh. A 30 g aliquot was analysed for 37 elements by Inductively Coupled Plasma – Mass Spectrometry (“ICP-MS”) after digestion in hot aqua regia. It is noted that only ACME inserted QA/QC samples.
| Effective Date January 1, 2021 | Aris Gold | |||
| Page 101 of 384 |
| SRK Consulting | Soto Norte NI 43-101 – Feasibility Study |
The 2008 NI 43-101 Technical Report (O’Prey, 2008) reports 2,609 rock samples taken with the same approach described in the 2006 Technical Report. The official database which Minesa received through AUX has a considerably lower number of channel samples recorded. After 2006, the sample preparation changed slightly as the samples were first prepared by the Vetas Miners Association (“Asomineros”) in the nearby town of Vetas before being sent to ACME, where the samples were analysed for Au, Ag, and a 36 element ultra-trace package by hot aqua regia digestion of a 15 g aliquot and ICP-MS analysis.
Minesa uses the Ventana data associated with channel sampling for exploration reference purposes only as the elevations of the channel samples were not recorded in the survey database inherited from AUX. The channel sampling completed by AUX has been excluded from any MRE.
Soil Sampling
MMI soil samples were shipped directly to SGS Mineral Services (ISO-IEC 17025) in Toronto, Canada for MMI partial leach of a 50 g aliquot and ultra-trace ICP-MS analysis of the solution for Au, Ag, and 40 additional elements.
Minesa has records of 6,627 soil samples taken by Ventana between 2006 and 2011. Soil samples have been used only for exploration purposes.
Logging and Drill Core Sampling
The 2008 NI 43-101 Technical Report (O’Prey, 2008) reports that drill core sampling was carried out in accordance with a manual outlining drill core sampling and QA/QC protocols.
Chain of custody tracking was reported as being maintained and monitored throughout the process with half cores selected for analysis, bagged, sealed, and then placed in larger bags, which were also sealed. On-site storage was in a lockable core shed with 24-hour security until an entire drillhole was shipped for sample preparation as a single batch.
Two independent laboratories (Asomineros and Inspectorate America Laboratory, located in Medellin) were used for sample preparation with the condition of security seals verified and sign-off on receipt.
For duplicates, an extra numbered bag was provided to the sample preparation laboratory with instructions to prepare a duplicate split using the coarse reject of the original sample. Blanks consisted of unaltered gneiss gathered from a local quarry site to provide a mineralogically similar matrix and appearance to the other samples. For the insertion of the reference standard, the preparation laboratory was instructed to provide an empty, numbered pulp envelope, which was then filled and inserted in the sample batch by Ventana employee prior to shipment to ACME. There the samples were analysed for Au, Ag, and a 36-element ultra-trace package by hot aqua regia digestion of a 15 g aliquot and ICP-MS analysis.
O´Prey (2008) reported that about 15% of samples were check-assayed for Au and Ag by the Inspectorate America Laboratory Inc. in Sparks, Nevada.
O’ Prey “considers the methodology, procedures, and results of Ventana’s QA/QC program to be robust and adequate with respect to sample collection, preparation, analysis and security”.
| Effective Date January 1, 2021 | Aris Gold | |||
| Page 102 of 384 |
| SRK Consulting | Soto Norte NI 43-101 – Feasibility Study |
| 11.3 | AUX Colombia |
Channel Sampling
AUX took 339 rock chip channel samples (surface and underground) between 2011 – 2013. AUX staff currently working for Minesa state that these samples were transported from the work area via truck to the El Portico Core Logging Facility (“El Portico”).
The samples were then weighed, barcoded, sealed, placed in batches (larger bags) which were also sealed with zip-strips ready for transport to an ALS Chemex sample preparation laboratory in Bucaramanga (ALS Chemex Bucaramanga). The contents in each of the large bags were recorded on a Sample Packing Form used to track the samples through to the sample preparation laboratory.
AUX had a chain-of-custody protocol in place whereby the names of all workers, technicians or geologists who handled the channel samples were recorded on forms until the samples were shipped to the ALS Chemex Bucaramanga.
Once the samples were received, ALS Chemex Bucaramanga scanned the barcode and entered the data into their Laboratory Information Management System (“LIMS”). The sample was then crushed and pulverised in accordance with the sample preparation flowsheet guidelines (ALS, 2016).
Au and Ag assays were carried out by fire assay on 30 g aliquots. The fire assay beads were then digested using aqua regia and the concentrations of Au and Ag in the solution were measured using atomic absorption spectrometry, referred to as an “AA finish”. If the Au grade was greater than 5 g/t or the Ag grade was greater than 100 g/t, the fire assay was repeated using a gravimetric finish.
The assay method applied to the 51 trace elements was Aqua Regia and Inductively Coupled Plasma – Atomic Emission Spectroscopy (“ICP-AES”) / ICP-MS. The results of all assays were then made via LIMS, which could be accessed through security control on the ALS Chemex Bucaramanga website.
No QA/QC controls were directly inserted with the channel samples, however, channel samples were sent to the analytical laboratory at the same time as core samples which did have proper QA/QC control. The channel sampling completed by AUX has been excluded from any MRE.
Soil Sampling
AUX took 368 soil samples during 2012. AUX staff currently working for Minesa state that these samples were transported from the work area via truck to El Portico.
The samples were then weighed, sealed, placed in batches (larger bags) which were also sealed with zip-strips ready for transport to SGS sample preparation laboratory in Medellin (ISO / IEC 17025_. The contents in each of the large bags were recorded on a Sample Packing Form used to track the samples through to the sample preparation laboratory. The samples were sent via Servientrega (Colombian courier service) to SGS Colombia in Medellin.
The soil samples were then prepared in the SGS Colombia laboratory before they were sent to SGS Lima (ISO 9001: 2015 certified) for analysis using the MMI process, which was developed by SGS.
MMI consists of producing a weak extraction using a multi-component solution to release the mobile ions and then using a high sensitivity ICP-MS analysis which provides part per billion range results.
| Effective Date January 1, 2021 | Aris Gold | |||
| Page 103 of 384 |
| SRK Consulting | Soto Norte NI 43-101 – Feasibility Study |
No QA/QC controls were inserted with the soil samples.
Logging and Drill Core Sampling
In late 2012, the Coffey Mining NI 43-101 Technical Report (Coffey, 2013) covered drill core logging, sampling and preparation procedures, as well as analysis and security measures carried out by AUX from the drill site to the core logging and core cutting facility through to receipt of samples by the analytical laboratory.
Upon receipt at El Portico, Coffey Mining (2013) reports that the core boxes were opened and inspected for consistency fit and meterage blocks. Box numbers were checked against the driller’s advance records. A quick initial geological log was conducted at this stage, noting main rock types and structures. Measurements to determine core recovery and Rock Quality Designation (“RQD”) values were taken and then the core was photographed together with its ID, depth intervals, colour code, and scale bar.
Coffey Mining (2013) reports that detailed logging of core was then carried out recording lithology, structure, alteration, and the presence of any visible sulphides or other mineralisation in a paper log, which was later scanned and retained as PDF files for future reference. This information was converted to digital format on an on-going basis. Detailed logging included the designation of sampling intervals, which were marked directly on the core. Standard sample intervals were 1 m in length, except where they were modified due to major lithology changes.
During the logging process, density and Point Load Test (“PLT”) determinations were undertaken. The density determinations were carried out at ±20 m intervals, however, the samples were not wax coated prior to weighing in air and then in water and therefore porosity was not accounted for and the resultant densities may have resulted in inflated bulk densities.
The PLT determinations were carried out at similar intervals to the density determinations. No errors were noted in the PLT determinations.
Core was then marked for cutting after the logging process had finished. Lines drawn on the core were used as a guide for cutting with diamond-blade rock saws at El Portico. After cutting, both halves of the cut core were placed back in the core box and three-piece bar-coded sample tags were then placed in the boxes at the start of each sampling interval.
Half core pieces were placed in a plastic sample bag. For intervals where the core consisted of broken fragments, one-half of the volume of material was selected by hand. Intervals containing clay or other unconsolidated material were split vertically with a knife, usually while the material was still saturated. The sampling intervals (and assay returns) were entered into the core logs.
Individual core samples were then weighed, sealed, placed in batches (larger bags) which were also sealed with zip-strips ready for transport to ALS Chemex Bucaramanga. The contents in each of the large bags were recorded on a Sample Packing Form used to track the samples through to the sample preparation laboratory.
Coffey (2013) reports that AUX had “a chain-of-custody protocol in place whereby the names of all workers, technicians or geologists who handled the core are recorded on forms until the samples are shipped to the analytical laboratory,” which was ALS Chemex in Lima, Peru (ALS Chemex Lima).
Once received, ALS Chemex Bucaramanga scanned the sample barcode and entered the data into their
| Effective Date January 1, 2021 | Aris Gold | |||
| Page 104 of 384 |
| SRK Consulting | Soto Norte NI 43-101 – Feasibility Study |
LIMS. The sample was then crushed and pulverised in accordance with the sample preparation flowsheet guidelines from ALS, 2016 (Figure 11.1). After preparation, the sample pulps were shipped by air courier to ALS Chemex Lima for analysis.
Au and Ag assays were carried out by fire assay on 30 g aliquots. The fire assay beads were then digested using aqua regia and the concentrations of Au and Ag in the solution were measured using an AA finish. If the Au grade was greater than 5 g/t or the Ag grade was greater than 100 g/t, the fire assay was repeated using a gravimetric finish.
The assay method applied to the 51 trace elements was Aqua Regia and ICP-AES/ICP-MS. The results of all assays were then recorded via LIMS, which could be accessed through security control on the ALS Chemex website.
Coffey (2013) also reports on the QA/QC program implemented by AUX and concluded that “after analysing all procedures and results gathered under the QA/QC program undertaken by AUX (Coffey, 2013) concludes that the data presents a sufficient quality to support a Resource estimate”.
Minesa commissioned an audit of the historical data and of the QA/QC data through Dr Armando Simón (QP) of Geoexmin, and found that the historical data presented was of sufficient quality to support a MRE.
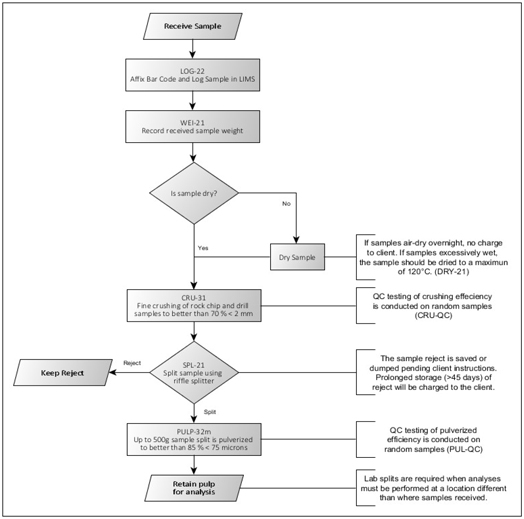
Figure 11.1: ALS Chemex Bucaramanga Sample Preparation Flowsheet
| Effective Date January 1, 2021 | Aris Gold | |||
| Page 105 of 384 |
| SRK Consulting | Soto Norte NI 43-101 – Feasibility Study |
| 11.4 | Minesa |
Channel Sampling
Minesa took 749 rock chip channel samples between 2015 and 2018 with most of the samples taken from underground workings.
Minesa has continued to use the same company, ALS Chemex, to prepare and analyse the samples as that used by AUX. The ALS Chemex Bucaramanga sample preparation laboratory has since been moved to Medellin. Minesa has not changed the sample preparation method, except to increase the subsample weight from 250 to 500 g in early 2016. The channel samples were transported from the work area via truck to El Portico.
The samples were weighed, barcoded, sealed and placed in batches (larger bags) which were also sealed with zip-strips ready for transport. The contents in each of the large bags were recorded on a Sample Packing Form used to track the samples through to the sample preparation laboratory. The samples were sent via Servientrega (Colombian courier service) to an ALS Colombia in Medellin (“ALS Colombia”) for sample preparation.
ALS Colombia has ISO 9001:2015 for survey/inspection activity and ISO/IEC 17025:2017 UKAS ref 4028 for laboratory analysis. Once the samples were received by ALS Colombia, they scanned the Minesa barcodes and entered the data into their LIMS. The samples were then crushed and pulverised to produce a sample pulp, which was sent to the ALS analytical laboratory in Peru (“ALS Peru”) for analysis.
The sample preparation and analysis are the same as that for drill core samples and is described below in the Logging and Drill Core Sampling section.
Minesa had a chain-of-custody protocol in place whereby the names of all workers, technicians or geologists who handled the channel samples were recorded on forms until the samples were shipped to the ALS Colombia.
QA/QC controls were included in the channel samples which are the same as those used for drill core samples and are described in the Sample Preparation and Sample Security section.
Soil Sampling
Minesa took 893 soil samples between 2015 – 2017. The soil samples from the program are not considered within the current Mineral Resource estimate.
Minesa continued to use the SGS laboratory to prepare and analyse the soil samples as that used by AUX. Neither the sample preparation nor analytical method has changed since it was first used by AUX.
The soil samples were transported from the work area via truck to El Portico.
The samples were then weighed, barcoded, sealed and placed in batches (larger bags), which were also sealed with zip-strips ready for transport to SGS sample preparation laboratory in Medellin. The contents in each of the large bags were recorded on a Sample Packing Form used to track the samples through to the sample preparation laboratory. The samples were sent via Servientrega to SGS Colombia in Medellin.
The soil samples were then prepared in the SGS Colombia laboratory before the prepared sample was sent to SGS Lima for analysis using the MMI process, developed by SGS.
| Effective Date January 1, 2021 | Aris Gold | |||
| Page 106 of 384 |
| SRK Consulting | Soto Norte NI 43-101 – Feasibility Study |
QA/QC controls were included in the soil samples sent for preparation and analysis.
Logging and Drill Core Sampling
The sampling and preparation of samples for analyses begins with core handling and logging followed by all the processes and data retrieval that must take place prior to the cores being cut. Each process has security procedures that have to be carried out and recorded.
The core logging facility used by Minesa is the same location as that used previously by AUX. Minesa carried out refurbishment of this facility prior to starting the 2016 drilling program and used the same layout as that designed previously.
Operating equipment comprising five core saws, dust extraction, sound proofing, cutting sediment collection and water cleaning tanks was improved in 2016. A Geological Information System server (AIG, DIG) was installed to cater for increased use of computers for logging as well as logging tablets.
Prior to use, noise emissions from the core cutting equipment were measured to make sure that the impact on nearby residents would be within acceptable limits. An inspection of the sediment cleaning tanks and clean water discharge was also made to make sure that no contaminated water was discharged into the La Baja River.
The sample preparation facility was located approximately 300 m from the El Portico logging area. SRK visited the sample preparation facility during the site inspection and found the facility to be organised and clean, and the equipment in good working condition. Due to the low volume of samples produced in 2017, ALS has since removed their sample preparation facility and sent samples directly to their sample preparation facility in Medellin.
The process flow sheet from receipt of cores at the logging facility right through to dispatch of samples to the sample preparation laboratory and transport of cores to the core shed is presented in the workflow diagram shown in Figure 11.2.
The logging during 2016-2017 was carried out on logging tablets or, with laptop computers with the tablet software installed. The logging data was verified through a series of filters built into the table software to make sure that the geologist could not input parameters that conflicted with fixed parameters. The logging data was directly downloaded onto an SQL server where the data was analysed against core photographs and other information. After verification of the data, the borehole logs and sections were updated automatically via a link between the SQL and Studio EM software.
| Effective Date January 1, 2021 | Aris Gold | |||
| Page 107 of 384 |
| SRK Consulting | Soto Norte NI 43-101 – Feasibility Study |
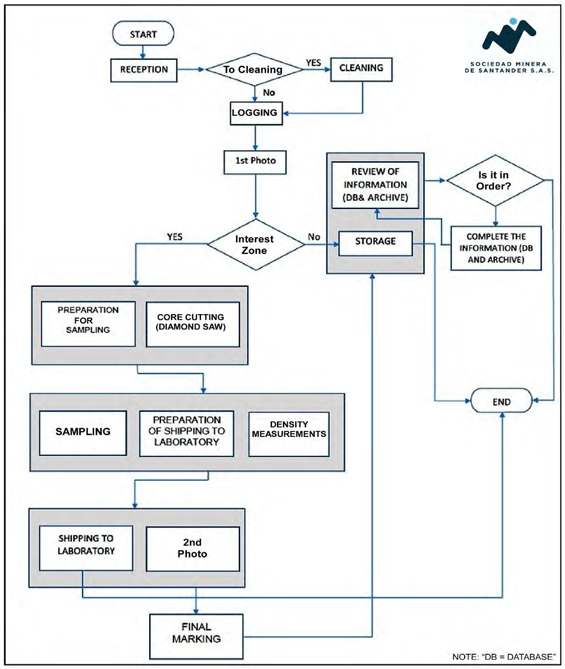
Figure 11.2: Soto Norte Core Preparation and Logging and Sample Cutting and Despatch Flowsheet
Drilling Supervision and Transfer of Cores to the Logging Facility (Chain-of-Custody)
The drilling contractor measures each drilling advance together with the core recovered and then places the drillhole into galvanised metal core boxes.
At the drill rig, the core was routinely inspected by the drillhole-supervising geologist or engineer. Notes were taken regarding recoveries and any other unusual conditions. Lids were then placed on the boxes and secured by rubber straps before being carried down to the staging area by mules.
Core was then transported by pickup truck to the core logging facility by workers supervised by the drilling company. This process was documented in detail on a Transport Control Form when the full core boxes
| Effective Date January 1, 2021 | Aris Gold | |||
| Page 108 of 384 |
| SRK Consulting | Soto Norte NI 43-101 – Feasibility Study |
were delivered to the core logging facility.
Receipt of Cores and First Measurements
The written receipt of full core boxes delivered to the core logging facility by the drilling contractors was carried out each morning. Minesa staff would review the core to make sure that disturbance had not taken place during transit. If the core had been disturbed, it was pieced back together by using two colour lines that the Minesa driller supervisors marked either side of the core with chalk during the drilling process as a guide.
The drilling tags would also be revised during this process to make sure that the drilled lengths and recoveries were correct. Once this process was finished, Minesa staff then made measurements of recovered core using the following formula:
Recovery % = core recovered length (m) / core run length (m) x 100
Historical overall drill core recoveries (an indication of the recovery ranges expected) are summarised in Table 11.1 (Minesa, 2016). It is usual that the highest core losses occur in the first 30 m of drilling, as shown in Table 11.1.
Local core recoveries were estimated for each drill run (up to 3 m in length) and recorded in a spreadsheet. Recoveries less than 50% were very poor.
The Minesa drilling contracts included a penalty for poor core recovery if the core losses were due to bad drilling practice. This had to be assessed either up at the drill site or on receipt of cores at the core logging facility. If recovery of core was less than 50% in a mineralised zone, the drilling contractor would have to redrill the intersection at his own expense. This contractual penalty helped Minesa ensure that good core recovery was achieved through most of the drilling program.
Once the core recovery measurements were made, the core was washed with water and a brush, although zones of poorly consolidated material were left unwashed.
Table 11.1: Summary of Core Recovery From 2006 – 2016
|
Year
|
Total (%)
|
Mineralised (%)
|
First 30m (%)
|
|||||||
| 2006
|
92.71
|
96.89
|
83.03
|
|||||||
| 2007
|
89.42
|
93.04
|
79.88
|
|||||||
| 2008
|
85.38
|
94.43
|
73.26
|
|||||||
| 2009
|
89.52
|
94.35
|
76.56
|
|||||||
| 2010
|
87.07
|
91.76
|
70.88
|
|||||||
| 2011
|
87.22
|
92.08
|
67.55
|
|||||||
| 2012
|
87.05
|
89.60
|
66.35
|
|||||||
| 2013
|
89.70
|
91.61
|
74.83
|
|||||||
| 2016
|
88.02
|
92.45
|
69.87
|
|||||||
| 2017
|
88.20
|
89.99
|
73.20
|
|||||||
| Effective Date January 1, 2021 | Aris Gold | |||
| Page 109 of 384 |
| SRK Consulting | Soto Norte NI 43-101 – Feasibility Study |
First Core Photograph
High-resolution digital photos were taken starting with core retrieved from the top of the hole and continuing throughout the length of each drillhole. Each photograph shows two boxes and a marker with the drillhole number, interval, and a scale bar. Images were downloaded onto the site computer and relabelled with the hole and core box numbers. The JPEG files from each drillhole were combined into one PDF file and included in the digital filing system.
Downhole Logging and Downhole Surveying
Most historical coring was not orientated (triple tube, down hole tele-viewer surveys). Minesa’s review of the previous geological model noted the need for detailed orientated structural interpretations to aid the building of the type of geological and geotechnical models that are required when converting Mineral Resources to Mineral Reserves.
The structural component of historical logging had centred on logging the ß angles of structures such as foliation and fault angles. To obtain better orientation data, Minesa introduced downhole logging (contracted from Century Wireline Surveys) to determine the true orientation of faults, geological contacts, and other structural features.
Other information recovered included the water temperature gradients, density measurements, magnetic susceptibility, downhole flowmeter surveys as well as other analytical data.
Geotechnical Logging (2016 – 2017 Protocol)
This protocol, along with the revision of core photographs (taken during Ventana and AUX tenure), comprised a re-logging campaign to collect enough geotechnical data that could be used for mine and stope design purposes.
Normal geotechnical logging commenced on the receipt of core to determine and record the RQD measurements.
The geotechnical logging digitally recorded the following parameters: rock blocks: weathered condition and strength of the intact rock according to International Society of Rock Mechanics (“ISRM”) standard coding. Visual rock strength was estimated by breaking the core with a geological hammer, cutting it with a knife or indenting it with fingernail. Results were compared with standard (PLT) estimates for which core samples were taken and tested with every 20 m of drillhole advance. The following parameters were logged during geotechnical drilling campaigns:
| ● | Rock mass jointing: Weighted joint density, RQD and Joint Set Number (“Jn”) values were logged to assess the number of joint sets and jointing patterns of the rock mass. These parameters help with the determination of block volume and fracture spacing. |
| ● | Joint infilling: Type and thickness of minerals coating or filling the joints. |
| ● | Joint condition: Roughness, aperture, wall rock weathering and joint infilling were logged according to Rock Mass Rating (“RMR”) and Q-System coding. |
| ● | Ground conditions: Stress Reduction Factor (“SRF”) and Joint Water Reduction Factor (“Jw”) to assess the rock response to field stress and groundwater pressure. |
| Effective Date January 1, 2021 | Aris Gold | |||
| Page 110 of 384 |
| SRK Consulting | Soto Norte NI 43-101 – Feasibility Study |
Once these parameters were logged for each core run, Q, RMR and Geological Strength Index (“GSI”) values were calculated directly in the SQL database and then updated to modelling software or exported as CSV files. GSI was calculated indirectly from RQD and joint condition rating using the following formula (Hoek et al, 2013):
GSI = (1.5 x RQD) + (Joint Condition Rating / 2)
Geological Logging (2016 – 2017 Protocol)
During a 2015 review of previous practices and protocols, Minesa recognised deficiencies in previous geological core logging, which had been more orientated towards qualitative logging and without establishing fixed descriptions. In preparation for the 2016 and future drilling programs, improvements were therefore made to the logging protocols, the categorisation of rock types, alteration, structural features, and mineralisation.
Geological logging commenced after the geotechnical logging had finished. The protocol determines the percentage of mineral constituents like quartz, feldspar, chlorite, and other rock forming minerals. It also records their degree of alteration and the characteristics of any mineralisation encountered (stringers, veining, massive, replacement including the nature of ore-bearing minerals, their fabrics, and percentage distribution).
The logging digitally recorded the following parameters:
| ● | Lithology log: Rock type classification was generally straightforward. Faults and veins with a width greater than 10 cm were logged in the lithology log and described according to their composition (matrix, cement, clasts and cavities) and textures (colloform, crustiform, mylonitic, etc). |
| ● | Mineralisation log: Classification of mineralisation textures and assemblages together with visual estimations of the percentage of minerals. |
| ● | Alteration log: Alteration type and intensity on a scale of 1 to 3 (weak, moderate, pervasive). Alteration associated minerals (illite, sericite, chlorite, epidote, etc) were included as a visual percentage estimate. |
| ● | Structure log: Structural features of with a width less than 10 cm (faults, veins, foliation), were recorded with theirs start depth along with the ß angle, width and coded type (such as alunite vein, Cu-sulphide bearing vein, sphalerite bearing vein, minor fault, tectonic foliation, etc). |
| ● | RedOx log: Recorded the degree of oxidation of the rock as a percentage along with an estimate of associated minerals (limonite, goethite, haematite). |
| ● | Special photos: Special photographs were taken and registered in the database with their start depth, minerals observed and texture code. These were mainly taken on mineralised intervals to point out the presence of specific ore mineral assemblages and textures. |
Bulk Density Determination
Bulk density measurements were historically carried out by geology personnel at El Portico. Regular determinations were carried out at 20 m intervals throughout each drillhole and with closer spacing where there were changes in lithology or alteration. A piece of core measuring 10 to 15 cm in length was selected and weighed in air and then again while submerged in water after being immersed in wax coating.
| Effective Date January 1, 2021 | Aris Gold | |||
| Page 111 of 384 |
| SRK Consulting | Soto Norte NI 43-101 – Feasibility Study |
Between 2011 and 2012, some unconsolidated samples were processed using cling film instead of wax coating. These samples were recorded in the database as using this method and were eliminated from the density tables used in the FS MRE.
In 2016, density measurements were carried out on site by Minesa using a similar procedure as used by AUX but changing the sealing agent to hair spray instead of paraffin wax. The use of hairspray as a sealant was approved by Armando Simón (QP) of Geoexmin.
After taking internal density measurements, one sample in every 10 from a sample lot was selected for density measurements in the on-site ALS Chemex sample preparation laboratory. For this process, the hairspray was removed, and the sample was sent to the ALS sample preparation laboratory where it was processed in the same manner as the Minesa procedure, except that ALS Chemex used paraffin wax as the sealing agent. No notable differences were noted in the density results between Minesa and ALS Chemex check samples.
The samples were selected during the geomechanical logging process and returned to the core box after the test was complete and before assay sampling began.
Point Load Test (PLT) Determinations
Since 2011, PLT were carried out using one of two GCTS PLT-100 machines and continued during 2016-2017. The samples were selected during the geomechanical logging process and returned to the core box after completion of the PLT. The PLT machines were periodically returned to the manufacturing company for certification. The PLT process is summarised as follows:
| ● | Samples were taken on average every 10 m, but this could change depending on the geological variety and strength properties of the different lithologies. |
| ● | Sample size was kept in accordance with ISRM standards. Length = 0.7 x Core Diameter for axial samples and Length = 2 x Core Diameter, for diametral samples. |
| ● | Prior to testing, sample information was recorded, including depth, core size, weathering, test type and length of sample. |
| ● | The sample was placed between the testing platens, with failure reached between 10 and 60 s. |
| ● | After the test was completed, additional information was recorded including penetration range of the platens, peak failure reading from the gauge, and a code to classify the failure mode (valid, invalid, structural). |
| ● | From the recorded data, the Is50 (corrected PLT strength index) was calculated directly in the SQL database. From there, it was transferred to modelling software, or exported as a CSV file for further analysis. |
Core Cutting and Sampling Protocols
During the logging process, the core to be sampled was selected and marked for cutting by the senior logging geologist. The minimum sample length was set at 0.40 m for HQ and NQ diameter core. The minimum sample length was a result of the minimum sample weight (500 g) that ALS Chemex determined could be processed without incurring a bias in the sample preparation.
Samples within the mineralisation were selected based on mineralisation style and textures with samples
| Effective Date January 1, 2021 | Aris Gold | |||
| Page 112 of 384 |
| SRK Consulting | Soto Norte NI 43-101 – Feasibility Study |
of different lengths determined on this basis. The maximum sample length determined on this basis was 1 m. Sampling in zones outside the main mineralised areas (low grade or waste) was determined according to the type and degree of alteration. Where no alteration variability was observed, samples were systematically marked at 1 m lengths up to approximately 10 m beyond the main alteration halo.
Core cutting was carried out by feeding the core by hand to the diamond-bladed core saw, to achieve an even half-cut throughout. Both halves of the cut core were placed back in the core boxes which were then returned to the core logging area. Saws were routinely washed with water hoses to eliminate the possibility of contamination between samples.
Cut core was taken out of the core cutting room and placed on a bench for sampling. During the sampling process, the geological staff verified that the sample intervals were cut properly and correspond to the lengths indicated in the logging process.
For intervals where the core comprised broken fragments, one-half of the volume of material was selected by hand. Intervals containing clay or other unconsolidated material were split vertically using a sharp knife. This was usually done while the core was still water saturated. Individual samples were weighed, and the weight was recorded on the sample sheet.
The half core selected as the sample, was carefully placed into unused plastic sample bags, which had been labelled and assigned a bar code. The barcode was duplicated to produce a maximum of three barcode stickers.
The first bar code was placed on the core box in the area where the sample was taken. The remaining two duplicate barcodes were placed on the plastic sample bag along with the written sample number.
The reason for the two bar codes is that the sample preparation laboratory used one of the barcodes to place on the pulp sample bag and, the other, for labelling the sample rejects material. This allows for easy identification and recovery of the samples for duplicate analysis (pulps) or metallurgical testwork (sample reject material).
The sample reject materials are stored in different areas of the Project (Padilla & Llano Redondo) and the sample pulps are stored in the Calvista warehouse.
The end of the sampling process sees the individual samples sealed with ordinary zip-lock straps, individually weighed and then placed in rice bags (up to 25 kg of samples) which are also sealed with a numbered zip-lock strap. The samples were recorded in a sample packing form, ready for trackable transport to the sample preparation laboratory (on site or off site).
AUX and then Minesa had a chain-of-custody protocol in place whereby the names of all workers, technicians, or geologists who handle the core are recorded on forms until the samples are shipped to the sample preparation and analytical laboratory.
Second Core Photograph
The core boxes are photographed for a second time in high resolution after the samples have been removed to have a record of the cut core to show that the sampling process was completed correctly and that the samples were representative.
| Effective Date January 1, 2021 | Aris Gold | |||
| Page 113 of 384 |
| SRK Consulting | Soto Norte NI 43-101 – Feasibility Study |
Sample Preparation and Sample Security
During the 2016 drilling program, samples were prepared on site in a containerised sample preparation unit operated by ALS Chemex. During 2017, samples were prepared off site due to smaller volume with the same sample preparation process. Sample preparation followed the PREP-31 protocol (Figure 11.3), which comprises the following steps (ALS Chemex, 2012):
| ● | Drying controlled temperature 105ºC |
| ● | Crushing to 70% 2 mm (100 mesh ASTM) |
| ● | Quartering with a Jones Splitter to give a 250 g subsample |
| ● | Pulverising the 250 g subsample to 85% 0.075 mm (200 mesh Tyler). |
From the last week in April 2016, the protocol was modified by increasing the weight of the subsample to 500 g.
QA/QC during the sample preparation process, included sieve tests to check that the crushing phase reduced the sample to the required size (70% passing 100 mesh ASTM for crushing and 85% passing 200 mesh Tyler for grinding), cleaning the crushing and grinding equipment by passing through blank material after every sample pass.
The process for the preparation of coarse duplicates is carried out in accordance with the protocol shown in Figure 11.4.
Bar codes were also generated for pulp blanks, pulp duplicates, and certified reference material. After the samples were returned to the geology department, the pulp blanks, duplicates, and certified reference materials (standards) were added to the existing sample pulps by Minesa staff. A separate clean room was designated for this activity in the core logging area. This process ensured the blind insertion of pulp blanks, pulp duplicates, and standards. During this process, standards were matched according to the grade of previous samples, pulp blanks before high grade samples, and duplicates, by the geologist`s selection, across a spread of visual estimated Cu and Fe grades.
The sample pulps produced in the sample preparation laboratory, along with blind insertions, were then placed in cardboard boxes supplied by ALS Chemex. All boxes were wrapped in cling film prior to transport to DHL in Bucaramanga for courier dispatch to Lima, Peru. One of two pre-selected members of the Minesa Geological staff always accompanied the transportation, with the samples never leaving their sight until the transfer process was terminated with the samples been registered with DHL.
Minesa, DHL, and ALS Chemex had standard procedure in case any pulp boxes were inspected by Colombian or Peruvian customs. To the best of Minesa´s knowledge, no pulp boxes were opened in either country.
The 2017 procedure differs slightly to the 2016 procedure as the sample preparation does not take place on site. The pulp blanks, duplicates, and certified reference materials (standards) were added to the existing sample pulps after the sample preparation by ALS staff. The samples that Minesa required as coarse duplicates were indicated to ALS via the sample preparation form and ALS complied with the instructions.
| Effective Date January 1, 2021 | Aris Gold | |||
| Page 114 of 384 |
| SRK Consulting | Soto Norte NI 43-101 – Feasibility Study |
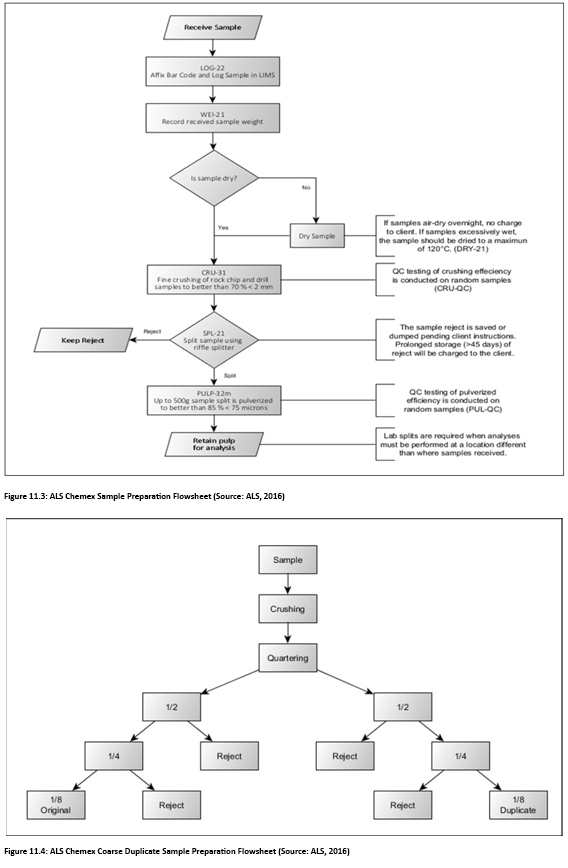
Assaying
Assaying has always been carried out by accredited external laboratories and an independent laboratory
| Effective Date January 1, 2021 | Aris Gold | |||
| Page 115 of 384 |
| SRK Consulting | Soto Norte NI 43-101 – Feasibility Study |
for assay checks. In 2016, ALS Global was selected as the accredited external laboratory. ALS has developed and implemented a Quality Management System (“QMS”) designed to ensure the production of consistent and reliable data. The system covers all laboratory activities and takes into consideration the requirements of ISO standards. ISO registration and accreditation provides independent verification that the QMS in operation meets international standards. ALS Lima, where the samples were sent, is certified as being ISO 9001:2015 and ISO 17025:2017 accredited.
ALS was used as Minesa’s primary for assay preparation and analysis. SGS Lima was used as Minesa’s check laboratory.
During the 2016 campaign, two compulsory assay packages were used: ME-MS41 and AU-AA26, shown in Table 11.2 (Minesa, 2016). If over-limits were exhibited in the ME-MS41 package for Ag, Cd, Cu, Mn, Pb, Te, Zn, or S, then the samples were analysed using the over-limit packages ME-AA46 for Ag, Cd, Cu, As, Mn, Zn, Pb, TE-AA62 for Te, and S-IR08 for S. If over-limits were exhibited in the AU-AA26 package, they were assayed again using the AU-GRA22 package. If over-limits were exhibited in the AG-AA46 package, they were assayed again using the AG-GRA22 package. All samples started the analytical processing in the trace element package (ME-MS41) which comprises an ultra-trace level detection method using ICP-MS and ICP-AES using sample decomposition in aqua regia digestion, where 0.50 g of sample is digested with aqua regia in a graphite heating block. After cooling, the resulting solution is diluted with de-ionised water, mixed, and analysed by ICP-AES. The elements and the detection limits are shown in Table 11.3 (Minesa, 2016).
Table 11.2: Sample Analytical Methods For 2016 Drilling
| Method | Frequency | Element | Unit | Lower Limit |
Upper Limit |
Details | ||||||||||
| AU-AA26 |
Every lot | Au | ppm | 0.010 | 100 | Fire assay: 50g and AAS finish | ||||||||||
| AU-GRA22 |
If result is over limit | Au | ppm | 0.050 | 1,000 | Fire assay: 50g and gravimetric finish | ||||||||||
| ME-MS41 |
Every lot | Aqua Regia digestion 0.5g, ICP-MS: analytical range in next table |
||||||||||||||
| AG-AA46 |
If result is over limit | Ag | ppm | 1.000 | 1,500 | Aqua Regia digestion 0.4g and AAS finish | ||||||||||
| AG-GRA22 |
If result is over limit | Ag | ppm | 5.000 | 10,000 | Fire assay: 50g and gravimetric finish | ||||||||||
| CD-AA46 |
If result is over limit | Cd | % | 0.000 | 10 | Aqua Regia digestion 0.4g and AAS finish | ||||||||||
| CU-AA46 |
If result is over limit | Cu | % | 0.001 | 40 | Aqua Regia digestion 0.4g and AAS finish | ||||||||||
| MN-AA46 |
If result is over limit | Mn | % | 0.010 | 50 | Aqua Regia digestion 0.4g and AAS finish | ||||||||||
| PB-AA46 |
If result is over limit | Pb | % | 0.001 | 30 | Aqua Regia digestion 0.4g and AAS finish | ||||||||||
| TE-AA62 |
If result is over limit | Te | % | 0.010 | 100 | Four Acid digestion, 0.1g to 3.0g and AAS finish | ||||||||||
| ZN-AA46 |
If result is over limit | Zn | % | 0.001 | 60 | Aqua Regia digestion 0.4g and AAS finish | ||||||||||
| S-IR08 |
If result is over limit | S | % | 0.010 | 50 | Leco, Infrared spectroscopy, 0.05g to 0.6g |
All samples processed using ME-MS41 were also processed using the AU-AA26 packages. In the AU-AA26 package, a prepared sample of 50 g is fused with a mixture of lead oxide, sodium carbonate, borax, silica, and other reagents as required, inquarted with 6 mg of gold-free silver and then cupelled to yield a precious metal bead. The bead is digested in 0.5 ml dilute nitric acid in a microwave oven, 0.5 ml concentrated hydrochloric acid is then added, and the bead is further digested in the microwave at a lower power setting.
| Effective Date January 1, 2021 | Aris Gold | |||
| Page 116 of 384 |
| SRK Consulting | Soto Norte NI 43-101 – Feasibility Study |
The digested solution is cooled, diluted to a total volume of 10 ml with de-mineralised water, and analysed by atomic absorption spectroscopy against matrix-matched standards.
In the AG-AA46 package, a prepared sample of 0.4 g is digested with concentrated nitric acid for 90 minutes in a graphite heating block. The resulting solution is diluted with concentrated hydrochloric acid before cooling to room temperature. The samples are diluted in a volumetric flask (100 or 250 ml) with demineralised water and analysed using Atomic Absorption Spectroscopy (“AAS”).
Over-limits of the ME-MS41 package for Ag, Cd, Cu, As, Mn, and Zn were processed using ME-AA46, where a prepared sample of 0.4 g is digested with concentrated nitric acid for 90 minutes in a graphite heating block. The resulting solution is diluted with concentrated hydrochloric acid before cooling to room temperature. The samples are diluted in a volumetric flask (100 or 250 ml) with demineralised water and analysed using AAS.
Over-limits of the ME-MS41 package for Te were processed using ME-AA62, where the sample is digested in a mixture of nitric, hydrochloric, perchloric, and hydrofluoric acids. The sample weight taken depends on the estimated concentration and absorbance of the analyte (range 0.1 to 3.00 g). Perchloric acid is added to assist oxidation of the sample and to reduce the possibility of mechanical loss of sample as the solution is evaporated to moist salts. The analyte is determined by AAS.
Over-limits of the ME-MS41 package for S were processed using S-IR08, where the sample is analysed for Total Sulphur using a Leco sulphur analyser. The sample (0.01 to 0.1 g) is heated to approximately 1,350°C in an induction furnace while passing a stream of oxygen through the sample. Sulphur dioxide released from the sample is measured by an Infrared (“IR”) detection system and the Total Sulphur result is provided.
Over-limits of the AU-AA26 and AG-AA46 packages were processed using the AU-GRA22 and AG-GRA22 packages, where a prepared sample of 50 g is fused with a mixture of lead oxide, sodium carbonate, borax, silica, and other reagents to produce a lead button. The lead button containing the precious metals is cupelled to remove the lead. The remaining gold and silver bead are parted in dilute nitric acid, annealed, and weighed as gold. Silver is then determined by the difference in weights.
Table 11.3: ALS Chemex ICP-AES Detection Limits
|
Element |
Unit |
Lower Limit |
Upper Limit |
Element |
Unit |
Lower Limit |
Upper Limit |
|||||||||||
| Ag | ppm | 0.01 | 100 | Mo | ppm | 0.05 | 10,000 | |||||||||||
| Al | % | 0.01 | 25 | Na | % | 0.01 | 10 | |||||||||||
| As | ppm | 0.1 | 10,000 | Nb | ppm | 0.05 | 500 | |||||||||||
| Au | ppm | 0.2 | 25 | Ni | ppm | 0.2 | 10,000 | |||||||||||
| B | ppm | 10 | 10,000 | P | ppm | 10 | 10,000 | |||||||||||
| Ba | ppm | 10 | 10,000 | Pb | ppm | 0.2 | 10,000 | |||||||||||
| Be | ppm | 0.05 | 1,000 | Rb | ppm | 0.1 | 10,000 | |||||||||||
| Bi | ppm | 0.01 | 10,000 | Re | ppm | 0.001 | 50 | |||||||||||
| Ca | % | 0.01 | 25 | S | % | 0.01 | 10 | |||||||||||
| Cd | ppm | 0.01 | 1,000 | Sb | ppm | 0.05 | 10,000 | |||||||||||
| Ce | ppm | 0.02 | 500 | Sc | ppm | 0.01 | 10,000 | |||||||||||
| Co | ppm | 0.1 | 10,000 | Se | ppm | 0.2 | 10,000 | |||||||||||
| Cr | ppm | 1 | 10,000 | Sn | ppm | 0.2 | 500 | |||||||||||
| Cs | ppm | 0.05 | 500 | Sr | ppm | 0.2 | 10,000 | |||||||||||
| Cu | ppm | 0.2 | 10,000 | Ta | ppm | 0.01 | 500 | |||||||||||
| Fe | % | 0.1 | 50 | Te | ppm | 0.01 | 500 |
| Effective Date January 1, 2021 | Aris Gold | |||
| Page 117 of 384 |
| SRK Consulting | Soto Norte NI 43-101 – Feasibility Study |
| Element | Unit | Lower Limit | Upper Limit | Element | Unit | Lower Limit | Upper Limit | |||||||
| Ga | ppm | 0.05 | 10,000 | Th | ppm | 0.2 | 10,000 | |||||||
| Ge | ppm | 0.05 | 500 | Ti | % | 0.005 | 10 | |||||||
| Hf | ppm | 0.05 | 500 | Tl | ppm | 0.02 | 10,000 | |||||||
| Hg | ppm | 0.01 | 10,000 | U | ppm | 0.05 | 10,000 | |||||||
| In | ppm | 0.005 | 500 | V | ppm | 1 | 10,000 | |||||||
| K | % | 0.01 | 10 | W | ppm | 0.05 | 10,000 | |||||||
| La | ppm | 0.2 | 10,000 | Y | ppm | 0.05 | 500 | |||||||
| Li | ppm | 0.1 | 10,000 | Zn | ppm | 2 | 10,000 | |||||||
| Mg | % | 0.01 | 25 | Zr | ppm | 0.5 | 500 | |||||||
| Mn | ppm | 5 | 50,000 | |||||||||||
Core Storage
When Minesa took ownership of the Project in 2015, all past cores drilled were found on site, but the storage facilities and condition of the cores and boxes required attention.
The most difficult problem inherited comprised the subsidence of the floor in the Padilla core shed. This core shed has a capacity of some 400,000 m of core. For safety reasons, a decision was made to take out all the core at the end of 2015 and store the core within the residential buildings at Padilla.
This work was completed towards the end of 2016, with excess core having to be stacked outside. Those stacked outside were wrapped in plastic and netting to protect them from the weather. During the process, all core boxes removed were identified and barcode ID stickers added to the ends of the boxes and replacing the old black marker ID. Replacing the written information with barcodes will aid in the logistics of placing the core back into the Padilla core shed once it is repaired or replaced. Each core box bar code consists of borehole number and core box number.
Core at the Llano Redondo site is stored in four separate core sheds and two old agricultural buildings. The Galway Resources cores (84,630.81 m) are kept in five of these areas and the sixth houses the Calvista cores (19,083.06 m).
While deterioration of drill cores has mostly been arrested, Minesa recognises that, as a long-term solution, repairing the old core shed and building an extension or new core storage facility is required at Padilla to house all cores.
Sample Reject Material and Pump Sample Storage
When Minesa took ownership of the Project in 2015, the Bucaramanga store was found to house all the Soto Norte assay pulp duplicates (shelved and filed in order) and approximately 360,000 coarse crushed samples randomly stacked.
A decision was made to store the assay pulp duplicates onsite with the Calvista warehouse converted for this purpose. All sample pulps are now stored in order according to borehole ID number, with the start and finish of each lot of samples by borehole clearly identified. Before storing the pulp boxes, all pulps were revised and recorded to make sure the inventory matched the box contents. Where deviations were noted, these were recorded.
Removal of the pulps from the Bucaramanga warehouse enabled the sample reject material (coarse duplicates) to be re-organised. This work started during the third quarter of 2015 when waste samples were
| Effective Date January 1, 2021 | Aris Gold | |||
| Page 118 of 384 |
| SRK Consulting | Soto Norte NI 43-101 – Feasibility Study |
sorted from mineralised samples. The samples were sorted by borehole and placed in sequence within bulk bags, allowing for quick identification. During the sorting process, new barcodes were put on all bags and any damaged bags were replaced. This work was completed in the third quarter of 2016 and all mineralised samples are now temporarily stored in the former residential units at Padilla. When the Padilla core shed is either rehabilitated or newly constructed, the mineralised coarse reject samples will be stored in this new core storage unit.
Storage facilities for Galway and Calvista assay pulps and coarse duplicates at Llano Redondo have been cleaned and partially re-organised. This task comprises part of the on-going work program.
Procedures used in the Logging, Sampling, Sample Preparation, Analyses and Security Process
To improve on the quality of geological modelling and Resource estimation, and bring more consistency into geological work processes, the Minesa Geological Department introduced procedures for the activities carried out on site as listed in Table 11.4 (Minesa, 2016).
Table 11.4: Summary of Core Logging and Sampling Procedures
|
Activity
|
Description
| |
| 01. Drillcore Logging |
01.01. Reception and Receipt of Core Boxes | |
| 01.02. Organizing Core and Core Recovery Determination | ||
| 01.03.01. Core Logging - Geology and Geomechanics | ||
| 01.03.02. Core Logging Manual - Geology and Geomechanics | ||
| 01.04. Core Photos - 1 (After Core is Organised), and 2 (After Core is Sampled) | ||
| 01.05. Density Determination | ||
| 01.06. PLT Determination | ||
| 01.07. Marking Sample Intervals | ||
| 01.08. Cutting Core | ||
| 01.09. Sampling Core & QC Insertions | ||
| 01.10. Sending Samples to On-Site Sample Preparation Laboratory | ||
|
02. Preparing and Inserting Pulp |
02. 01. Preparing and Inserting Pulp Blanks & Control Samples | |
|
03. Transporting Samples to ALS for Assay |
03.01. Transporting Samples to ALS for Assay | |
|
04. Storing Cores, etc. |
04.01. Assembling Storage Racks | |
| 04.02. Reception of Core Boxes in the Core Store | ||
| 04.03. Loading & Unloading Core Boxes from the Racking System | ||
| 04.04. Organizing Pulps and Coarse Sample Rejects | ||
| 04.05. Temporary Storage of Drillcores | ||
|
05. Sampling |
05.01. Soil sampling | |
| 05.02. Surface Sampling | ||
| 05.03. Sampling Old Mine Workings | ||
| 05.04. Geological Mapping | ||
|
06. Archive |
06.01. Archiving | |
|
07. Hydrogeology and Geomechanics |
07.01. Construsuelos, IP06-27 - SPT borehole | |
| 07.02. Construsuelos, IP06-45 - Lefranc test | ||
| 07.03. Construsuelos, IP06-48 - Standpipe piezometer installation | ||
| 07.04. Construsuelos, IP06-56 - Excavation, mapping and sampling of test pits | ||
| 07.05. Construsuelos, IP06-57 - Seismic survey | ||
| 07.06. SRK, Vibrating wire piezometer installation |
| Effective Date January 1, 2021 | Aris Gold | |||
| Page 119 of 384 |
| SRK Consulting | Soto Norte NI 43-101 – Feasibility Study |
|
Activity |
Description | |
|
07.07. Minesa, Flow accretion survey | ||
|
07.08. ERM, Water sampling for isotopic analysis | ||
|
07.09. Minesa, Groundwater level data recording in vibrating wire piezometers |
| 11.5 | QA/QC Review |
Quality assurance (“QA”) is the process implemented to measure and assure the quality of the assay results and quality control (“QC”) refers to the results of the control samples included with the primary samples. Minesa have outlined the QA/QC process that was implemented on site, and this is summarised below.
Minesa ran a rigorous QA/QC system throughout the different drilling campaigns to assess and ensure the validity, accuracy and reliability of exploration data. The system includes written protocols for drilling, surveying, sampling and assaying, data management and database integrity. Analytical control measures include the use of certified reference materials (CRMs), blanks, coarse, pulp and field duplicates.
In 2015, Minesa engaged Geoexmin to undertake an audit and revision on the available QC data, sample preparation laboratory, and procedures. The work was carried out by Dr Armando Simón, P. Geo., acting as QP, and was split in two groups: historical data from 2006-2013, and 2016 exploration data (Geoexmin, 2016). Dr Simón’s opinion regarding QA/QC, sample preparation, and internal procedures from Minesa’s Geology Department and the Soto Norte Project was summarised as:
| ● | The external control and assay results from the Project show low bias and dispersion within the reasonable threshold, therefore, the data come from good analytic accuracy and precision. |
| ● | The QC protocol for sample preparation during 2016 exploration campaign is considered adequate for the mineral species in the deposit. Geoexmin requested ALS laboratory to implement a couple of modifications to enhance the analytical precision: to increase the sub-sample weight to 0.5 kg (prior to grinding) and to increase the fire assay mark to 50 g. |
| ● | All available data from historical and Minesa’s exploration campaigns are considered adequate for a Mineral Resource estimate under industry standards and best practices. |
SRK reviewed the reports in conjunction with site inspection and independent review of the available data and in the QP’s opinion agrees with the conclusions.
The following sub-sections describe the QA/QC protocols and internal procedures followed during the historical and Minesa’s exploration campaigns.
| 11.6 | Procedures |
The following sub-sections describe the QA/QC protocols and internal procedures followed during the historical and Minesa’s exploration campaigns.
| 11.6.1 | QA/QC Program 2006 – 2013 |
The Minesa Geology Department checked the historical assay data prior to using it in the development of the mineral resource and reserve estimates.
Previous technical work by the previous explorers indicate that due diligence was carried out during the earlier stages of exploration, although the QA/QC protocol did not meet mining industry standard insertion rates for blanks, duplicates, standards, etc. (Table 11.5).
| Effective Date January 1, 2021 | Aris Gold | |||
| Page 120 of 384 |
| SRK Consulting | Soto Norte NI 43-101 – Feasibility Study |
Given the size and importance of the Soto Norte Project, the Minesa Geology Department recommended an audit of Minesa’s inherited database, and the QA/QC and geological procedures implemented previously by Ventana and AUX. This included a review of the protocols, procedures and geological processes that were being prepared for the 2016 infill drilling program.
Table 11.5: Annual QA/QC Insertion Rates 2010 – 2013
|
Sample Category |
QA/QC Control |
% Insertion Rate |
Annual QA/QC Insertion Rates (2010 – 2013) | |||||||||||||||||||
| 2010 | 2011 | 2012 | 2013 | |||||||||||||||||||
| No. | % | No. | % | No. | % | No. | % | |||||||||||||||
| Original Exploration Samples | 91,926 | 52,592 | 84,076 | 11,281 | ||||||||||||||||||
| Twin Samples | Sample Precision | 2% | 601 | 0.7 | 408 | 0.8 | 303 | 0.4 | 76 | 0.7 | ||||||||||||
| Coarse Duplicates | Sample Precision | 2% | 0 | 0 | 0 | 0 | 0 | 0 | 0 | 0 | ||||||||||||
| Pulp Duplicates | Prep. Precision | 2% | 704 | 0.8 | 488 | 0.9 | 1,140 | 1.4 | 264 | 2.3 | ||||||||||||
| Coarse Blanks | Contamination | 2% | 702 | 0.8 | 610 | 1.2 | 2,251 | 2.7 | 461 | 4.1 | ||||||||||||
| Fine Blanks | Contamination | 2% | 0 | 0 | 0 | 0 | 0 | 0 | 0 | 0 | ||||||||||||
| Low Grade | Standard | 2% | 1,429 | 1.6 | 1,243 | 2.4 | 1,813 | 2.2 | 404 | 3.6 | ||||||||||||
| Medium Grade | Standard | 2% | 523 | 0.6 | 509 | 1 | 715 | 0.9 | 154 | 1.4 | ||||||||||||
| High Grade | Standard | 2% | 285 | 0.3 | 207 | 0.4 | 243 | 0.3 | 19 | 0.2 | ||||||||||||
| External Lab | Assay Precision | 4% | 1,088 | 1.2 | 1,518 | 2.9 | 3,148 | 3.7 | 0 | 0 | ||||||||||||
| Overall Insertion Rate | 20% | 5,332 | 5.8 | 4,983 | 9.5 | 9,613 | 11.4 | 1,378 | 12.2 | |||||||||||||
One of the concerns that Minesa had was that Table 11.6 shows that during the first years under Ventana, the overall insertion rate was 7.0% or less, and under AUX the insertion rate was improved to 9.5%, 11.4%, and 12.2% for the years 2011 to 2013, respectively, whereas the current recommended industry rate is in the order of 20% insertion. Also, there were no coarse duplicates or fine blanks inserted during the whole period 2006 to 2013, no twin samples inserted during the years 2006 to 2008, and no pulp duplicates inserted in the years 2007 to 2008. Furthermore, in the earliest years it is observed by Reeves (2006) that QC insertion was carried out by the analysing laboratory and was therefore not blind.
Geoexmin (2016) concluded from extensive review of the pre-2014 database that:
| ● | The error rate of twin samples and pulp duplicates of the exploration campaigns by Ventana, shown in Table 11.6 and by AUX, shown in Table 11.7 is, in general, within acceptable limits. In a few cases, measurements exceed the 10% limit of variation which was attributed to errors in database entries and corrections were applied accordingly. |
| ● | Some duplicate pairs failed, and it was indicated that this might be due to the presence of erratic coarse gold (>0.100 mm) typical of this type of deposit, although it was possible to discard the presence of appreciable quantities of coarse gold. Geoexmin therefore concluded that this would not have a significant impact on Mineral Resource estimation. |
| ● | Independent referee analyses indicated a low bias in the primary laboratory in comparison with the secondary laboratory as shown in Table 11.8, although silver values showed an elevated dispersion. |
| ● | The results of the insertion of reference materials (assay standards) show low bias and fall within acceptable limits (Table 11.9 and Table 11.10). In addition, the coefficient of variation of the values of the reference materials (assay standards) was considered acceptable, and this evidenced good analytical precision. |
In summary, and based on this revision, Geoexmin concluded from the data provided, “that the analytical data for Au, Cu, and Ag are sufficiently precise and accurate for use in the estimation of Mineral Resources”.
| Effective Date January 1, 2021 | Aris Gold | |||
| Page 121 of 384 |
| SRK Consulting | Soto Norte NI 43-101 – Feasibility Study |
Table 11.6: Ventana Twin and Pulp Duplicate Results 2006 – 2011
| Sample Type |
Element | No. Samples | Failed Pairs | % Error | ||||||
| Twin Samples (ALS Laboratories) |
Au | 900 | 35 | 3.90 | ||||||
| Ag | 900 | 16 | 1.80 | |||||||
| Cu | 900 | 96 | 10.70 | |||||||
| Pulp Duplicates (ALS Laboratories) |
Au | 1,092 | 89 | 8.20 | ||||||
| Ag | 1,092 | 35 | 3.20 | |||||||
| Cu | 1,092 | 106 | 9.70 | |||||||
| Pulp Duplicates (ACME Laboratories) |
Au | 56 | 9 | 16.10 | ||||||
| Ag | 56 | 0 | 0 | |||||||
| Cu | 56 | 0 | 0 |
Table 11.7: AUX Twin and Pulp Duplicate Results 2011 – 2013
| Sample Type | Element | No. Samples | Failed Pairs | % Error | ||||
| Twin Samples | Au | 667 | 22 | 3.30 | ||||
| Ag | 667 | 6 | 0.90 | |||||
| Cu | 667 | 73 | 10.90 | |||||
| Pulp Duplicates | Au | 1,721 | 144 | 8.40 | ||||
| Ag | 1,721 | 55 | 3.20 | |||||
| Cu | 1,721 | 103 | 6.00 |
Table 11.8: Laboratory Assay Comparisons 2011 – 2013
| ALS vs. ACME | R2 | Total No. | Pairs1 | Mean | Error (m) | B | Error (b) | Bias (%) | ||||||||||
| Au –AUX (ppm) | 0.913 | 4,302 | 4,179 | 0.92 | 0.004 | 0.184 | 0.345 | 8 | ||||||||||
| Ag –AUX (ppm) | 0.984 | 4,234 | 3,582 | 1.011 | 0.002 | 0.501 | 0.286 | -1.1 | ||||||||||
| Cu –AUX (ppm) | 0.997 | 4,302 | 4,302 | 0.997 | 0.001 | 3.149 | 12.65 | 0.3 |
1Numerous samples analysed in the external laboratory appear in the database with values of 10 ppm Au, 300 ppm Ag and 300 ppm CU, indicating detection limits. These are not included here.
Table 11.9: Standard Sample Accuracy Prior to 2014
| Standards | Mean Standard | Mean Assay | No. Samples | Bias (%) | CV (%) | |||||
| (g/t Au) | (g/t Au) | |||||||||
| GS-1C | 0.99 | 1.01 | 46 | 2.1 | 5.3 | |||||
| GS-3B | 3.47 | 3.522 | 49 | 1.5 | 3.8 | |||||
| GS-1F | 1.16 | 1.133 | 52 | -2,4 | 5 | |||||
| LB-1 | 1.947 | 1.96 | 3,001 | 0.7 | 5.4 | |||||
| LB-2 | 4.8 | 4.726 | 1,197 | -1,5 | 4.2 | |||||
| LB-3 | 10.09 | 9.994 | 413 | -0,9 | 3.8 |
Table 11.10: Standard Sample Accuracy and Bias prior to 2014
| Standards | LB1 – Low Grade | LB2 – Medium Grade | LB3 – High Grade | |||
| No. Results | 2,972 | 1,188 | 402 | |||
| Mean Value (g /t Au) | 1.96 | 4.721 | 10.027 | |||
| Final Bias | 0.60% | -1.60% | 0.30% |
| 11.6.2 Minesa Protocols | |
The QA/QC control insert rate during 2016 was improved to the insert rates shown in Table 11.11.
In the review of the 2016 QA/QC control applied by Minesa, Geoexmin (2016) made the following conclusions:
| ● | The QC implemented in the 2016 exploration campaign meets with the industry standards |
| ● | The protocols applied for core sampling, sample preparation and analysis were adequate for the type of mineral present in the Project. |
| Effective Date January 1, 2021 | Aris Gold | |||
| Page 122 of 384 |
| SRK Consulting | Soto Norte NI 43-101 – Feasibility Study |
The total error (“TE”) for Au, Ag, Cu, and Fe of the coarse and pulp duplicates, and Au and Fe for the twin samples kept within acceptable limits, however, the TE for Ag and Cu for the twin samples exceeds conventional limits (Table 11.12 and Figure 11.5). Nevertheless, in both cases, the Max-Min graphs showed a high concentration of failed samples within the low-grade zone, whereas those within the high-grade zone tend to be located close to the limit. In the case of Cu, it can be observed in the Max-Min graph that nearly all the failed pairs are found under the limit of 0.1% Cu. Similarly, for the failed pairs for Ag, it can be found that the majority are under the limit of 20 ppm.
The low sampling precision for Ag and Cu could be because Minesa has used the pyrite distribution as the principal guide to core cutting and considering that the gold mineralisation in the deposit is known to be predominantly linked to this mineral. The weak copper mineralisation 0.2% Cu on average), however, appears to be associated to a later event, whose orientation is variable and differs from the orientation of the gold mineralisation. Despite the high TE for Ag and Cu, Geoexmin considers that the impact on the estimation of Mineral Resources for these two elements is insignificant. Geoexmin made the following observations:
| ● | It is now possible to conclude that some failed pairs of the twin and coarse duplicate samples (Figure 11.6 and Figure 11.7 respectively) could have originated from the presence of gold particles with diameters in excess of 0.100 mm, a phenomenon commonly known as “coarse gold”, however, judging from the distribution from the failed Au samples in the pulp duplicates, Geoexmin has discarded the presence of appreciable quantities of coarse gold. |
| ● | The results of reference materials (standards) show low bias within acceptable limits (Table 11.13 and Figure 11.8). In addition, the values for the coefficient of variation of all the reference materials are acceptable, which confirms good analytical precision for Au, Ag, and Cu. |
| ● | The results of assay checks made with the external laboratory were within acceptable limits once outliers (between 4 and 12 results) were removed (Table 11.14, Table 11.15 and Figure 11.9). |
| ● | Geoexmin considers that during the 2016 campaign no significant Au, Ag, and Cu contamination occurred during the preparation of samples or during the analysis. |
| ● | In summary and based on the revision of data supplied, Geoexmin considers that the analytical data for Au, Ag, Cu, and Fe of the 2016 campaign is sufficiently precise and exact to be used in the estimation of mineral resources. |
| ● | Review of the ALS Chemex granulometric checks continually made during sample preparation, concluded that crushing and grinding performance was maintained above the specified levels of 70% and 85%, respectively. |
| ● | Geoexmin also checked and reported with reference to the protocols and procedures of the ALS Chemex on-site sample preparation laboratory (ALS, 2012) as well as the ALS Chemex protocols for their assay laboratory in Lima (ALS, 2006a) (ALS, 2006b) (ALS, 2009). |
Geoexmin refers to one of its own publications (2016) and a Minesa internal QA/QC report (Porras, 2016).
In addition to the QA/QC evaluation done by Geoexmin, SRK also did a review of the QA/QC data before producing the current MRE.
This data review is documented below in sub-section 12.3 (Verification by SRK).
| Effective Date January 1, 2021 | Aris Gold | |||
| Page 123 of 384 |
| SRK Consulting | Soto Norte NI 43-101 – Feasibility Study |
Table 11.11: QA/QC Sample Insertion Rate
|
Annual QA/QC Insertion Rates | ||||||||
|
Sample Category |
QA/QC Control | % Ins. Rate | 2016 | |||||
| No. | % | |||||||
|
Original Exploration Samples |
9,288 |
|||||||
|
Twin Samples |
Sampling precision |
2 |
48 |
0.52 | ||||
|
Coarse Duplicate |
Sub-sampling precision |
2 |
234 |
2.52 | ||||
|
Pulp Duplicate |
Analytical precision |
2 |
284 |
3.06 | ||||
|
Coarse Blanks |
Contamination during preparation |
2 |
170 |
1.83 | ||||
|
Fine Blanks |
Contamination during assaying |
2 |
200 |
2.15 | ||||
|
Low Grade |
Accuracy - Standard Reference Materials |
2 |
438 |
4.72 | ||||
|
Medium Grade |
Accuracy - Standard Reference Materials |
2 |
232 |
2.5 | ||||
|
High Grade |
Accuracy - Standard Reference Materials |
2 |
57 |
0.61 | ||||
|
External Lab |
Assay accuracy of the primary laboratory |
4 |
298 |
3.21 | ||||
|
Overall Insertion Rate |
1,961 |
21.11 | ||||||
Table 11.12: Twin and Duplicate Sampling Results
| Type of Sample | Element | Pairs | Failed Pairs | Errors (%) | ||||
| Twin Samples |
Au |
48 |
4 |
8.3 | ||||
|
Ag |
48 |
10 |
20.8 | |||||
|
Cu |
48 |
15 |
31.3 | |||||
|
Fe |
48 |
1 |
2.1 | |||||
| Coarse Duplicates |
Au |
234 |
5 |
2.1 | ||||
|
Ag |
234 |
8 |
3.4 | |||||
|
Cu |
234 |
2 |
0.9 | |||||
| Pulp Duplicates |
Fe |
234 |
0 |
0 | ||||
|
Au |
284 |
8 |
2.8 | |||||
|
Ag |
284 |
24 |
8.5 | |||||
|
Cu |
284 |
4 |
1.4 | |||||
|
Fe |
284 |
2 |
0.7 |
Table 11.13: Assay Standard Results
| Reference Material |
Element | Unit | MV | Mean | Samples | MFC |
MFC (%) |
Bias (%) |
CV (%) |
Global (%) | ||||||||||
| Standard_LB1 |
Au | ppm | 1.95 | 1.93 | 119 | 0 | 0 | -1.1 | 3 | -2.3 | ||||||||||
| OREAS 602 |
Au | ppm | 2 | 1.9 | 319 | 6 | 1.9 | -3.7 | 3.4 | |||||||||||
| Standard LB_2 |
Au | ppm | 4.8 | 4.7 | 67 | 0 | 0 | -3 | 2.5 | |||||||||||
| OREAS 603 |
Au | ppm | 5.2 | 4.9 | 165 | 1 | 0.6 | -5.1 | 3.4 | |||||||||||
| OREAS 62e |
Au | ppm | 9.1 | 8.9 | 57 | 1 | 1.8 | -2.8 | 3.3 | |||||||||||
| OREAS 62e |
Ag | ppm | 9.9 | 9.7 | 57 | 2 | 3.5 | -1.8 | 2.7 | 1.5 | ||||||||||
| OREAS 602 |
Ag | ppm | 115 | 116 | 260 | 5 | 1.9 | 1.2 | 2.7 | |||||||||||
| OREAS 603 |
Ag | ppm | 284 | 288 | 140 | 3 | 2.1 | 1.4 | 1.9 | |||||||||||
| OREAS 602 |
Cu | ppm | 5,150 | 5,277 | 318 | 3 | 0.9 | 2.5 | 2.8 | -4.3 | ||||||||||
| OREAS 603 |
Cu | ppm | 10,029.6 | 9,944.7 | 165 | 2 | 1.2 | -0.8 | 1.7 |
Table 11.14: External Laboratory Assay Check Results
| Element | R2 | Total No. | Pairs | Mean | Error (m) | b | Error (b) | Bias (%) | ||||||||
|
Au (ppm) |
0.976 | 298 | 298 | 1.137 | 0.01 | -0.217 | 0.312 | -13.7 | ||||||||
|
Ag (ppm) |
0.824 | 298 | 298 | 1.094 | 0.027 | 0.164 | 15.857 | -9.4 |
| Effective Date January 1, 2021 | Aris Gold | |||
| Page 124 of 384 |
| SRK Consulting | Soto Norte NI 43-101 – Feasibility Study |
| Element | R2 | Total No. | Pairs | Mean | Error (m) | b | Error (b) | Bias (%) | ||||||||
|
Cu (ppm) |
0.354 | 298 | 298 | 0.619 | 0.029 | 190.981 | 213.049 | 38.1 | ||||||||
|
Fe (%) |
0.922 | 298 | 298 | 0.914 | 0.015 | 0.299 | 0.083 | 8.6 |
Table 11.15: External Laboratory Assay Check Results
| Element | R2 | No. Accepted |
Outliers | Outliers (%) |
Mean | Error (m) | b | Error (b) | Bias (%) | |||||||||
| Au (ppm) |
0.992 | 286 | 12 | 4.20 | 1.052 | 0.006 | -0.084 | 0.079 | -5.20 | |||||||||
| Ag (ppm) |
0.999 | 294 | 4 | 1.40 | 0.967 | 0.002 | 0.033 | 1.036 | 3.30 | |||||||||
| Cu (ppm) |
0.996 | 294 | 4 | 1.40 | 0.994 | 0.004 | -3.839 | 15.394 | 0.60 | |||||||||
| Fe (%) |
0.969 | 291 | 7 | 2.40 | 1.019 | 0.01 | -0.04 | 0.042 | -1.90 |
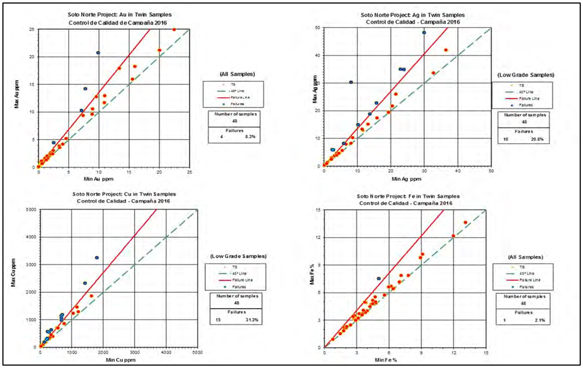
Figure 11.5: Twin Sample Results
| Effective Date January 1, 2021 | Aris Gold | |||
| Page 125 of 384 |
| SRK Consulting | Soto Norte NI 43-101 – Feasibility Study |
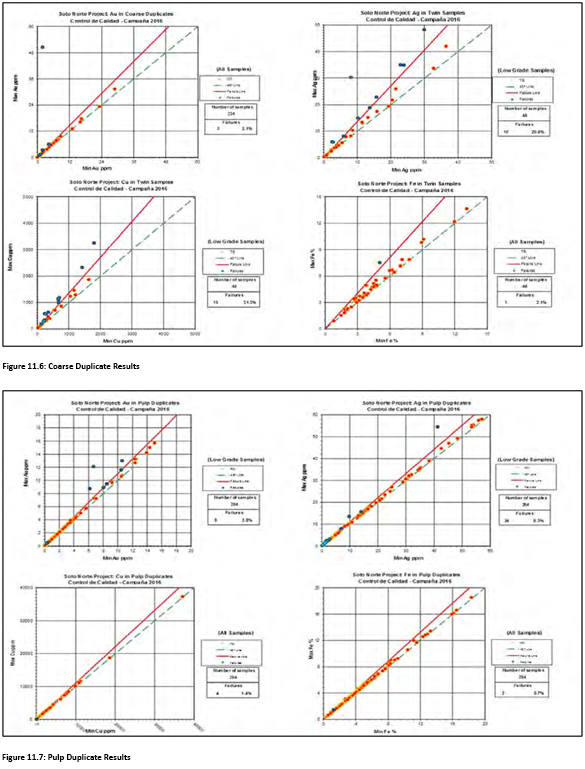
| Effective Date January 1, 2021 | Aris Gold | |||
| Page 126 of 384 |
| SRK Consulting | Soto Norte NI 43-101 – Feasibility Study |
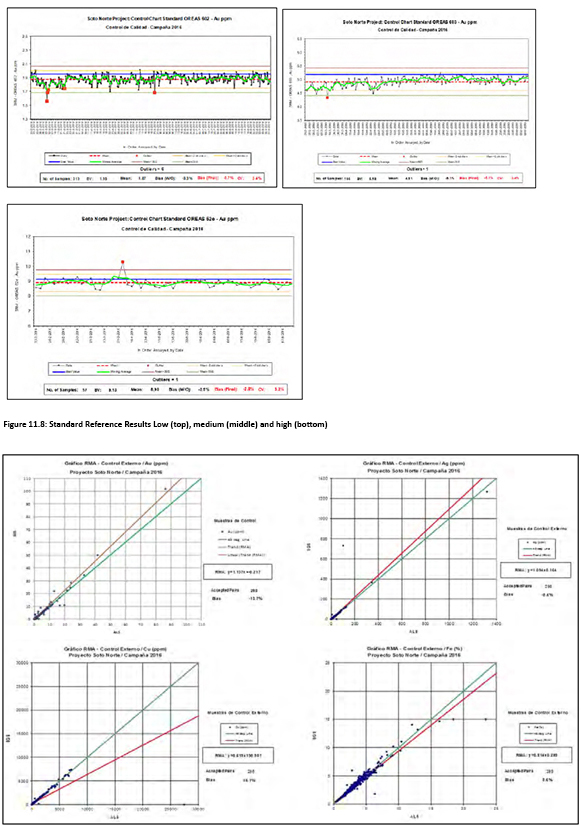
| Effective Date January 1, 2021 | Aris Gold | |||
| Page 127 of 384 |
| SRK Consulting | Soto Norte NI 43-101 – Feasibility Study |
| 11.6.3 | Certified Reference Material |
Certified reference material (“CRM”) samples (standards) were inserted into the sample stream to ensure assay accuracy. Three commercial standards, prepared by Ore Research and Exploration, were used: one high grade standard (OREAS 62e, Au and Ag only (Figure 11.10), one mid-grade standard (OREAS 603) (Figure 11.11), and one low grade standard (OREAS 602) (Figure 11.12). Of the 1,961 total QA/QC samples that have been submitted to the laboratory, 727 (37%) were CRM.
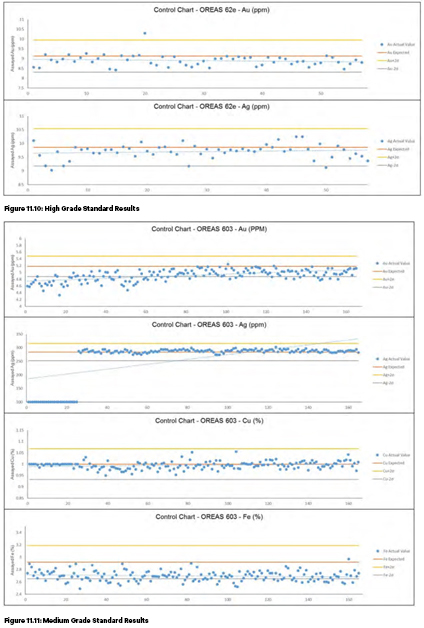
| Effective Date January 1, 2021 | Aris Gold | |||
| Page 128 of 384 |
| SRK Consulting | Soto Norte NI 43-101 – Feasibility Study |
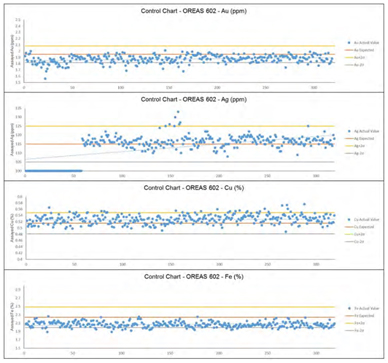
Figure 11.12: Low Grade Standard Results
| 11.6.4 | Blanks |
Blank samples obtained from barren rock was sourced away from known mineralisation and sampled and assayed to confirm its suitability for use as barren material. Coarse blanks are inserted into high grade zones to ensure that there is no contamination of equipment during the sample preparation process. Of the 1,961 total QA/QC samples submitted to the laboratory at Soto Norte, 370 (19%) samples were blanks comprising 170 fine blanks and 200 coarse blanks (Figure 11.13).
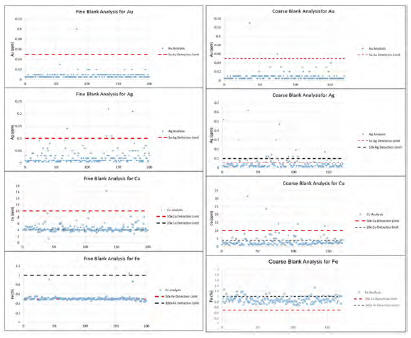
Figure 11.13: Fine (left) and Coarse (right) Blank Results
| Effective Date January 1, 2021 | Aris Gold | |||
| Page 129 of 384 |
| SRK Consulting | Soto Norte NI 43-101 – Feasibility Study |
| 11.6.5 | Duplicates |
Duplicate samples have been inserted into the sample stream to test the precision of the laboratory. Of the 1,961 QA/QC samples inserted at Soto Norte, 864 were duplicates (44%). Duplicates were split into four categories for analysis: pulp duplicates (“PD”) and check samples (“CS”) (Figure 11.14), and coarse duplicates (“CD”) and CS (Figure 11.15). Based on independent analyses, SRK comments that, in general, there is little evidence of any significant bias between the original and duplicate assays for all elements, but that the results of gold and iron display the most variability. SRK highlights that analyses of third-party duplicates suggest that these are the least reproducible for all elements and that in the case of the third-party duplicates, relatively low precision does not appear to be a function of grade.
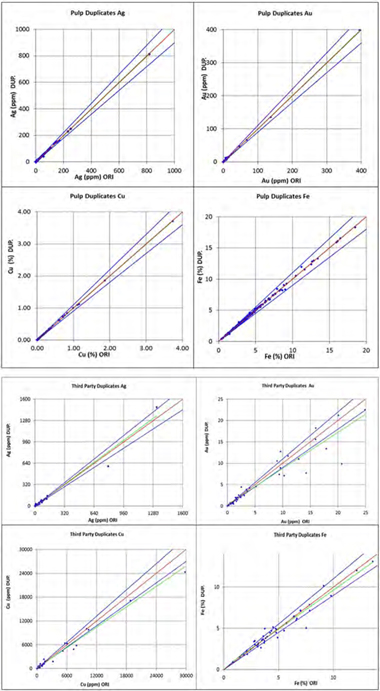
Figure 11.14: Pulp Duplicate Results by Original (top) and Check (bottom) Laboratories
| Effective Date January 1, 2021 | Aris Gold | |||
| Page 130 of 384 |
| SRK Consulting | Soto Norte NI 43-101 – Feasibility Study |
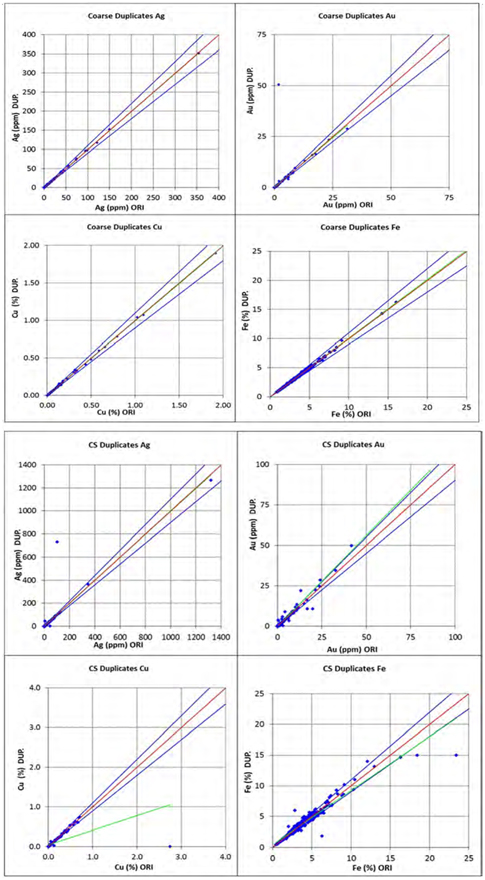
Figure 11.15: Coarse Duplicate Results by Original (top) and Check (bottom) Laboratories
| Effective Date January 1, 2021 | Aris Gold | |||
| Page 131 of 384 |
| SRK Consulting | Soto Norte NI 43-101 – Feasibility Study |
| 11.6.6 | Database Management |
PostgreSQL is an object-relational database management system (“ORDBMS”) with an emphasis on extensibility and on standards-compliance. The Project has used PostgreSQL since it was purchased by AUX, and Minesa made significant updates to the software during 2015 and 2016.
In Minesa, PostgreSQL is used for the storage of geological data and linking of the stored geological data to software applications such as GEMS, Vulcan, ArcGIS, Downhole Explorer, Leapfrog and others.
| 11.6.7 | Core Logs |
Pre-2012 digital core logging data from paper logs were entered into Microsoft Excel spreadsheets, which was then converted into a graphic log (for example, Figure 11.16) using the lithology and limited alteration data as well as the core recovery, RQD and assay data. There was a lapse of time before assay results were returned from the assaying laboratory via the ALS Chemex LIMS before the final logs could be generated.
In 2016, with the change in the logging protocol, all logging data went directly to the PostgreSQL Database. This data mostly arrived pre-verified due to the controls written into the logging software. Only minor verification was required to make sure anything written into the description did not contradict information within the tables verified by the software.
The assay data for each assay lot was sent by ALS Chemex to Minesa via LIMS as a final certificate in Excel format. The PostgreSQL software was programmed to recognise and download automatically once uploaded to the SQL software. Survey data from field collar positions, gyro downhole surveys, and downhole geophysical surveys were downloaded by the SQL database in a similar manner to the assay data (preformatted Excel or CSV files).
The SQL database is linked to Downhole Explorer and produces core logs of a predetermined format every time the SQL database is updated with new information. The predetermined format is designed to plot logs using data from the historical and new data sets. The historical and new data sets were aligned in the 2016 reprograming of the PostgreSQL database. Some datasets that did not exist in the historical logging were retrieved through a relogging program carried out during 2016. An example of the logs produced by the new logging system is shown in Figure 11.16 (Minesa, 2016), however, this only shows the most important data. A range of other data can be plotted by changing the format of the log when and if required. This can include plotting downhole geophysical logging data and many more datasets.
| Effective Date January 1, 2021 | Aris Gold | |||
| Page 132 of 384 |
| SRK Consulting | Soto Norte NI 43-101 – Feasibility Study |
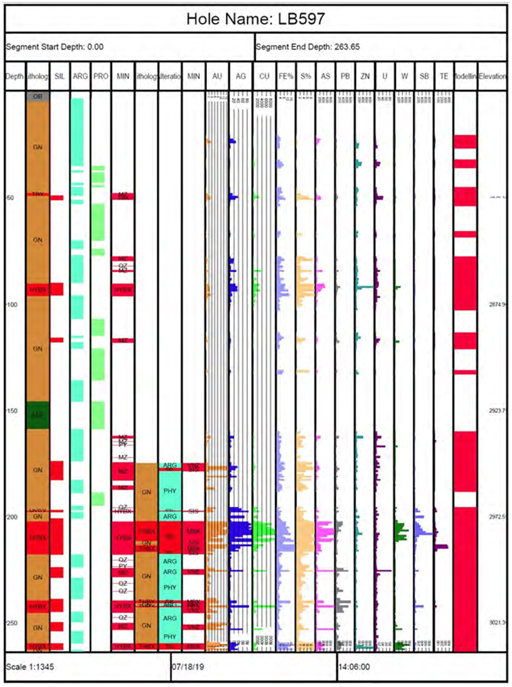
Figure 11.16: Drill Core Graphical Log Example
| 11.7 | Conclusions and Recommendations |
It is the QP’s opinion that the sample preparation, analytical procedures and sample security are adequate for use in the Mineral Resource Estimate. Sufficient work has been completed by Minesa to ensure the quality in the assays and both resampling and relogging of historical material has been completed where required to ensure the database is consistent. SRK is satisfied with the quality of the sample preparation and laboratories used for the current program and based on the quality control investigations there is no evidence of significant bias within the current database which would materially impact on the estimate.
| Effective Date January 1, 2021 | Aris Gold | |||
| Page 133 of 384 |
| SRK Consulting | Soto Norte NI 43-101 – Feasibility Study |
| 12 | DATA VERIFICATION |
| 12.1 | Introduction |
Sampling, sample preparation and assaying comprises the single most important data acquisition activities in any exploration or mining company. Sampling and assaying determine the value (or lack thereof) of a company’s exploration efforts. Since this is the most important part of exploration, it is important to verify the quality and assure the accuracy of results obtained from those samples.
| 12.2 | Verification by the Company |
The Company has implemented a series of routine verifications to ensure the collection of reliable exploration data. All work was conducted by appropriately qualified personnel under the supervision of qualified geologists. In the opinion of SRK, who have reviewed these verifications, the field exploration procedures used at Soto Norte generally meet best industry practices.
| 12.3 | Verification by SRK |
To verify the data incorporated within the 2016 drill program, SRK has:
| ● | Completed a check of the digital drilling database against the diamond drill core to confirm both geological and assay values show a reasonable representation of the Project |
| ● | Completed two site visits during February and August 2016 to review onsite drilling and sampling procedures and work with the geological team to develop the geological model |
| ● | Verified a portion of the digital database against historical data |
| ● | Verified the quality of geological and sampling information and developed an interpretation of gold grade distributions appropriate to use in the Resource model |
| ● | Reviewed the QA/QC database as provided for the 2016 drill program. |
SRK is satisfied with the quality of the laboratories used for the 2016/2017 program and based on the quality control investigations, there is no evidence of significant bias within the current database which would materially impact on the estimate. Based on the validation work completed by SRK, the database has been accepted as provided by the Minesa database administrator.
| 12.3.1 | Site Visit |
SRK visited the Soto Norte Project in February and August 2016. The main purpose of the site visit was to:
| ● | Ascertain the geological and geographical setting of the Soto Norte deposit |
| ● | Witness the extent of the exploration work completed to date including: |
| ○ | Inspect the drilling rig(s) |
| ○ | Verification of selected sample locations |
| ○ | Inspect core logging and sample storage facilities |
| ● | Review the sample preparation methodology |
| ● | Discuss geological interpretation and inspect drill core |
| Effective Date January 1, 2021 | Aris Gold | |||
| Page 134 of 384 |
| SRK Consulting | Soto Norte NI 43-101 – Feasibility Study |
| ● | Assess logistical aspects and other practicalities relating to the exploration property |
| ● | Visit the sample preparation laboratory and discuss quality issues. |
SRK was given full access to relevant data and conducted interviews with personnel to obtain information on the past exploration work, to understand procedures used to collect, record, store and analyse historical and current exploration data. SRK was able to verify the quality of geological and sampling information and develop an interpretation of gold grade distributions appropriate to use in the Mineral Resource model.
A basic review of the electronic database against several drillhole intersections was completed.
| 12.3.2 | Sample Database |
SRK completed a phase of data validation on the digital sample database supplied by Minesa, which included but was not limited to the following:
| ● | Search for sample overlaps or significant gaps in the interval tables, duplicate samples, errors in the length field, anomalous assay, and survey results. The Minesa database manager was notified of any issues that required correction or further investigation. No material issues were noted in the final sample database. |
| ● | Search for absent assay values within the mineralised zones. SRK has treated these absent values on a case-by-case basis and, where sufficiently supported by surrounding mineralised samples and adjacent drilling, ignored core loss during the composite process. While there may be a degree of subjectivity on the treatment of absent sample data, SRK notes that the absent samples comprise less than 0.5% of the sampling within the mineralised zones. |
In summary, SRK has accepted the sample database as provided by Minesa and concludes that the data is sufficiently reliable to support Mineral Resource estimation.
| 12.4 | Qualified Person’s Opinion |
It is the QP’s opinion the well-documented working practices of the Minesa, coupled with the QA/QC work undertaken and reviewed by SRK, demonstrate that the Project has been developed in a professional manner using an industry standard approach to Mineral Resource definition.
SRK has reviewed the data collection methodologies during the site visit and has undertaken an extensive review of the assay and geology database during the Mineral Resource estimation procedure and noted no material issues in the final database.
Assessment of the available QA/QC data indicates that the majority assay data for the drilling and sampling to date is appropriately accurate and precise for use in Mineral Resource Estimation. Based on the validation work completed by SRK, the database has been accepted as provided by the Minesa Database Administrator. It is the QP’s opinion that the data provided are adequate for estimation of Mineral Resources.
SRK is of the opinion that the exploration and assay data is sufficiently reliable to support evaluation and classification of Mineral Resources and Mineral Reserves in accordance with generally accepted CIM Estimation of Mineral Resources and Reserves: Definitions and Guidelines (CIM, 2014).
Independent sampling was not conducted because duplicate samples have been sent to umpire laboratories and metallurgical testwork samples have also been assayed, which provides external
| Effective Date January 1, 2021 | Aris Gold | |||
| Page 135 of 384 |
| SRK Consulting | Soto Norte NI 43-101 – Feasibility Study |
corroboration of the grades encountered at the Project. The resource drill-out stage is less about discovery and more about ensuring that high standards of work are being maintained in the face of challenges associated with remote operating logistics it is the QP’s opinion this has been completed to a satisfactory level.
| Effective Date January 1, 2021 | Aris Gold | |||
| Page 136 of 384 |
| SRK Consulting | Soto Norte NI 43-101 – Feasibility Study |
| 13 | MINERAL PROCESSING AND METALLURGICAL TESTING |
| 13.1 | Introduction |
Several metallurgical testwork programmes have been undertaken in support of the various phases of the Project’s development:
| ● | A Scoping Study undertaken by Ventana in 2010 (Samuel Engineering, 2010) proposed a flowsheet consisting of comminution, gravity separation, and flotation to produce separate copper and pyrite concentrates, intensive cyanide leaching of the gravity concentrate, cyanide leaching of the combined copper cleaner tailings and pyrite concentrate to recover copper and silver via sulphide precipitation and gold through an adsorption-desorption-recovery circuit. |
| ● | A Scoping Study undertaken by AUX in 2012 (AMEC, 2012) proposed a flowsheet consisting of comminution, gravity separation, and flotation to produce a bulk sulphide concentrate, with pressure oxidation of the concentrate followed by solvent extraction and electrowinning (“SX/EW”) to produce copper cathode, and cyanidation for gold recovery. |
| ● | The PFS undertaken by Minesa in 2017 (SNC, 2017). An initial trade-off study selected flotation as the preferred process route, due to capital cost and environmental advantages over flotation followed by pressure oxidation and cyanide leaching. Further trade-off studies directed the Project towards the elimination of the gravity separation stage, and the production of sequential copper and pyrite gold flotation concentrates. |
| ● | The testwork in 2018 and 2019 to support the current Feasibility Study undertaken by Minesa. Testwork was conducted to further refine and parameterise the flowsheet selected during the PFS, comprised of comminution and flotation to produce separate copper and pyrite concentrates, and validate the key metallurgical assumptions. A geometallurgical testwork program was undertaken to better assess variability within the deposit, and a ‘Marketing Composite’ was used to generate concentrate samples for potential offtakers. |
In the description that follows, only metallurgical testwork relevant to the current flowsheet (flotation of copper-gold and gold-pyrite concentrates) will be described.
| 13.2 | Ventana Scoping Study, 2010 |
| 13.2.1 | Samples |
Samples for this testwork program were taken from the Mascota mineralisation as it was known at the time. Five intervals of partially oxidised material and 16 intervals of sulphide material from 14 drillholes were selected based on a cut-off grade of 2.7 g/t Au. The sulphide intervals were used to make a master composite (“LM MC”), and five variability composites were prepared, one oxide sample and four sulphide samples of different gold to silver ratios.
As the initial master composite had a head grade significantly higher than the expected Mining Inventory average, two of the variability composites with lower grades were blended to form a new composite to represent the grades of an internal resource estimate for Mascota (“LM IRE”). Sample locations for all of the metallurgical testwork programs are shown on longitudinal sections of the main veins in Figure 13.1 (La Mascota) and Figure 13.2 (El Gigante).
| Effective Date January 1, 2021 | Aris Gold | |||
| Page 137 of 384 |
| SRK Consulting | Soto Norte NI 43-101 – Feasibility Study |
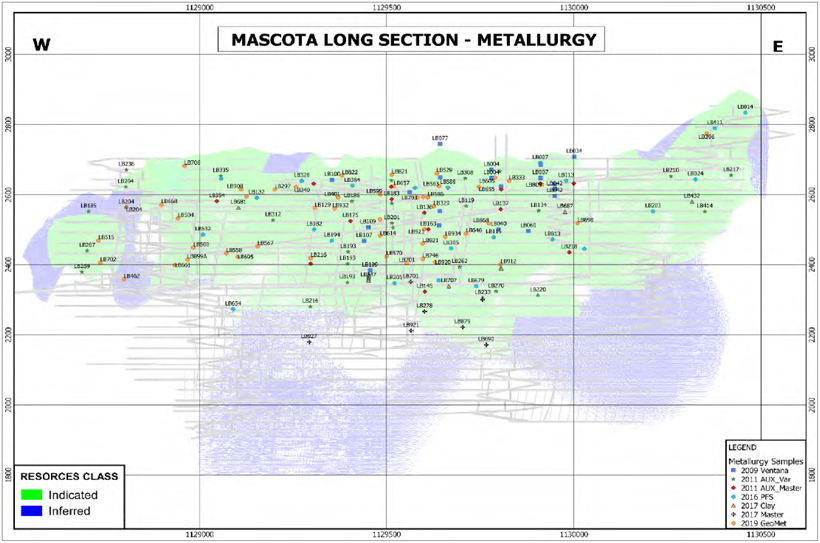
| Effective Date January 1, 2021 | Aris Gold | |||
| Page 138 of 384 |
| SRK Consulting | Soto Norte NI 43-101 – Feasibility Study |
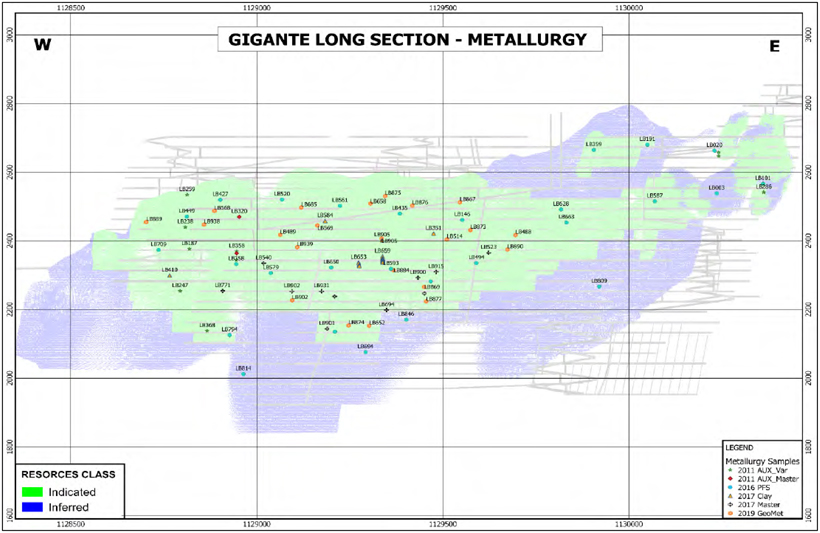
| Effective Date January 1, 2021 | Aris Gold | |||
| Page 139 of 384 |
| SRK Consulting | Soto Norte NI 43-101 – Feasibility Study |
| 13.2.2 | Head Assay and Mineralogy |
Assays for the two composite samples and five variability samples are shown in Table 13.1.
Table 13.1: 2011 Testwork Sample Head Assays
| Element | Unit | LM MC | LM IRE | Oxide | Hi Au Lo Ag |
Hi Au Hi Ag |
Lo Au Lo Ag |
Lo Au Hi Ag | ||||||||
| Au | g/t | 9.21 | 4.4 | 3.31 | 9.01 | 18.5 | 4.27 | 4.80 | ||||||||
| Cu | % | 0.29 | 0.16 | 0.27 | 0.15 | 0.76 | 0.05 | 0.35 | ||||||||
| Ag | g/t | 44.5 | 30.7 | 37.8 | 20.1 | 108 | 11.4 | 43.9 | ||||||||
| As | ppm | 130 | 34 | 300 | 63 | 470 | <40 | 130 | ||||||||
| Fe | % | 5.70 | 5.70 | 6.40 | 6.20 | 12.0 | 5.30 | 6.40 | ||||||||
| S | % | 7.51 | 5.66 | 6.62 | 6.00 | 13.8 | 4.42 | 6.89 | ||||||||
| Sb | ppm | 89 | 39 | 130 | 35 | 240 | <10 | 64 |
Gold is present as native gold and precious metal tellurides, primarily associated with pyrite, according to a mineralogical examination of the Master Composite. Electrum and silver-rich gold grains are preferentially associated with copper sulphides. The average size of the gold grains is 5 µm. The main copper minerals were bornite, chalcocite, chalcopyrite and Cu-As sulphides with minor amounts of covellite and very minor Cu-Bi sulphosalts.
| 13.2.3 | Comminution |
The Master Composite was tested for its comminution properties, summarised in Table 13.2.
Table 13.2: 2011 Master Composite Comminution Testwork Results
| Test
|
Unit | Result | Comparison to Database | |||
| SMC Test Drop Weight Index | kWh/m3 | 5.1 | medium | |||
| Bond Rod Mill Work Index | kWh/t | 12.8 | moderately soft | |||
| Bond Ball Mill Work Index | kWh/t | 15.2 | medium | |||
| Bond Abrasion Index | g | 0.55 | abrasive |
| 13.2.4 | Gravity Separation and Flotation |
Gravity separation tests on the Master Composite returned Au recoveries of between 22% and 36%. Ag recoveries were much lower (1 to 2%).
Batch rougher flotation tests were conducted investigating grind size, collector, pH, and flotation time. These tests initially targeted the production of a bulk sulphide concentrate, although some copper-selective tests were also undertaken. Batch cleaner tests aimed at producing a copper concentrate followed, these produced concentrates of up to 18% Cu, at a maximum Cu recovery of 63%. Cu recoveries for cleaner concentrates greater than 15% Cu ranged from 40% to 70%. The highest Au recovery reported for the cleaner tests was 61%. Flotation response was generally insensitive to grind size.
Sequential flotation tests (Cu first followed by pyrite) resulted in a best cleaner Cu grade of 30% at 56% Cu recovery (52% Au recovery). Tests at lower Cu grades (19-22%) returned higher Cu recoveries (70-76%). Total Au and Ag recovery (to both concentrates) was 96-97%. The optimum grind size for rougher flotation was determined to be a P80 of 72 µm.
| Effective Date January 1, 2021 | Aris Gold | |||
| Page 140 of 384 |
| SRK Consulting | Soto Norte NI 43-101 – Feasibility Study |
A Locked Cycle Test (“LCT”) was undertaken, producing a Cu cleaner concentrate and a combined pyrite cleaner concentrate and copper cleaner scavenger tail for subsequent cyanide leaching. The Cu cleaner concentrate assayed 14.7% Cu at a Cu recovery of 83.2% and an Au recovery of 66.0%. The total Au recovery (to Cu cleaner concentrate, pyrite cleaner concentrate and Cu cleaner scavenger tail) was 97.2%.
A subsequent LCT, which had a gravity separation stage ahead of flotation, produced similar results: a Cu cleaner grade of 16.2% Cu at a Cu recovery of 78.2%, and an overall Au recovery of 97.4% (27.4% to the gravity concentrate).
Open circuit rougher-cleaner tests were conducted on the variability samples. With the exception of the Lo Au Lo Ag sample, which had a very low Cu grade, Cu concentrate grades ranged from 14% to 24% at Cu recoveries ranging from 64% to 82%, even for the Oxide sample. Total Au recoveries ranged from 90% (Oxide) to 92% (Lo Au Lo Ag) to 98-99% for the other samples.
An LCT on the LM IRE composite produced a Cu concentrate assaying 12.1% Cu at a Cu recovery of 69.1% and Au recovery of 41.7%. The overall Au recovery (including 9.2% to a gravity concentrate) was 97.8%.
| 13.2.5 | Environmental Characterisation |
An Acid Base Accounting (“ABA”) test conducted on the rougher tailings from the first LCT indicated the material to be Potentially Acid Generating (“PAG”), although a Net Acid Generating (“NAG”) test indicated that the sample would not generate acid. A Strong Acid Digest Elemental Analysis indicated that Pb was the main element present at an environmentally significant concertation in the sample.
| 13.3 | AUX Scoping Study, 2012 |
| 13.3.1 | Samples |
As of the time of the AUX Scoping Study (AMEC, 2012), the Soto Norte mineral resources had expanded significantly beyond the Mascota vein, and so samples for variability testwork were taken from six mineralised zones:
| ● | 20 from Mascota |
| ● | 15 from El Cuatro |
| ● | 6 from La Bodega |
| ● | 3 from Aserradero |
| ● | 3 from El Gigante |
| ● | 2 from Las Mercedes. |
Two composite samples were also made, LM MC2, based on the LM MC composite from the 2010 work, to which further intervals from the individual samples were added. Samples from 16 drillholes from throughout the deposit were blended to form the Master Composite MC3.
| 13.3.2 | Head Assay and Mineralogy |
Head assays for the two composite samples are shown in Table 13.3.
| Effective Date January 1, 2021 | Aris Gold | |||
| Page 141 of 384 |
| SRK Consulting | Soto Norte NI 43-101 – Feasibility Study |
Table 13.3: 2012 Testwork Composite Sample Head Assays
| Element
|
Unit | MC2 | MC3 | |||
| Au | g/t | 5.81 | 6.56 | |||
| Cu | % | 0.23 | 0.18 | |||
| Ag | g/t | 39.9 | 25.9 | |||
| As | ppm | 105 | 56 | |||
| Fe | % | 5.20 | 4.27 | |||
| S | % | 7.31 | 6.32 | |||
| Sb | ppm | 137 | 48 |
For the variability samples, the samples from the El Gigante zone had the highest average Au grade, and the samples from El Cuatro had the highest Ag and Cu grades.
Gold was identified as being present as native gold, electrum, and tellurides, with native gold and electrum the main species. Nearly all observed gold occurrences were fine (less than 15 µm) and strongly associated with sulphide minerals.
Copper minerals observed include enargite, chalcopyrite, bornite, chalcocite, and covellite. Enargite was found to be the most abundant copper mineral in both deposits (containing over 40% of the copper present). The copper minerals were relatively coarse grained.
Pyrite is the dominant sulphide mineral, at approximately 6% of the mass compared to less than 0.3% for the copper sulphides. Sphalerite was also reported as being present in significant quantities, especially in some locations of the El Gigante mineralisation.
| 13.3.3 | Comminution |
Of the 49 variability samples, 44 were submitted for comminution testwork, as was the MC3 composite. Due to their coarse size, two of the El Gigante samples were subjected to a Drop Weight Test, as were two other coarse samples, denoted ‘Mascota’ and ‘Kasita’. These latter two samples, which had been sampled from tunnels from artisanal miners into the upper parts of the La Mascota deposit and which showed some signs of oxidation, were used to calibrate the SMC Tests undertaken on the other samples.
Of the 44 variability samples tested, SMC tests were undertaken on all samples, 36 samples were submitted for Bond Ball Mill Work Index tests, and 22 for Bond Abrasion Index tests. The third El Gigante sample was also submitted for a Bond Crushing Work Index test.
The comminution test results for the MC3 sample are summarised in Table 13.4.
The Drop Weight Index values for the variability samples ranged from 2.52 kWh/m3 (Las Mercedes) to 7.12 kWh/m3 (El Cuatro), the Bond Ball Mill Work Index values from 12.9 kWh/t (Las Mercedes) to 20.5 kWh/t (El Cuatro), and the Bond Abrasion Index values from 0.19 g (Aserradero) to 1.10 g (El Cuatro).
The Bond Crushing Work Index value for the third El Gigante sample was 25.0 kWh/t.
Table 13.4: 2012 MC3 Comminution Testwork Results
| Test
|
Unit | Result | ||
| SMC Test Drop Weight Index | kWh/m3 | 4.92 | ||
| Bond Rod Mill Work Index | kWh/t | 13.7 | ||
| Bond Ball Mill Work Index | kWh/t | 15.4 |
| Effective Date January 1, 2021 | Aris Gold | |||
| Page 142 of 384 |
| SRK Consulting | Soto Norte NI 43-101 – Feasibility Study |
| Test
|
Unit | Result | ||
| Bond Abrasion Index | g | 0.49 |
| 13.3.4 | Gravity Separation and Flotation |
LCT on the MC2 composite produced a Cu concentrate assaying 15.3% Cu at a Cu recovery of 82.9% and Au recovery of 50.9%. The overall Au recovery (including 12.5% to a gravity concentrate) was 96.6%.
A further rougher kinetic test, and a rougher-cleaner batch test using recycle water from the LCT were also conducted.
Flotation testwork on the variability samples consisted of batch rougher-cleaner tests, with gravity separation ahead of flotation. The results of the (unoptimised) tests were quite variable, with poor Cu cleaner grades reported for the two Las Mercedes samples (2.4% Cu), and high tailings Au losses reported for the samples from La Bodega (16%) and the high Ag samples from El Cuatro (21%). The highest average recoveries for Cu, Au and Ag into the Cu cleaner concentrate were reported for the La Mascota samples.
Further grind size optimisation testwork was conducted at rougher stage using four samples – MC3, one of the El Gigante samples, an El Cuatro composite and a La Bodega composite. The testwork showed decreasing Au tail grades over the range of sizes tested (P80s from 90 µm to 40 µm), however there was only a marginal increase in Au recovery below a P80 of 60 µm. The Cu recovery to the Cu rougher concentrate was also maximised at a P80 of 60 µm for three of the four samples.
An open circuit rougher-cleaner test was conducted using the MC3 composite. This test produced a Cu concentrate assaying 13.8% Cu at a Cu recovery of 75.4% and Au recovery of 48.7%. The Au loss to the pyrite rougher tailings was 4.5%.
| 13.3.5 | Thickening and Filtration |
Solid-liquid separation testwork was conducted on the MC2 LCT first cycle rougher tailings sample. The testwork consisted of static thickening tests followed by vacuum and pressure filtration test on the thickened material.
The static thickening testwork included reagent screening, feed solid density optimisation and flocculant dosage optimisation. The optimum thickening rate was 0.057 m2/t/d.
Disc/drum vacuum filtration rates varied from 220-420 kg/m2/hr for residual moisture contents of 18-19%. Pressure filtration rates varied from 560-1020 kg/m2/h for residual moisture contents of 20 to 21%.
| 13.3.6 | Environmental Characterisation |
An ABA test conducted on the MC2 LCT rougher tailings sample classified this particular sample as “uncertain”, with the NAG test providing no further clarity. A Strong Acid Digest Elemental Analysis indicated that World Bank controlled parameters were at concentrations within the specified limits.
A Toxicity Characteristic Leaching Procedure (“TCLP”) test reported metal concentrations that were not expected to be of environmental concern. A Shake Flask Extraction test reported all World Bank controlled parameters to be at concentrations within their specified limits.
ABA tests were conducted on rougher tailings samples for 47 of the variability samples. 23 of the samples returned results designating them as PAG; the results for the other samples designated them as “uncertain”.
| Effective Date January 1, 2021 | Aris Gold | |||
| Page 143 of 384 |
| SRK Consulting | Soto Norte NI 43-101 – Feasibility Study |
All of the El Gigante samples were PAG.
Further testwork was conducted on a rougher flotation tailings sample generated during pilot scale flotation testwork that was used to generate concentrate for a pressure leaching pilot plant. The sample consisted of a 1:1 blend of material from La Mascota and El Gigante. A TCLP test reported all of the typically controlled parameters within the limits specified for this test procedure. A Strong Acid Digest Elemental Analysis reported an acidic pH value and Cu and Zn concentrations in excess of the World Bank limits. An ABA test classified the sample as PAG, a designation confirmed by a NAG test. Humidity cell testing consistently reported acidic leachates and concentrations of Cu in excess of the World Bank limits. Cumulative depletion rates indicated that the carbonate content of the flotation tailings was exhausted after nine weeks of leaching, and it was expected that acidic drainage from this sample would require management.
| 13.4 | Minesa PFS, 2017 |
| 13.4.1 | Samples |
The 2017 PFS testwork was conducted using two master composites, one each from La Mascota and El Gigante. The known mineral resource area was divided into a 150 x 150 m grid and one drillhole was selected within each block of the grid. Samples were taken using a cut-off grade of 3 g/t Au, representing an equivalent NSR value of approximately USD100/t. A total of 24 drillholes from La Mascota and 27 drillholes from El Gigante were sampled.
| 13.4.2 | Head Assay and Mineralogy |
Head assays for the two composite samples are shown in Table 13.5.
Table 13.5: 2017 Testwork Composite Sample Head Assays
| Element
|
Unit | La Mascota | El Gigante | |||
| Au | g/t | 12.4 | 7.96 | |||
| Cu | % | 0.36 | 0.26 | |||
| Ag | g/t | 50.0 | 29.8 | |||
| As | ppm | 640 | 480 | |||
| Fe | % | 5.07 | 5.70 | |||
| S | % | 6.83 | 7.60 | |||
| Sb | ppm | 192 | 88 |
A statistical analysis of gold recovery results versus sample head grade performed on variability samples across all Soto Norte testwork programs and sampling regimes showed that gold recovery is insensitive to head grade. Thus, while it typically assumed that composites with higher gold grade than the mining inventory will overstate gold recoveries, that is not the case for this deposit.
The bulk mineral composition was similar to the 2012 samples, comprising approximately 55% quartz, 10% muscovite/clays, 10% pyrite, and 9% alunite. Enargite is the most abundant copper bearing mineral, containing 31-34% of the copper in the samples. The remaining copper is in bornite (20-32%), covellite (11-18%), chalcocite (5-15%) and chalcopyrite (15-17%). Arsenic occurred almost exclusively as enargite/tetrahedrite. Pyrite accounted for 73-75% of the total sulphur, while alunite held 21-22%.
The Mascota Composite had better copper mineral liberation characteristics than the Gigante Composite. Free and liberated copper minerals ranged from 55% in the +150 µm fraction to 88% in the -20 µm fraction,
| Effective Date January 1, 2021 | Aris Gold | |||
| Page 144 of 384 |
| SRK Consulting | Soto Norte NI 43-101 – Feasibility Study |
while the range was 34% to 81%, respectively, for the Gigante Composite. Strong associations between the copper minerals and pyrite were observed. Pyrite liberation was better than the copper minerals.
Gold deportment was examined via a three-stage diagnostic leach test on the individual Mascota and Gigante Master Composites at a P80 of 106 µm. Approximately 51-52% of the gold was amenable to direct cyanidation, 32-40% of the gold associated with pyrite and other sulphides, 8-15% of gold possibly present in pyrrhotite, calcites, ferrites, dolomite, galena, hematite, uraninite and labile sulphides, and the locked gold accounted for 0.6% and 1.5% of the total gold for Mascota and Gigante Master Composites, respectively.
| 13.4.3 | Comminution |
“Coarse rock” samples from La Mascota and El Gigante were subjected to Drop Weight and SMC Tests, and Bond Rod Mill Work Index, Bond Ball Mill Work Index and Bond Abrasion Index tests. In addition, the two Master Composites were subjected to a Bond Ball Mill Work Index test, and individual interval samples (6 for La Mascota, 3 for El Gigante) were subjected to Bond Rod Mill Work Index, Bond Ball Mill Work Index and Bond Abrasion Index tests.
The comminution test results for the two ‘coarse rock’ samples are summarised in Table 13.6.
Table 13.6: 2017 Coarse Rock Comminution Testwork Results
| Test | Unit | La Mascota | El Gigante | |||||
| SMC Test Drop Weight Index | kWh/m3 | 7.31 | 7.01 | |||||
| Bond Rod Mill Work Index | kWh/t | 15.4 | 13.8 | |||||
| Bond Ball Mill Work Index | kWh/t | 16.9 | 15.3 | |||||
| Bond Abrasion Index | g | 0.79 | 0.98 |
The Mascota material is categorised as hard and the Gigante material moderately hard from the DWT/SMC perspective. The Bond Rod Mill Work Index values for the individual interval samples ranged from 11.5 kWh/t to 16.7 kWh/t (medium to moderately hard), the Bond Ball Mill Work Index values from 15.0 kWh/t to 17.9 kWh/t (moderately hard to hard), and the Bond Abrasion Index values from 0.42 g to 1.13 g (moderately abrasive to highly abrasive).
| 13.4.4 | Gravity Separation and Flotation |
The 2017 PFS flotation testwork program commenced in 2016 with batch tests, testing operating parameters including batch vs sequential flotation, pH, copper collector type, depressant (Cu cleaner section), grind size (primary and regrind), and pyrite activation. The principal conclusions from this section of the testwork were:
| ● | At the target Cu concentrate grade of 16%, the Cu recovery for La Mascota is 70 to 74% and 68% for El Gigante |
| ● | The Au recovery to the Cu concentrate is 40% for La Mascota and 35% for El Gigante |
| ● | The total Au recovery is 95% for La Mascota and 89% for El Gigante |
| ● | Pyrite cleaning reduced the pyrite concentrate mass by over 50% with a minor (2.1%) loss in Au recovery |
| ● | Flotation performance is largely unaffected by primary grind size, over the range of 106 µm to 170 µm |
| Effective Date January 1, 2021 | Aris Gold | |||
| Page 145 of 384 |
| SRK Consulting | Soto Norte NI 43-101 – Feasibility Study |
| for La Mascota and 75 µm to 140 µm for El Gigante. |
Compared to the 2010 and 2012 programs, the overall Au recovery was 2% lower for the La Mascota sample and 4% higher for El Gigante.
Following the batch flotation tests, four LCT were undertaken. The first two tested the La Mascota and El Gigante composites separately, and the third tested a blend of the two composites at a finer primary grind size (106 µm compared to 150 µm) and with the pyrite cleaner scavenger tailings recycled to the pyrite rougher feed from initially being rejected. The fourth test again tested the composite, but the pyrite cleaner scavenger was eliminated (pyrite cleaner tails recycled to pyrite rougher feed) and pyrite re-cleaner introduced.
The La Mascota LCT reported a 15.9% Cu concentrate at a Cu recovery of 77.5% and an overall Au recovery of 85.9%. The test on the El Gigante sample reported a 17.5% Cu concentrate at a Cu recovery of 73.0% and an overall Au recovery of 78.9%. The third LCT with blended composite reported 15.4% Cu concentrate at a Cu recovery of 78% and an overall Au recovery of 91.8%. The fourth LCT reported a 15.8% Cu concentrate at a Cu recovery of 76.2% and an overall Au recovery of 90.8%. The higher Au recovery for the blended composite was due to the recirculation of the pyrite cleaner tailings.
Mineralogy on copper concentrates revealed the major gangue material to be pyrite, sphalerite, and a range of silicates, notably quartz, muscovite/clays, and sulphates. Liberation of copper minerals was in the range of 75 to 80%. Approximately two-thirds of the pyrite and silicates were liberated indicating flotation chemistry or entrainment to be the issue. Poor liberation was the other explanation for dilution in the copper concentrates.
Mineralogy on flotation tailings showed that only ~20% of the pyrite was free and liberated in the final pyrite tailings. These pyrite grains had a very fine size, and likely deported to the tailings because they either had very slow kinetics or did not respond to flotation at the applied collector dosage level. Poor liberation was the main cause for pyrite and gold losses for both Master Composites.
A further 25 variability (batch) tests were undertaken, using individual interval samples, 7 of which were designated “high clay”. Although the results showed significant scatter, on average they matched the LCT results in terms of Cu grade and recovery and Au grade. There were no significant trends of recovery with head grade, other than a drop-off in recovery for very low head grades (<0.1% for Cu).
Additional assays on the LCT concentrates indicate Cu concentrate grades of approximately 250 g/t Au, 1,500 to 2,000 g/t Ag, and approximately 2.5% As.
The pyrite concentrates contained just under 40 g/t Au on average, with 100 to 150 g/t Ag.
More detailed assays of the two individual composite Cu concentrates indicated elevated levels of Te (El Gigante), Hg (both La Mascota and El Gigante), F (both), Bi (both), Cd (both), Sb (both), and Zn (particularly El Gigante).
A total of 78 large cell flotation tests (10-12 kg charges) were performed to generate sufficient products for subsequent test programs. Phase I flotation tests produced approximately 5.7 kg of copper concentrate grading 17.4% Cu, 201 g/t Au, 1435 g/t Ag, 6.63% Zn, 2.46% As, 0.80% Sb and 35.9% S. Phase II tests applied a full sequential copper and pyrite flotation flowsheet and generated 7.6 kg of pyrite concentrate grading 30.3 g/t Au, 93.1 g/t Ag, 0.33% Cu, 45.1% S, 40.1% Fe, 0.088% Zn, 0.10% As, 0.016% Sb, 29.2 g/t U and 9.9 g/t Th. The remaining tests generated a pyrite concentrate grading 36.4 g/t Au,
| Effective Date January 1, 2021 | Aris Gold | |||
| Page 146 of 384 |
| SRK Consulting | Soto Norte NI 43-101 – Feasibility Study |
104 g/t Ag, 0.11% As, 40.9% S, 0.04% C and 0.40% Cu, which was submitted for smelting testwork. Approximately 500 kg (dry equivalent) of final tailings was generated for downstream testwork, this material had a P80 of 100 µm and graded 1.16 g/t Au, 4.1 g/t Ag, <40 g/t As, 1.99% S and 0.021% Cu.
| 13.4.5 | Thickening and Filtration |
Some of the material generated from the large cell tests were used for thickening and filtration testwork. Concentrates which had been generated from both composites separately were combined for this testwork.
There was only sufficient Cu concentrate to conduct a static thickening test, however, there was sufficient pyrite concentrate for a dynamic thickening test. Rheology and filtration tests were also conducted.
The same testwork was also conducted on the flotation tailings, with the two composites tested individually (thickening and rheology) and combined (filtration).
The optimum thickening rates varied from 0.06 m2/t/d for the Cu concentrate to 0.09-0.10 m2/t/d for the pyrite concentrate and tailings samples.
Disc/drum vacuum filtration rates on the tailings sample varied from 310-850 kg/m2/hr for residual moisture contents of 19-22%. Pressure filtration rates were up to 1,300 kg/m2/hr for residual moisture contents of 12-14% for the tailings, 1,800 kg/m2/h for a residual moisture content of 10% for the Cu concentrate, and 1,600 kg/m2/h for a residual moisture content of 8.4% for the pyrite concentrate.
| 13.4.6 | Environmental Characterisation |
Testwork was conducted on the two rougher flotation tailings samples generated from the large cell flotation tests. ABA tests classified both samples as not-PAG, a designation confirmed by a NAG test. All parameters controlled by the World Bank are shown to be within the designated standards in humidity cell testing, with the exception of Hg in week 1 for the El Gigante sample. After 67 weeks of leaching, the insoluble sulphate corrected cumulative sulphide depletions indicated exhaustion of the sulphide content of both samples, suggesting that both Minesa test cells may be expected to maintain net neutral conditions, barring hydrolysation of the alunite content of the sample.
A Strong Acid Digest Elemental Analysis of the humidity cell test residue reported all parameters at concentrations within the World Bank guidelines. NAG testing completed on the same residues reported no net acidity after aggressive oxidation of the samples.
| 13.5 | Minesa, 2018 |
| 13.5.1 | Samples |
The 2018 testwork was conducted using a further Master Composite which was made up in the context of the proposed mining plan for the first three years of operation. The samples making up the composite (consisting of samples from 7 drillholes at La Mascota and 11 at El Gigante) were generally taken from deeper in the deposits than had been the case earlier and were based on the use of a lower NSR cut-off. Individual intervals of this composite were also used for variability testwork. Ten ‘high clay’ intervals were also sampled for testwork, these samples tended to be significantly lower in Cu grade (0.02 to 0.23%) with Au grades ranging from 0.2 to 8.9 g/t Au.
| 13.5.2 | Head Assay and Mineralogy |
| Effective Date January 1, 2021 | Aris Gold | |||
| Page 147 of 384 |
| SRK Consulting | Soto Norte NI 43-101 – Feasibility Study |
Head assays for the 2018 Master Composite sample are shown in Table 13.7.
Table 13.7: 2018 Testwork Composite Sample Head Assays
| Element | Unit | Value | ||
| Au | g/t | 5.35 | ||
| Cu | % | 0.31 | ||
| Ag | g/t | 39.7 | ||
| As | ppm | 560 | ||
| Fe | % | 5.92 | ||
| S | % | 7.41 | ||
| Sb | ppm | 173 | ||
The Master Composite comprised 0.45% copper sulphides, 0.23% enargite/tetrahedrite, 12.4% pyrite, 0.17% sphalerite, 55.9% silica, 19.4% K-feldspar and muscovite, 1.3% clays, and 6.72% alunite.
Copper deportment studies show that enargite/tetrahedrite account for approximately 28% of the copper and rank as the first copper source. The combined bornite, covellite, and chalcocite contribute to 59% of the copper, and chalcopyrite constitutes 12% of the copper. Besides that, trace amounts of copper (1.35%) were from other sulphides and 0.03% of Cu from silicates.
Illite was the dominant clay mineral in the fourteen clay samples.
| 13.5.3 | Flotation |
One of the key outcomes of the 2017 PFS flotation testwork was that by maintaining a deeper froth and allowing a longer flotation time, gangue entrainment during flotation was significantly reduced. The impacts of less gangue entrainment were to reduce the regrinding requirements and to provide greater flexibility in achieving the target 16% Cu concentrate grade.
Batch tests confirmed the relationship between grind size and copper recovery as determined in the previous studies. A LCT conducted using the 2017 La Mascota composite and the optimised flotation conditions (deeper froth, longer cleaner residence times) resulted in a significant improvement in performance, with a Cu concentrate assaying 19.4% at a Cu recovery of 81.5% (compared to 15.9% and 77.5%, respectively, previously) and with a total Au recovery of 94.0% (compared to 85.9% previously).
The 2017 Master Composite was tested using this flowsheet, resulting in a Cu concentrate assaying 16.3% Cu at a Cu recovery of 86.7% and with an overall Au recovery of 95.0%. Further adjustments to the circuit configuration did not produce any better results. The non-sulphide gangue content of the copper and pyrite concentrates was less than 10%, a significant reduction from the PFS testwork.
These LCT re-used the water from each cycle for the subsequent cycle with no determinant in flotation performance observed, although a build-up in metal ions and sulphate was measured.
Further variability testwork resulted in the same degree of improvement in overall Au recovery as was observed in the LCT.
Analysis of gold recovery spatially across the deposit indicates that low Au recoveries are associated with the El Cuatro area of the deposit. Lower Au recoveries are associated with increased Au locked in silicates and sulphide-silicate composites rather than with lower Au head grades.
| Effective Date January 1, 2021 | Aris Gold | |||
| Page 148 of 384 |
| SRK Consulting | Soto Norte NI 43-101 – Feasibility Study |
The ‘high clay’ intervals were composited and subjected to batch and LCT. The grade of the composite was 3.2 g/t Au and 0.065% Cu. While the flotation test results were inferior to those for the master composite, this was concluded as being due to the low head grades rather than to the high clay content, although the presence of the clays did impede the flotation kinetics.
Assays of minor elements in the LCT final Cu concentrates showed similar levels to the PFS figures for elements such as As, Bi, Hg, Sb, Te, and Zn, although the Cd content was somewhat higher. The lower gangue content in the concentrate resulted in lower Cl, U, and Th levels.
| 13.5.4 | Thickening and Filtration |
A single sample of rougher tailings was used for thickening and filtration testwork.
The optimum thickening rate was 0.10 m2/t/d under static conditions, and 0.06-0.12 m2/t/d under dynamic conditions. Pressure filtration rates were 550-790 kg/m2/h for residual moisture contents of 11-13%.
| 13.6 | Minesa, 2019 |
| 13.6.1 | Samples |
The 2019 geometallurgical study was undertaken for the Feasibility Study using 76 samples for comminution and 44 for flotation. The original samples were selected according to several criteria and were “front loaded”, that is, 50% of the samples were taken from material scheduled to be mined in the first five years, with 25% from the next five years and the remainder from later scheduled material. Further samples were added to ensure equal representation of domains not previously sampled, with the final sample inventory representing the 10 largest tonnage domains together representing 78% of the deposit. A range of grades of the key elements (Au, Cu, Ag, As, Zn, and S) was also covered.
A small number of samples from the New Vein were also tested as part of the 2019 program.
The Marketing Composite, weighing 180 kg, was generated from the geometallurgical program samples and was designed to match the average grade of the first 5 years’ mining inventory. The composite had a head grade of 5.46 g/t Au, 0.27% Cu, 47 g/t Ag, 0.05% Zn, 530 ppm As, and 200 ppm Sb.
| 13.6.2 | Comminution |
The comminution tests conducted for the 2019 geometallurgical study consisted of a SAG Power Index (“SPI”) test and Modified Bond Work Index conducted on each sample, and 10 standard Bond Work Index tests used to calibrate the Modified Bond Work index tests. The SPI tests also produced a “Crushing Index”.
The average of the 10 Bond Work Index tests was 17.6 kWh/t. Based on all the comminution results, a tonnage and P80 estimate was made in the block model using MinnovEX software, Comminution Economic Evaluation Tool (“CEET”), subject to constraints on both tonnage (minimum 280 tph, maximum 380 tph) and P80 (minimum 90 µm, maximum 122 µm). The average predicted performance was 350 tph at a P80 of 107 µm.
| 13.6.3 | Flotation |
The flotation tests conducted for the 2019 geometallurgical study consisted of a MinnovEX Flotation Test (“MFT”) conducted on each sample to produce rougher flotation parameters. A QEMSCAN mineralogical analysis was conducted on each sample to link the assay data to the mineralogy to produce rougher stage
| Effective Date January 1, 2021 | Aris Gold | |||
| Page 149 of 384 |
| SRK Consulting | Soto Norte NI 43-101 – Feasibility Study |
flotation parameters for copper (sulphide) and pyrite. Eleven samples were also subjected to a batch rougher and cleaner test with regrind to determine cleaner stage kinetics.
SGS used the results of the flotation study to produce estimates of flotation performance for each block in the model, using MinnovEX software, Flotation Economic Evaluation Tool (“FLEET”). Overall precious metal recoveries to the combined concentrates are forecast to be from 89 to 94.5% for gold and from 86 to 93% for silver. Forecast copper concentrate grade is fixed at 16% Cu and show an annual average copper recovery that is typically around 75%, except when the copper head grade is low in the early years.
The Marketing Composite was split into 12 kg batches and processed as 20 LCT to produce 1 kg of copper concentrate and 12 kg of pyrite concentrate. Detailed assays of the concentrates are shown in Table 13.8.
Table 13.8: Marketing Composite Concentrate Assays
| Element | Unit | Copper Concentrate | Pyrite Concentrate | |||
| Au | g/t | 165 | 36.1 | |||
| Cu | % | 16.9 | 0.55 | |||
| Ag | g/t | 2014 | 178 | |||
| As | % | 2.61 | 0.12 | |||
| Fe | % | 29.4 | 40.9 | |||
| S | % | 43.0 | 47.7 | |||
| Zn | % | 3.15 | 0.08 | |||
| Pb | ppm | 368 | 641 | |||
| Sb | ppm | 9500 | 280 | |||
| Cd | ppm | 337 | <200 | |||
| Te | ppm | 203 | 33 | |||
| Se | ppm | <200 | <200 | |||
| Hg | ppm | 33.6 | 2.3 | |||
| U | ppm | 9 | 11 | |||
| Th | ppm | 5.8 | 9.1 | |||
| Al | % | 0.35 | 0.60 | |||
| 13.7 | Recovery Assumptions |
Recovery assumptions are shown in Table 13.9. For Au, Ag, Cu, Zn, As and pyrite, the ranges shown are the annual figures as produced by the FLEET geometallurgical modelling. The figures for the other elements are based on the 2017 PFS flotation testwork.
The sulphur recovery is based on developing a mass balance for the copper concentrate (including an assumed non-sulphide gangue component), with the remaining sulphide minerals assigned to the pyrite concentrate to meet the total pyrite recovery figure.
Table 13.9: Feasibility Study Metal Recovery Assumptions
| Element/Mineral | Recovery (%) | |||||
| Total | Cu Concentrate | Pyrite Concentrate | ||||
| Au | 89.6-94.4 | 36.2-54.0 | 40.4-55.9 | |||
| Ag | 87-91 | 37-50 | 38-51 | |||
| Cu | 90.1-94.1 | 66.8-79.1 | 14.8-24.0 | |||
| As | 83.2-89.3 | 51.7-65.4 | 23.5-33.0 | |||
| S | variable | variable | Variable | |||
| Effective Date January 1, 2021 | Aris Gold | |||
| Page 150 of 384 |
| SRK Consulting | Soto Norte NI 43-101 – Feasibility Study |
| Element/Mineral | Recovery (%) | |||||
| Total | Cu Concentrate | Pyrite Concentrate | ||||
| Sb | 89.0 | 75.0 | 14.0 | |||
| Bi | 83.0 | 56.0 | 27.0 | |||
| Zn | 49.8-65.2 | 26.2-40.0 | 12.6-30.1 | |||
| Pyrite | 87-93 | 5-9 | 80-88 | |||
| 13.8 | Conclusions and Recommendations |
The level of testwork conducted to date in support of the proposed flowsheet meets SRK’s typical expectations for a FS level of study. Flotation testwork has extended to LCT, which are of sufficient quality to parameterise the circuit and derive the recoveries of the minor elements as adopted in this Feasibility Study.
The geometallurgical testwork program represents a significant investment in understanding and quantifying the metallurgical variability in the deposit, and the incorporation of the results of this program into the block model represents a significant advancement in the quantification of variability which is sufficiently representative of the ore types informing the LOM schedule on a grade and spatial basis.
There are no known processing factors or deleterious elements that could have a significant effect on potential economic extraction of the ore, that have not been considered and accounted for in the processing plan and the economic model.
For the flotation modelling, SGS used only one of the three flotation model parameters (Rmax, the ultimate recovery) for modelling, as the scatter in the other two parameters (kavg, the median flotation rate and Alpha, the variability in k values for each mineral) was too great for these parameters to be reliably used. SGS also noted that there was a divergence in the distribution of Cu grade between the block model and the samples tested, however this was principally due to the presence of three samples of relatively high grade (2.6 to 4.8% Cu) in the samples tested.
SRK notes and endorses the following recommendations made by Ausenco (2020) in relation to metallurgical testwork:
| ● | Flotation testwork using (simulated) process water, to assess the impact of water quality. SRK adds that such testwork should use site water as the starting water source |
| ● | Geometallurgical testwork extended to weathered and oxidised material |
| ● | Thickening and filtration testwork “at design conditions” for concentrates and dry filtered tailings. |
| Effective Date January 1, 2021 | Aris Gold | |||
| Page 151 of 384 |
| SRK Consulting | Soto Norte NI 43-101– Feasibility Study |
| 14 | MINERAL RESOURCE ESTIMATES |
| 14.1 | Introduction |
The Mineral Resource estimate presented herein represents the latest Mineral Resource estimate prepared for the Project in accordance with the guidelines of the Canadian Securities Administrators’ NI 43-101.
The Mineral Resource estimate supporting the FS was interpreted from 901 drillholes totalling 374,598 m.
The MRE was completed by SRK’s Mr Ben Parsons, MAusIMM (CP), an “independent qualified person” as defined in NI 43-101. The effective date of the Mineral Resource estimate is 22 May 2019.
This section describes the MRE methodology and summarises the key assumptions considered by SRK. In the opinion of SRK, the Mineral Resource estimate reported herein is a reasonable representation of the global Mineral Resources found in the Soto Norte Project based on the current level of sampling and geological interpretation.
The database used to estimate the Soto Norte Project Mineral Resource estimate was audited by SRK initially in 2016. Minesa has made no significant changes to the database since this date, except for changes to the geological coding related to the vein identifications, which has been reviewed by SRK. SRK believes the current drilling information is sufficiently reliable to interpret with confidence the geological boundaries for vein-hosted mineralisation and that the assay data is sufficiently reliable to support an MRE.
A number of drillholes show moderate to high deviations, possibly caused by changes in rock lithology or the structural setting. These deviations should be reviewed but it is not expected to generate big displacements or errors in the vein interpretation and modelling.
Seequent Leapfrog Geo (Leapfrog™) was used to generate three-dimensional (“3D”) geological wireframes and to code all sampling and define volumes for estimation. Datamine Studio RM software was used to prepare assay data for geostatistical analysis, construct the block model based on wireframes, estimate metal grades and tabulate the Mineral Resources. Phinar X10 Geo software (“X10”) has been used to complete the initial statistical analysis and capping studies, with Snowden Supervisor software was used for geostatistical analysis and variography.
| 14.2 | Resource Database |
A total 901 boreholes were used in the Mineral Resource estimate, totalling 374,598 m as shown in Table 14.1 (Minesa, 2019a).
SRK initially was provided a database with an effective date of 25 August 2016 to form the basis for the geological model and the associated MRE. Subsequently, Minesa provided an updated assay interval table on 31 January 2019, which contained no new drillholes, but accounted for a number of re-assays of other elements of interest, namely sulphur (S_PCT), and included an update to geological logging within key geological domains.
Table 14.1: Summary of Boreholes Used in Mineral Resource Estimate
| Year | Boreholes1 | Drilled (m) | Company | |||
| 2006 | 12 | 2,991 | VGC | |||
| 2007 | 46 | 12,406 | VGC | |||
| 2008 | 38 | 10,091 | VGC | |||
| 2009 | 85 | 33,157 | VGC | |||
| 2010 | 172 | 66,291 | VGC |
| Effective Date January 1, 2021 | Aris Gold | |||
| Page 152 of 384 |
| SRK Consulting | Soto Norte NI 43-101– Feasibility Study |
| Year | Boreholes1 | Drilled (m) | Company | |||
| 2011 | 165 | 64,386 | VGC / AUX | |||
| 2012 | 274 | 135,340 | AUX | |||
| 2013 | 30 | 14,990 | AUX | |||
| 2016 | 79 | 34,947 | Minesa | |||
| TOTAL | 901 | 374,598 |
1Historical drilling missing survey data and geotechnical or piezometer boreholes drilled outside of the area covered by the mineralisation were excluded from the MRE
Drilling was initially completed to achieve drilling intersections on a grid spacing of 100 x 100 m, and later, to 50 x 50 m. Drilling has been orientated based on available locations and designed where possible to intersect veins at suitable angles to provide representative sampling (see Section 10.4). Drilling has typically been completed from the hanging-wall side of the veins.
SRK believes the quality of the database is adequate for use in the construction of the geological block model and associated MRE.
All data was validated by SRK before commencing statistical evaluation and the subsequent estimation processes. This involved the import of these data sets into software packages Leapfrog™ and Datamine) and assessing for erroneous values or overlaps
| 14.3 | Geological Interpretation and Modelling |
SRK has focused its geological interpretation for the Soto Norte Project on the mineralisation model. This included the development of the key structural features and their relationship with the various phases of mineralisation at the Project.
SRK has not completed a larger-scale regional geological model however, one exists and was used to develop the Soto Norte hydrogeology model.
| 14.4 | Structural Model |
The 2017 PFS geological investigation included the development of the structural model for the deposit. This increased the understanding of the significance of faults and faulting, which are noted to both host and act as feeders to the mineralisation. A summary of the key faults modelled are shown in Figure 14.1 (SRK, 2016b).
In the image shown, the main orientations of faults are highlighted based on the geometry of the value shells interpolated based on the presence of fault intercepts, with the larger sized shells relating to a greater fault significance. Figure 14.1 highlights the main La Rosa (Mascota) and La Baja (Gigante) faults, plus the possible interaction with second order splays.
To verify the fault model, Minesa and SRK reviewed the interpretations against geological logging information and results from the acoustic televiewer downhole surveys. Only the faults which could be confirmed and demonstrated continuity over multiple drilling lines have been used in the final model. A plan of the final fault wireframes versus the fault thickness information is shown in Figure 14.2 (SRK, 2016b).
| Effective Date January 1, 2021 | Aris Gold | |||
| Page 153 of 384 |
| SRK Consulting | Soto Norte NI 43-101– Feasibility Study |
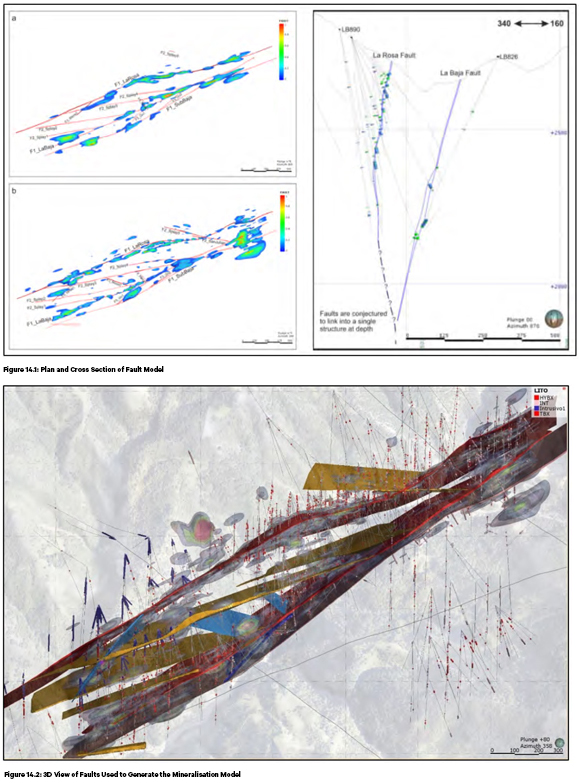
| 14.5 | Mineralisation Model |
Minesa has continued to work on improving the knowledge used to generate the geological model as more detailed information on the Project and the minor elements have become available. Minesa reached out to an independent reviewer in 2019 to provide input and recommendations to refine the geological interpretation from the mineralisation model used in the previous study.
| Effective Date January 1, 2021 | Aris Gold | |||
| Page 154 of 384 |
| SRK Consulting | Soto Norte NI 43-101– Feasibility Study |
To generate the Soto Norte geological model, the drillholes were imported and validated in Leapfrog™ which was then subsequently used for geological modelling.
During the 2017 PFS, the veins were modelled initially on a combination of geological logging information and a 2 g/t Au grade cut-off selected by Minesa. SRK reviewed the geological model and added continuity to the veins based on lithological detail, or supplementary information from Ag, Pb and Zn assays, to add continuity in areas of lower (<2 g/t) Au grades. In 2017, SRK recommended that the geological model should be completed with a focus on reviewing the impact on continuity of the vein structures when based on NSR values rather than g/t Au only. Between 2018 and 2019, Minesa improved the geological model continuity considering NSR values. Additional changes were observed in the veins located between the Mascota and Gigante main veins, where Minesa reviewed and updated the continuity of the veins using new structural criteria and other elements, including lanthanum (La), that have shown strong inverse correlation with Au mineralisation.
Grade estimation domains/zones comprise narrow corridors which have been modelled using wireframes based on geology.
Minesa initially completed a mineralisation model using the following structured phases:
| ● | Phase 1: Interpretation of high-grade envelopes using vertical cross-sections |
| ● | Phase 2: 3D Modelling of the high-grade envelopes and any internal waste in Leapfrog™, using NSR as a guide, as discussed above |
| ● | Phase 3: Combined high-grade envelopes within previously interpreted vein envelopes, which were developed and reviewed based on 180 sections loaded into Leapfrog™ |
| ● | Phase 4: Review of the combined envelopes in the cross section and corrected any overlaps found in the combined model |
| ● | Phase 5: Review of the updated cross section interpretations using horizontal sections (approx. 50) to confirm continuity of the modelled vein and high-grade envelopes |
| ● | Phase 6: Finalisation of the structural model and introducing fault displacements |
| ● | Phase 7: Checking that the modelled fault displacements make sense in cross section and implementing final edits as required. |
The consistency and appropriateness of the updated mineralised wireframes has been visually reviewed by Minesa’s third party reviewer, with any erroneous data reported to Minesa for further review. The geological models were then passed to SRK for final review and integration into the Mineral Resource process.
This process has been iterative with changes discussed between SRK and Minesa to ensure validity of the model. SRK considers that the wireframes are appropriately representative of the validated assay data and form geologically sound bodies which, when used alongside the fault planes (also modelled by Minesa), provide sufficient geological control for an MRE at the confidence levels assigned. An example of the drillhole composite gold grades versus the fault model is shown in Figure 14.3 (SRK, 2016b).
| Effective Date January 1, 2021 | Aris Gold | |||
| Page 155 of 384 |
| SRK Consulting | Soto Norte NI 43-101– Feasibility Study |
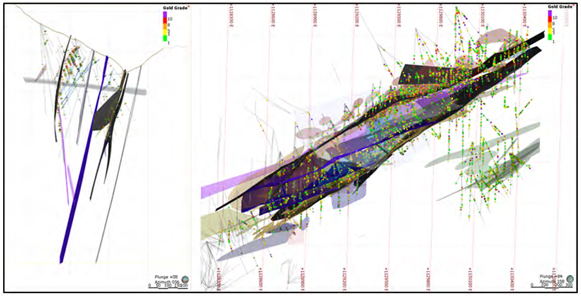
Figure 14.3: Section and Plan Showing Faults and Gold Grades
Minesa’s Geology Department updated the mineralisation model following the guidelines provided by the third-party reviewer and SRK, with a focus on improving the geological continuity, where possible. Where veins from adjacent vertical sections were identified to show along strike continuity, Minesa applied coding which defined them as individual mineralised lenses.
Validation of the continuity wireframe model has been completed using level plans, vertical sections and in 3D for along strike continuity. An additional validation consisted of an evaluation process of Leapfrog™ that compares the drillhole intercept and the resulting vein wireframe, obtaining a measure of the quality of snapping to data and dilution. All the vein wireframes obtained values above 95%.
Once the final interpretation had been completed, veins were individually coloured and the mineralised zones were reviewed again in cross-section, plan view and 3D. Leapfrog™ was used to generate wireframes to connect the vein intersections along strike. Individual wireframes and corresponding sample intervals were given a unique grouping code (DOMAIN) and vein number (KZONE-IDVETA) code.
Fifteen main veins were identified (DOMAIN CODES 100 to 1500) and are analysed separately for capping, variography and estimation. The rest of the veins (minor veins) were grouped according to the geological nature, location and directional dip into twenty areas (Domain Codes 2100 to 5200).
A summary of the groups (Domains) and number of veins is provided in Table 14.2, with the visual distribution shown in Figure 14.4 and Figure 14.5. The domains 20100, 20200, and 20300 are low-grade dilution and domain 20500 refers to dilution around Mascota (M1) with elevated grades, considered separately.
Table 14.2: Grade Estimation Domains
| Domain Codes (Groups) | Name | Number Veins | ||
| 100 |
Mascota Main (M1) | 1 | ||
| 200 |
Gigante Main (G1) | 1 | ||
| 300 |
M3 | 1 | ||
| 400 |
New Vein (N1) | 1 | ||
| 500 |
G2 | 1 | ||
| 600 |
M4 | 1 | ||
| 700 |
M13 | 1 |
| Effective Date January 1, 2021 | Aris Gold | |||
| Page 156 of 384 |
| SRK Consulting | Soto Norte NI 43-101– Feasibility Study |
| Domain Codes (Groups) | Name | Number Veins | ||
| 800 |
M15 | 1 | ||
| 900 |
M24 | 1 | ||
| 1000 |
M6 | 1 | ||
| 1100 |
G9 | 1 | ||
| 1200 |
G3 | 1 | ||
| 1300 |
G4 | 1 | ||
| 1400 |
M62 | 1 | ||
| 1500 |
M2 | 1 | ||
| 2100, 2150, 2200, 2250, 2300, 2350, 2400, 2500, 2600 |
Mascota Superior | 61 | ||
| 3100, 3200, 3300, 3400, 3500, 3600 |
Mascota Inferior –Gigante Superior | 57 | ||
| 4100, 4200, 4300 |
Gigante Inferior | 18 | ||
| 5100, 5200 |
Aserradero | 25 | ||
| 20100,20200,20300 |
Dilution Halo | 3 | ||
| 20500 |
Breccia | 1 |
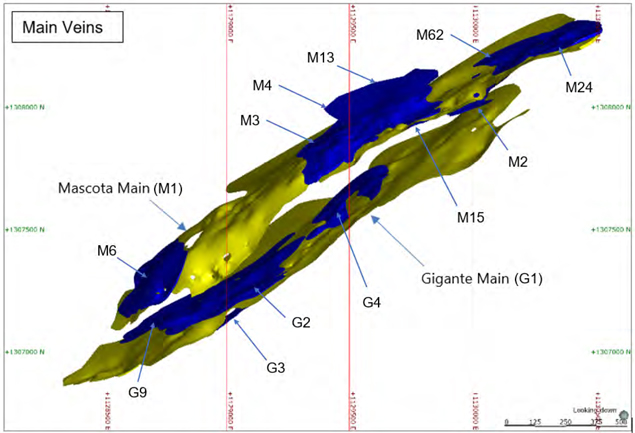
Figure 14.4: Plan of Main Vein Domains
| Effective Date January 1, 2021 | Aris Gold | |||
| Page 157 of 384 |
| SRK Consulting | Soto Norte NI 43-101– Feasibility Study |
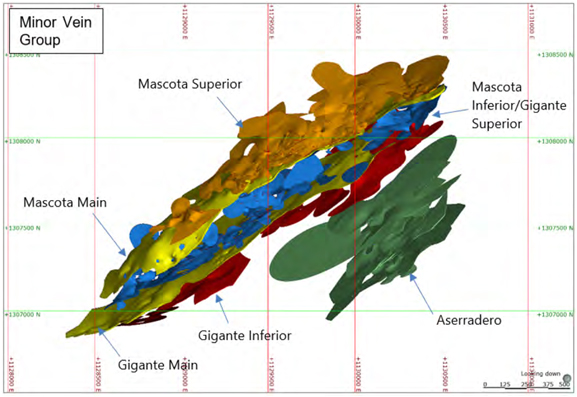
Figure 14.5: Plan of Minor Vein Domains
The Central Mascota Breccia is in the central zone of the Mascota vein. The mineralisation is formed by high density of veining with medium to high gold grade in the hanging-wall and footwall of Mascota. The geologists of Minesa constructed a wireframe using Leapfrog™ software based on a combination of lithological and economic parameters. Figure 14.6 presents the wireframe of the Central Mascota Breccia.
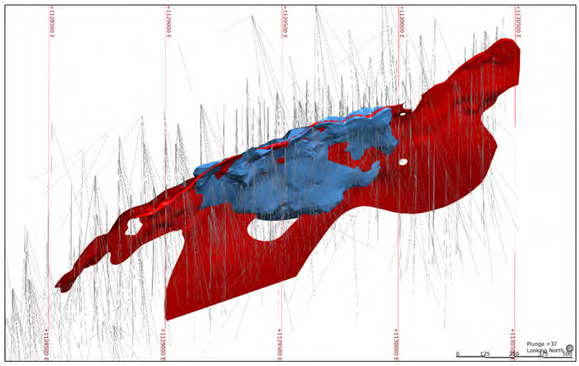
Figure 14.6: Oblique View of Central Mascota Breccia (light blue) and Mascota Vein (Red)
| Effective Date January 1, 2021 | Aris Gold | |||
| Page 158 of 384 |
| SRK Consulting | Soto Norte NI 43-101– Feasibility Study |
| 14.6 | Waste Model |
No detailed geological model outside of the veins has been completed by SRK as part of the current scope of work. SRK notes that mineralisation does occur outside of the defined veins and, to assist with the underground mining study, SRK has completed a basic estimate of the waste grades for dilution purposes. To define the model (and also limit the potential for smoothing of high-grade vein intersections excluded from the modelled vein mineralisation due to the lack of strike or dip continuity), SRK has applied the following rules:
| ● | A wireframe halo was created around the block centroids of the complete Soto Norte block model using the distance function of Leapfrog™ to a limit of 8 m |
| ● | All associated sample values were capped appropriately to avoid potential smoothing of grades from any unmodeled vein samples |
| ● | The spherical search was used for grade interpolation in the block model of the dilution halo using the capped 3 m composites located outside of the veins and captured with the 8 m halo wireframe |
| ● | A grade model was estimated by Inverse Distance Weight (Power 2) (“IDW2”) |
| ● | Created two sub-sets of this model surrounding any vein-model blocks classified as Indicated and as Inferred to a limit of 8 m into the hanging-wall and footwall of each vein (Figure 14.7), to aid in the classification of the dilution blocks in the final MRE and subsequent mining studies if required, whereby the dilution grades reflect the confidence in the vein estimates for any given block. The 8 m Indicated classification halo is shown in purple and the 8 m waste model wireframe is shown in grey. |
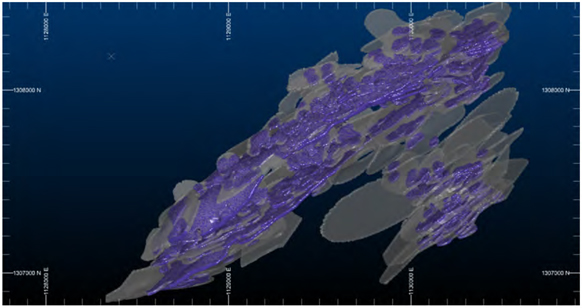
Figure 14.7: Oblique View of Waste Model
| 14.7 | Bulk Density |
During the course of the drilling campaigns between 2006 and 2016, density measurements have been taken routinely at the Project. A review of the density measurements against time suggests that the methodology employed at Soto Norte has changed in its accuracy over time. Of particular interest is the period from January to August 2012 when a significant number of readings appear anomalously high. This changed in September 2012 and since this point no readings greater than 3.5 g/cm3 have been recorded.
| Effective Date January 1, 2021 | Aris Gold | |||
| Page 159 of 384 |
| SRK Consulting | Soto Norte NI 43-101– Feasibility Study |
It is reported during this time period that AUX focused the drilling in the higher-grade areas of the Mascota main vein, in an attempt to up-grade the confidence in the Mineral Resource estimate. It is noted within these areas the sulphide contents are generally higher and could have resulted in a higher density bias during this period.
SRK has not removed any readings taken during times of potentially poor accuracy (Figure 14.8), given the potential association with geological variability within the deposit and likely smoothing of any sampling anomalies based on SRK’s application of density to the model as discussed in this Section.
SRK has undertaken a regression analysis (Fe% to density) to the assignment of density in the final models which limits the potential impact of the anomalous data during this time period. During the analysis, SRK checked the impact on the regression formula to the application of a cap on the density values, which indicated limited changes to the overall equations, however, SRK suggests a review of these readings be reviewed to assess whether any relationship exists between these samples and drilling in areas of higher pyrite content during this period.
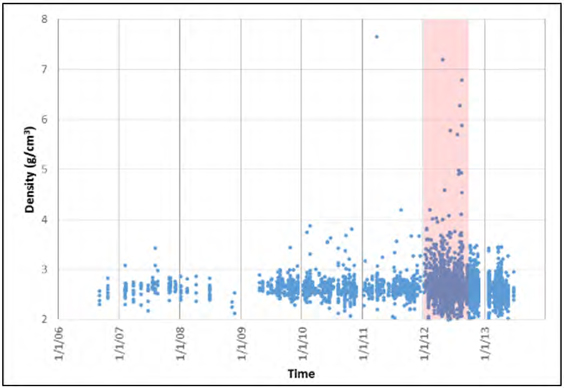
Figure 14.8: Bulk Density Measurements Over Time
Since the site visit (in 2016), the density sampling methodology was revised to fit with generally considered industry best practice. SRK reviewed the procedures used by Minesa as part of the 2016 site inspection and confirmed the current procedures as acceptable. To ensure the high-grade density values have limited impact, SRK reviewed the statistics for the domained database using a capping level of 4.5 g/cm3 on the density values, which resulted in negligible differences in the mean-grades but does reduce the standard deviation of the populations.
SRK reviewed the density data both statistically and visually prior to defining the best methodology to estimate density in the final models. SRK considered two methods to validate the assignment of density in the final block model which, included:
| Effective Date January 1, 2021 | Aris Gold | |||
| Page 160 of 384 |
| SRK Consulting | Soto Norte NI 43-101– Feasibility Study |
| ● | Estimation of the density values on a vein-by-vein basis |
| ● | Establishing a correlation between density values and the larger complete assay database. |
In the database provided to SRK, a total of 9,517 density measurements have been completed in the laboratory following standardised procedures. The initial review of the spatial distribution indicated a reasonable coverage over the strike of the deposit. When compared to the assay database, the proportion of density values remains low in comparison (approximately 2.5%). The distribution of the density measurements is shown in Figure 14.9,and shows that the density values typically vary between 2.6 and 3.0 g/cm3.
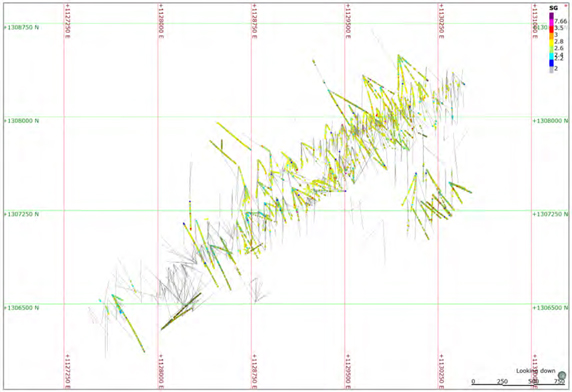
Figure 14.9: Plan of Bulk Density Sample Locations
Table 14.3: Bulk Density Summary Statistics of Main Vein Domains
| Vein |
Samples |
Minimum (g/cm3) |
Maximum (g/cm3) |
Mean (g/cm3) |
Standard Deviation (g/cm3) |
CV |
Variance |
50% (g/cm3) |
97.50% (g/cm3) |
99% (g/cm3) | ||||||||||
| Other |
8505 | 2 | 4.15 | 2.62 | 0.17 | 0.06 | 0.03 | 2.61 | 2.98 | 3.19 | ||||||||||
| 100 | 318 | 2.06 | 4.44 | 2.72 | 0.23 | 0.08 | 0.05 | 2.7 | 3.32 | 3.46 | ||||||||||
| 200 | 92 | 2.2 | 3.81 | 2.74 | 0.27 | 0.1 | 0.07 | 2.72 | 3.46 | 3.74 | ||||||||||
| 300 | 33 | 2.57 | 3.99 | 2.77 | 0.24 | 0.09 | 0.06 | 2.75 | 3.1 | 3.54 | ||||||||||
| 400 | 45 | 2.46 | 3.04 | 2.7 | 0.13 | 0.05 | 0.02 | 2.7 | 2.91 | 2.99 | ||||||||||
| 500 | 25 | 2.58 | 3.17 | 2.74 | 0.16 | 0.06 | 0.03 | 2.71 | 3.05 | 3.12 | ||||||||||
| 600 | 23 | 2.36 | 3.17 | 2.77 | 0.22 | 0.08 | 0.05 | 2.71 | 3.09 | 3.14 | ||||||||||
| 700 | 29 | 2.5 | 3.63 | 2.91 | 0.36 | 0.12 | 0.13 | 2.83 | 3.57 | 3.61 | ||||||||||
| 800 | 20 | 2.36 | 3.04 | 2.62 | 0.18 | 0.07 | 0.03 | 2.62 | 2.98 | 3.01 | ||||||||||
| 900 | 10 | 2.42 | 2.73 | 2.58 | 0.15 | 0.06 | 0.02 | 2.55 | 2.72 | 2.73 | ||||||||||
| 1000 | 23 | 2.34 | 2.87 | 2.63 | 0.16 | 0.06 | 0.02 | 2.65 | 2.86 | 2.87 | ||||||||||
| 1100 | 3 | 2.67 | 2.95 | 2.82 | 0.12 | 0.04 | 0.01 | 2.76 | 2.94 | 2.95 | ||||||||||
| 1200 | 13 | 2.52 | 3.69 | 2.9 | 0.46 | 0.16 | 0.21 | 2.86 | 3.47 | 3.6 | ||||||||||
| 1300 | 11 | 2.46 | 2.96 | 2.68 | 0.22 | 0.08 | 0.05 | 2.66 | 2.91 | 2.94 | ||||||||||
| 1400 | 11 | 2.31 | 2.82 | 2.7 | 0.16 | 0.06 | 0.03 | 2.71 | 2.82 | 2.82 | ||||||||||
| 1500 | 11 | 2.5 | 3.18 | 2.77 | 0.32 | 0.12 | 0.1 | 2.69 | 3.15 | 3.17 |
| Effective Date January 1, 2021 | Aris Gold | |||
| Page 161 of 384 |
| SRK Consulting | Soto Norte NI 43-101– Feasibility Study |
During the statistical review of the density measurements and the assay results from the database, SRK identified a general trend of higher density associated with higher Fe grade (Figure 14.10). The relationship indicates a strong relationship between the pyrite content and higher density. Given the lack of detailed vein sampling and the presence of skewed high-density values, it is SRK’s opinion that completing a regression analysis of the density to Fe values, will provide a reasonable level of confidence in the density of any block. SRK notes that by doing this there may likely be local variations in the density values compared to measured density values, but the average over larger areas should be within reasonable levels of tolerance.
SRK noted that there are different levels of pyrite within the different vein groupings. SRK therefore has completed a linear regression analysis for each vein grouping. SRK considers given the strong relationships established that a linear regression between density and Fe% will provide the best estimate of densities in the final models. SRK therefore has completed a linear regression analysis by domain groups, to define a series of equations:
| ● |
Domain 100: |
density=2.582+(0.025*Fe%) | ||
| ● |
Domain 200: |
density=2.475+(0.044* Fe%) | ||
| ● |
Domains 300 to 1500: |
density=2.538+(0.039* Fe%) | ||
| ● |
Domains 2100 to 5200: |
density=2.563+(0.032* Fe%) | ||
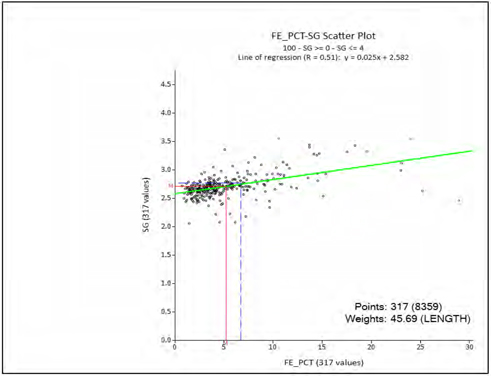
Figure 14.10: Scatter Plot and Regression Formula of Sample Bulk Density and Fe% Grade in Mascota Main Vein
| 14.8 | Mineral Resource Estimation Methodology |
| 14.8.1 | Introduction |
The Mineral Resource Evaluation methodology for the Soto Norte Project was as follows:
| Effective Date January 1, 2021 | Aris Gold | |||
| Page 162 of 384 |
| SRK Consulting | Soto Norte NI 43-101– Feasibility Study |
| ● | Database verification |
| ● | Construction of gold mineralisation wireframe models |
| ● | Definition of estimation domains |
| ● | Preparation of data for geostatistical analysis and variography (capping and compositing) |
| ● | Block modelling and grade interpolation |
| ● | Resource classification and validation |
| ● | Assessment of, “reasonable prospects for economic extraction” and selection of appropriate cut-off grade |
| ● | Tabulation of Mineral Resources. |
The drillhole data were imported and validated in Leapfrog™ and Datamine Studio RM Mining (Datamine) software, which was subsequently used for the geological modelling and Mineral Resource estimation processes, respectively. The statistics and geostatistics have been completed in Datamine, Snowden Supervisor and Phinar X10 Geo and the selected parameters have been entered into Datamine for the interpolation of grade estimates and compilation of the final model.
| 14.8.2 Composite | Strategy |
High grade capping is undertaken where data are no longer considered to be part of the main population. Analysis of log probability plots and raw and log histograms can be used to distinguish the grades at which samples have significant impacts on the local estimation and whose affect is considered extreme.
Based on the sampling database provided, SRK has imported the domain samples into Snowden Supervisor software (Supervisor) and completed a statistical analysis to determine suitable composite lengths. To define the optimum length, SRK tested statistics at 1 to 5 m intervals for comparison (Table 14.4). SRK selected composite intervals of 3 m for the final grade estimation which is considered appropriate for the selected block size.
The vein intercepts were composited to an interval length of 3 m with Datamine using an internal function (MODE=1), forcing all samples to be included within composites. The method adjusts the composite length to ensure all samples are included, while keeping the length as close as possible to the selected compositing length.
The maximum possible composite length is 4.5 m, with a minimum composite of 0.25 m selected. If a vein intercept is a single individual sample, then its length remains unchanged by the process.
Table 14.4: Gold Statistics by Composite Length for Mascota Main Vein
| Composite Length (m) |
Minimum Composite (m) |
Count | Maximum (g/t Au) |
Minimum (g/t Au) |
Mean |
Standard Deviation |
Coefficient of variance (%) | |||||||
| (g/t Au) | ||||||||||||||
| Raw samples | 7288 | 0.01 | 2,300.00 | 8.34 | 40.26 | 4.83 | ||||||||
| 1 | 0 | 6733 | 0.01 | 2,252.46 | 8.46 | 39.22 | 4.64 | |||||||
| 1 | 0.25 | 6732 | 0.01 | 2,252.46 | 8.46 | 39.22 | 4.64 | |||||||
| 1 | 0.5 | 6729 | 0.01 | 2,252.46 | 8.46 | 39.23 | 4.64 | |||||||
| 1 | 0.75 | 6718 | 0.01 | 2,252.46 | 8.47 | 39.26 | 4.64 | |||||||
| 2 | 0 | 3418 | 0.01 | 1,444.39 | 8.39 | 32.76 | 3.9 | |||||||
| 2 | 0.5 | 3415 | 0.01 | 1,444.39 | 8.4 | 32.77 | 3.9 | |||||||
| 2 | 1 | 3397 | 0.01 | 1,444.39 | 8.43 | 32.86 | 3.9 | |||||||
| 2 | 1.5 | 3353 | 0.01 | 1,444.39 | 8.5 | 33.06 | 3.89 |
| Effective Date January 1, 2021 | Aris Gold | |||
| Page 163 of 384 |
| SRK Consulting | Soto Norte NI 43-101– Feasibility Study |
| Composite Length (m) |
Minimum Composite (m) |
Count | Minimum (g/t Au) |
Maximum (g/t Au) |
Mean |
Standard Deviation |
Coefficient of variance(%) | |||||||
| (g/t Au) | ||||||||||||||
| 3 | 0 | 2290 | 0.03 | 873.92 | 8.27 | 26.73 | 3.23 | |||||||
| 3 | 0.75 | 2279 | 0.03 | 873.92 | 8.3 | 26.8 | 3.23 | |||||||
| 3 | 1.5 | 2228 | 0.03 | 873.92 | 8.42 | 27.08 | 3.22 | |||||||
| 3 | 2.25 | 2198 | 0.03 | 873.92 | 8.48 | 27.26 | 3.21 | |||||||
| 4 | 0 | 1763 | 0.03 | 586.29 | 8.17 | 22.37 | 2.74 | |||||||
| 4 | 1 | 1746 | 0.03 | 586.29 | 8.21 | 22.47 | 2.74 | |||||||
| 4 | 2 | 1689 | 0.03 | 586.29 | 8.39 | 22.82 | 2.72 | |||||||
| 4 | 3 | 1657 | 0.03 | 586.29 | 8.48 | 23.02 | 2.71 | |||||||
| 5 | 0 | 1421 | 0.03 | 586.29 | 8.27 | 22.32 | 2.7 | |||||||
| 5 | 1.25 | 1364 | 0.03 | 586.29 | 8.49 | 22.75 | 2.68 | |||||||
| 5 | 2.5 | 1325 | 0.03 | 586.29 | 8.63 | 23.06 | 2.67 | |||||||
| 5 | 3.75 | 1298 | 0.03 | 586.29 | 8.62 | 23.17 | 2.69 |
| 14.8.3 Estimation Domain Analysis | |
SRK completed a statistical and geostatistical analysis on the coded 3 m composite data to determine the appropriate estimation methods and parameters. The following elements have been considered during the statistical analysis: Au, Ag, Cu, Pb, Zn, S, Fe, As, Bi, Sb, Cd, Hg, Te, Th, and U. High grade capping was applied per domain, based on a combination of log probability plots and raw and log histogram analysis.
To complete the analysis, log histograms and log-probability plots (Figure 14.11) have been checked to test for any breaks or bimodal distributions. Any multiple data populations or distinct high-grade populations maybe identified through the review of these plots. When a top cut was deemed necessary, this was selected at the 99th percentile or at any distinct inflection of the log probability plot. The aim for these caps was to reduce the coefficient of variance (“CV”) to a level considered robust enough (ideally less than 1.5) for an estimation using a technique such as Ordinary Kriging (“OK”).
| Effective Date January 1, 2021 | Aris Gold | |||
| Page 164 of 384 |
| SRK Consulting | Soto Norte NI 43-101– Feasibility Study |
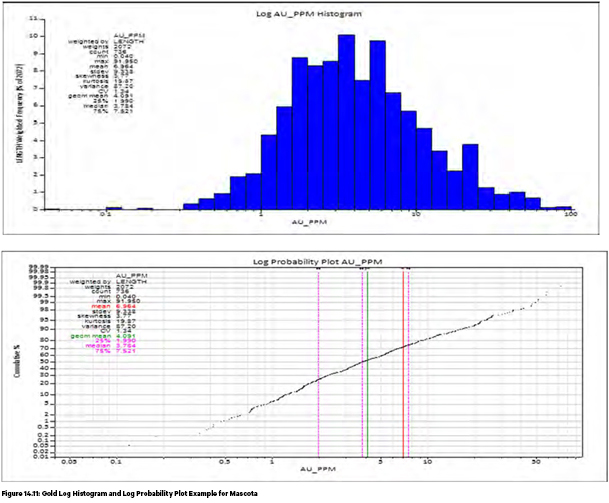
In discussion with the Minesa geologists and external consultants, the decision was taken to break out the mineralisation within the two main domains (100 and 200) into two populations for each of the elements. To achieve this goal, SRK used the log-probability plots and histograms to note possible changes in the trend which were then visualised in Leapfrog™. SRK then used Leapfrog™ to generate a series of indicator grade estimates for each of the elements based on the interpreted changes in trends as shown in Figure 14.12 and Figure 14.13.
Wireframes were generated using an indicator methodology around the selected cut-off grades per element (Figure 14.13). The search ranges have been orientated into the dip and strike of the main veins, with the estimation using a spheroidal interpolant with a nugget of approximately 20 to 25% and ranges in the order of 50 to 150 m.
The analysis of the internal grade distributions was validated within Leapfrog™ by calculating the number of samples above and below cut-off both internal and external to the wireframes (Table 14.5) in additional to the number of samples and the mean grades inside and outside of the interpretation. Minor adjustments have been made to the “ISO Value”, which acts similar to a probability to improve the statistical analysis.
| Effective Date January 1, 2021 | Aris Gold | |||
| Page 165 of 384 |
| SRK Consulting | Soto Norte NI 43-101– Feasibility Study |
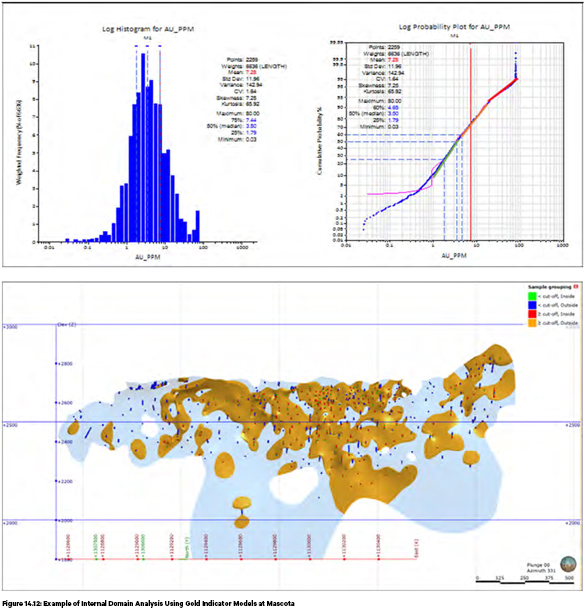
| Effective Date January 1, 2021 | Aris Gold | |||
| Page 166 of 384 |
| SRK Consulting | Soto Norte NI 43-101– Feasibility Study |
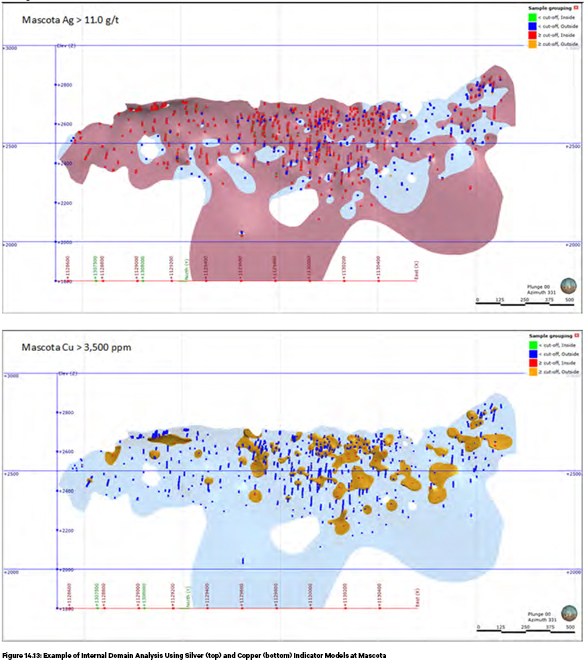
Table 14.5: Indicator Model Comparative Gold Statistics Example
| Indicator Statistics | ||||
| Total Number of Samples |
2,247 | |||
| Cut-Off Value |
4 | |||
| ≥ Cut-Off | < Cut-Off | |||
| Number of Points | 1,067 | 1,360 | ||
| Percentage | 43.96% | 56.04% | ||
| Mean Value | 16.4 | 2 | ||
| Minimum Value | 4 | 0 | ||
| Maximum Value | 930.8 | 4 | ||
| Standard Deviation | 39.9 | 1 | ||
| Coefficient of Variance | 2.4 | 0.5 | ||
| Variance | 15,694.90 | 1 | ||
| Inside | Outside | |||
| ≥ Cut-Off | ||||
| Effective Date January 1, 2021 | Aris Gold | |||
| Page 167 of 384 |
| SRK Consulting | Soto Norte NI 43-101 – Feasibility Study |
| Indicator Statistics | ||||
| Number of Samples | 980 | 87 | ||
| Percentage | 40.38% | 3.58% | ||
| < Cut-Off | ||||
| Number of Samples | 328 | 1,032 | ||
| Percentage | 13.51% | 42.52%% | ||
| All Points | ||||
| Mean Value | 13.2 | 2.6 | ||
| Minimum Value | 0.1 | 0 | ||
| Maximum Value | 930.8 | 77.4 | ||
| Standard Deviation | 36.4 | 4.5 | ||
| Coefficient of Variance | 2.8 | 1.7 | ||
| Variance | 1,327.50 | 20.3 | ||
| Volume | 3,104,095.00 | 3,896,709.00 | ||
| Number of Parts | 15 | 15 | ||
| 14.8.4 | Capping Strategy |
High-grade capping was applied based on a combination of log probability plots, plus raw and log histogram information. SRK has reviewed the capping analysis based on the domain code. The detailed capping analysis was completed using Phinar X-10 Geo statistical packages. SRK has developed templates within the software to enable rapid visual and statistical analysis on histograms and log-probability plots through a variety of techniques which included percentile and disintegration analysis (breaks in the populations). In the percentile analysis, the template initially determines the statistical impact on caps from the 90th to 99th percentile, which SRK has then refined to selected values, or where breaks in the log-probability were identified. An example of the analysis is shown in Figure 14.14.
The statistical analysis included a review of the impact on the mean and variance, plus the proportion of the database capped at any given percentile, and the impact on the total capped and reduction in the CV. An example of the tables used in the analysis are shown in Table 14.6 and Table 14.7. SRK repeated this analysis for each of the domains and for all elements. In the minor veins, a slight modification on the process used a disintegration analysis which provides similar results. Rather than initially assigning percentiles from 90 to 99%, it identifies key gaps in the data or breakdown of the sample populations and provides the equivalent statistical analysis for that phase.
| Effective Date January 1, 2021 | Aris Gold | |||
| Page 168 of 384 |
| SRK Consulting | Soto Norte NI 43-101– Feasibility Study |
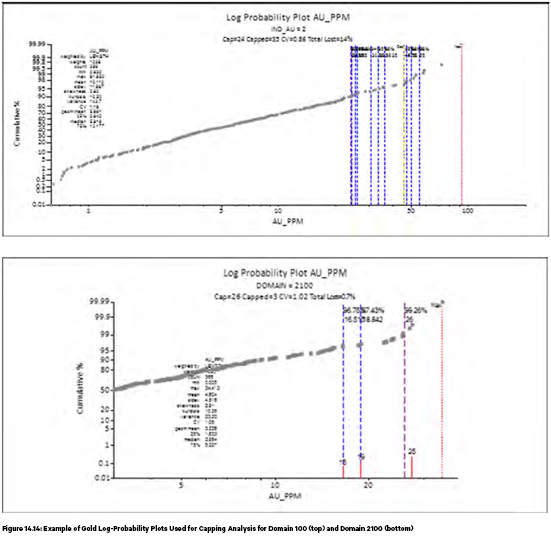
Table 14.6: Example of Gold Statistics Reviewed During Capping Analysis
| Grade | Cap g/t | Capped number |
Percentile | Capped% | Lost Total% |
Lost CV% |
Count | Min | Max | Mean | Variance | CV | ||||||||||||
| Au | 356 | 0.63 | 91.95 | 10.11 | 143.7 | 1.19 | ||||||||||||||||||
| Au | 55 | 4 | 99.0 | 1.1 | 1.7 | 5.9 | 356 | 0.63 | 55 | 9.935 | 122.9 | 1.12 | ||||||||||||
| Au | 50 | 7 | 98.1 | 2.0 | 2.4 | 7.5 | 356 | 0.63 | 50 | 9.865 | 116.9 | 1.1 | ||||||||||||
| Au | 47.5 | 8 | 97.8 | 2.2 | 3.0 | 8.0 | 356 | 0.63 | 47.5 | 9.809 | 112.6 | 1.08 | ||||||||||||
| Au | 46 | 11 | 97.0 | 3.1 | 3.3 | 9.6 | 356 | 0.63 | 46 | 9.769 | 109.7 | 1.07 | ||||||||||||
| Au | 36.25 | 14 | 96.0 | 3.9 | 6.9 | 16 | 356 | 0.63 | 36.25 | 9.408 | 86.93 | 0.99 | ||||||||||||
| Au | 33.5 | 18 | 95.0 | 5.1 | 8.1 | 19 | 356 | 0.63 | 33.5 | 9.277 | 80.27 | 0.97 | ||||||||||||
| Au | 30.66 | 21 | 94.0 | 5.9 | 9.7 | 21 | 356 | 0.63 | 30.66 | 9.116 | 72.85 | 0.94 | ||||||||||||
| Au | 26 | 26 | 92.8 | 7.3 | 13.0 | 25 | 356 | 0.63 | 26 | 8.812 | 61.09 | 0.89 | ||||||||||||
| Au | 25.25 | 28 | 91.9 | 7.9 | 13.0 | 26 | 356 | 0.63 | 25.25 | 8.753 | 59.09 | 0.88 | ||||||||||||
| Au | 24.25 | 32 | 90.9 | 9.0 | 14.0 | 27 | 356 | 0.63 | 24.25 | 8.666 | 56.28 | 0.87 | ||||||||||||
| Au | 24 | 35 | 90.0 | 9.8 | 14.0 | 27 | 356 | 0.63 | 24 | 8.641 | 55.53 | 0.86 | ||||||||||||
| Au | IND_AU = 2 - AU_PPM > 46 | 11 | 46.33 | 91.95 | 56.75 | 197.9 | 0.25 | |||||||||||||||||
| Au | IND_AU = 2 - AU_PPM <= 46 | 345 | 0.63 | 45.73 | 8.584 | 68.76 | 0.97 | |||||||||||||||||
| Effective Date January 1, 2021 | Aris Gold | |||
| Page 169 of 384 |
| SRK Consulting | Soto Norte NI 43-101– Feasibility Study |
Table 14.7: Example of Gold Statistics Reviewed During Disintegration Capping Analysis
| Grade |
Cap | Capped | Percentile | Capped% | Lost | Lost | Count | Min | Max | Mean | Variance | CV | ||||||||||||||||||||||||||
| Total% | CV% | |||||||||||||||||||||||||||||||||||||
| Au |
366 | 0.01 | 34.41 | 4.6 | 23.2 | 1.05 | ||||||||||||||||||||||||||||||||
| Au |
26 | 3 | 98.70 | 0.8 | 0.7 | 3 | 366 | 0.01 | 26 | 4.57 | 21.7 | 1.02 | ||||||||||||||||||||||||||
| Au |
19 | 10 | 97.40 | 2.7 | 4.0 | 13 | 366 | 0.01 | 18.84 | 4.42 | 16.4 | 0.91 | ||||||||||||||||||||||||||
| Au |
17 | 11 | 96.75 | 3.0 | 5.6 | 17 | 366 | 0.01 | 16.52 | 4.35 | 14.4 | 0.87 |
These top cuts were subsequently validated against the number of composites cut along with the proportional change to the population mean in each domain being reviewed. This ensures that these caps do not overly reduce the contained metal/element within the resultant estimate. If a high population mean change is detected, this top cut is revised.
In addition to the Au grades, SRK has reviewed the capping levels for all elements considered for estimation process which included Au, Ag, Cu, Pb, Zn, Fe, S, As, Bi, Sb, Cd, Hg, Te, Th and U.
Table 14.8 provides summary statistics of raw versus capped composites per element for the top 14 veins and shows a comparison of the mean grades within each zone based on the grade capping applied.
In a number of extreme cases, SRK noted that more than two populations existed and that the high grades did not form any spatially constrained areas. These areas would therefore need more consideration during the estimation process. SRK has addressed these areas with use of threshold restrictions where required. These are discussed in more detail in Section 14.8.8 (Estimation).
| Effective Date January 1, 2021 | Aris Gold | |||
| Page 170 of 384 |
| SRK Consulting | Soto Norte NI 43-101– Feasibility Study |
Table 14.8: Summary of Raw vs Capped Composites for Major Veins
|
Element |
Vein | Raw Samples | Composites | Difference | ||||||||||||||||||||||||
|
FIELD |
Name | NRECORDS | MINIMUM | MAXIMUM | MEAN | STANDDEV | CoV | NRECORDS | Minimum | Maximum | Mean | Std Dev. | CoV | (%) | ||||||||||||||
|
AG_PPM AU_PPM CU_PPM |
G1 G1 G1 |
2269 2269 2269 |
0.1 0.0 4.7 |
3,940 | 37.33 | 108.4 | 2.90 | 767 | 0.36 | 500.00 | 34.76 | 49.0 | 1.41 | -6.9 | ||||||||||||||
| 311 | 6.95 | 14.2 | 2.04 | 767 | 0.02 | 60.00 | 6.59 | 8.6 | 1.31 | -5.2 | ||||||||||||||||||
| 175,500 | 2,566.34 | 6,462.2 | 2.52 | 767 | 12.92 | 17,500.00 | 2,361.25 | 3571.5 | 1.51 | -8.0 | ||||||||||||||||||
|
AG_PPM AU_PPM CU_PPM |
G2 G2 G2 |
753 753 753 |
0.0 0.0 18.5 |
2,880 | 47.03 | 132.9 | 2.83 | 236 | 0.60 | 185.00 | 39.05 | 43.4 | 1.11 | -17.0 | ||||||||||||||
| 154 | 5.23 | 10.3 | 1.96 | 236 | 0.24 | 20.00 | 4.51 | 4.5 | 1.00 | -13.8 | ||||||||||||||||||
| 112,500 | 3,044.76 | 7,692.8 | 2.53 | 236 | 47.35 | 22,100.00 | 2,778.77 | 4379.5 | 1.58 | -8.7 | ||||||||||||||||||
|
AG_PPM AU_PPM CU_PPM |
G3 G3 G3 |
251 251 251 |
0.1 0.1 4.3 |
380 | 37.93 | 57.1 | 1.50 | 86 | 0.13 | 182.69 | 35.04 | 42.2 | 1.21 | -7.6 | ||||||||||||||
| 92 | 8.67 | 15.2 | 1.75 | 86 | 0.75 | 25.00 | 6.63 | 7.1 | 1.07 | -23.6 | ||||||||||||||||||
| 81,200 | 4,149.28 | 8,647.9 | 2.08 | 86 | 5.00 | 14,250.00 | 3,337.88 | 4500.8 | 1.35 | -19.6 | ||||||||||||||||||
|
AG_PPM AU_PPM CU_PPM |
G4 G4 G4 |
174 174 174 |
0.0 0.0 0.1 |
148 | 14.97 | 25.4 | 1.70 | 59 | 0.87 | 35.00 | 11.93 | 11.9 | 1.00 | -20.3 | ||||||||||||||
| 107 | 5.85 | 10.5 | 1.80 | 59 | 0.60 | 20.00 | 5.15 | 4.8 | 0.93 | -12.0 | ||||||||||||||||||
| 18,140 | 785.81 | 1,829.1 | 2.33 | 59 | 20.00 | 2,445.00 | 680.01 | 782.7 | 1.15 | -13.5 | ||||||||||||||||||
|
AG_PPM AU_PPM CU_PPM |
G9 G9 G9 |
240 240 240 |
1.2 | 562 | 44.39 | 75.6 | 1.70 | 88 | 1.18 | 161.00 | 38.72 | 43.1 | 1.11 | -12.8 | ||||||||||||||
| 0.1 | 55 | 2.98 | 4.7 | 1.58 | 88 | 0.82 | 10.60 | 2.69 | 2.2 | 0.83 | -9.7 | |||||||||||||||||
| 40.0 | 106,000 | 4,238.67 | 12,325.1 | 2.91 | 88 | 102.55 | 2,000.00 | 1,143.31 | 604.5 | 0.53 | -73.0 | |||||||||||||||||
|
AG_PPM AU_PPM CU_PPM |
M1 M1 M1 |
7176 7176 7176 |
0.0 | 1,500 | 51.92 | 101.8 | 1.96 | 2259 | 0.14 | 550.00 | 51.89 | 77.4 | 1.49 | -0.1 | ||||||||||||||
| 0.0 | 2,300 | 8.42 | 40.6 | 4.82 | 2259 | 0.03 | 80.00 | 7.20 | 11.8 | 1.65 | -14.5 | |||||||||||||||||
| 1.0 | 80,720 | 2,524.04 | 5,388.1 | 2.13 | 2259 | 17.79 | 21,250.00 | 2,396.26 | 3597.6 | 1.50 | -5.1 | |||||||||||||||||
|
AG_PPM AU_PPM CU_PPM |
M13 M13 M13 |
565 565 565 |
0.1 | 483 | 42.21 | 65.7 | 1.56 | 178 | 0.51 | 155.00 | 36.16 | 38.1 | 1.05 | -14.3 | ||||||||||||||
| 0.0 | 169 | 9.00 | 15.4 | 1.72 | 178 | 0.04 | 44.50 | 8.01 | 8.8 | 1.10 | -11.0 | |||||||||||||||||
| 8.4 | 59,490 | 2,847.20 | 5,954.9 | 2.09 | 178 | 54.39 | 8,830.00 | 2,107.07 | 2507.7 | 1.19 | -26.0 | |||||||||||||||||
|
AG_PPM AU_PPM CU_PPM |
M15 M15 M15 |
418 418 418 |
0.1 | 617 | 20.25 | 49.6 | 2.45 | 142 | 0.69 | 85.00 | 19.13 | 20.2 | 1.06 | -5.5 | ||||||||||||||
| 0.0 | 84 | 7.20 | 11.4 | 1.58 | 142 | 0.50 | 46.00 | 7.20 | 8.8 | 1.22 | 0.0 | |||||||||||||||||
| 10.8 | 39,740 | 1,166.45 | 3,326.0 | 2.85 | 142 | 18.18 | 6,300.00 | 1,008.36 | 1296.9 | 1.29 | -13.6 | |||||||||||||||||
|
AG_PPM AU_PPM CU_PPM |
M2 M2 M2 |
194 194 194 |
0.3 | 233 | 27.27 | 46.4 | 1.70 | 72 | 0.79 | 84.00 | 22.61 | 24.2 | 1.07 | -17.1 | ||||||||||||||
| 0.2 | 141 | 7.52 | 14.4 | 1.92 | 72 | 0.58 | 12.50 | 5.00 | 3.6 | 0.72 | -33.5 | |||||||||||||||||
| 10.0 | 28,700 | 2,358.91 | 4,831.0 | 2.05 | 72 | 10.00 | 14,615.00 | 2,319.32 | 3389.2 | 1.46 | -1.7 | |||||||||||||||||
|
AG_PPM AU_PPM CU_PPM |
M24 M24 M24 |
373 373 373 |
0.3 | 149 | 14.54 | 21.9 | 1.51 | 128 | 0.65 | 45.00 | 12.94 | 12.1 | 0.94 | -11.0 | ||||||||||||||
| 0.1 | 151 | 4.10 | 9.8 | 2.39 | 128 | 0.20 | 14.00 | 3.53 | 3.2 | 0.90 | -14.0 | |||||||||||||||||
| 10.0 | 19,450 | 912.58 | 2,247.9 | 2.46 | 128 | 10.00 | 6,150.00 | 821.22 | 1295.9 | 1.58 | -10.0 | |||||||||||||||||
|
AG_PPM AU_PPM CU_PPM |
M3 M3 M3 |
1037 1037 1037 |
0.2 | 1,360 | 35.62 | 86.8 | 2.44 | 359 | 1.00 | 860.00 | 35.05 | 71.0 | 2.03 | -1.6 | ||||||||||||||
| 0.0 | 153 | 6.17 | 14.5 | 2.34 | 359 | 0.23 | 48.00 | 5.29 | 7.9 | 1.49 | -14.4 | |||||||||||||||||
| 10.0 | 92,123 | 2,334.58 | 5,429.3 | 2.33 | 359 | 10.00 | 92,122.90 | 2,392.65 | 5738.6 | 2.40 | 2.5 | |||||||||||||||||
|
AG_PPM AU_PPM CU_PPM |
M4 M4 M4 |
634 634 634 |
0.0 | 828 | 41.89 | 69.3 | 1.65 | 210 | 0.66 | 190.00 | 40.18 | 41.2 | 1.03 | -4.1 | ||||||||||||||
| 0.0 | 195 | 7.37 | 12.7 | 1.73 | 210 | 0.39 | 38.00 | 7.05 | 6.8 | 0.97 | -4.3 | |||||||||||||||||
| 1.0 | 97,100 | 2,378.02 | 5,461.1 | 2.30 | 210 | 12.26 | 15,350.00 | 2,299.02 | 3018.9 | 1.31 | -3.3 | |||||||||||||||||
|
AG_PPM AU_PPM CU_PPM |
M6 M6 M6 |
354 354 354 |
0.6 | 1,275 | 103.07 | 148.1 | 1.44 | 115 | 0.64 | 696.73 | 110.43 | 120.3 | 1.09 | 7.1 | ||||||||||||||
| 0.0 | 17 | 1.51 | 2.6 | 1.72 | 115 | 0.01 | 5.70 | 1.29 | 1.4 | 1.07 | -14.3 | |||||||||||||||||
| 46.9 | 9,480 | 883.10 | 1,027.7 | 1.16 | 115 | 81.25 | 2,600.00 | 855.08 | 637.2 | 0.75 | -3.2 | |||||||||||||||||
|
AG_PPM AU_PPM CU_PPM |
M62 M62 M62 |
190 190 190 |
0.0 | 111 | 9.58 | 18.7 | 1.95 | 66 | 0.54 | 53.00 | 9.79 | 14.0 | 1.43 | 2.1 | ||||||||||||||
| 0.0 | 26 | 4.35 | 4.3 | 0.99 | 66 | 0.35 | 11.50 | 3.89 | 2.8 | 0.73 | -10.6 | |||||||||||||||||
| 1.0 | 16,250 | 1,229.81 | 2,807.2 | 2.28 | 66 | 29.16 | 4,975.00 | 1,097.73 | 1623.7 | 1.48 | -10.7 | |||||||||||||||||
|
AG_PPM AU_PPM CU_PPM |
N1 N1 N1 |
1030 1030 1030 |
0.0 | 512 | 26.83 | 57.1 | 2.13 | 316 | 0.12 | 140.00 | 23.90 | 34.5 | 1.44 | -10.9 | ||||||||||||||
| 0.0 | 476 | 5.66 | 18.8 | 3.32 | 316 | 0.02 | 35.00 | 4.71 | 7.4 | 1.56 | -16.8 | |||||||||||||||||
| 2.7 | 26,310 | 1,526.64 | 3,370.7 | 2.21 | 316 | 13.12 | 12,730.00 | 1,448.11 | 2433.3 | 1.68 | -5.1 | |||||||||||||||||
| Effective Date January 1, 2021 | Aris Gold | |||
| Page 171 of 384 |
| SRK Consulting | Soto Norte NI 43-101– Feasibility Study |
14.8.5 Grade Correlations
The Figure 14.15 and Figure 14.16 show the correlation (Dendograms), by way of example, between the different elements in domains 100 and 200.
The S/Fe correlation in the Mascota Vein (Domain 100) is lower in comparison to the Gigante Vein (Domain 200), where this correlation is very strong.
The Ag/Hg correlation in Mascota vein is higher than in Gigante, where Ag has stronger correlation with As, Sb and Cu. In both domains the Cd/Zn correlation is very high.
SRK considers further work on the correlation between elements will assist in the development of a geo-metallurgical studies and modelling as part of future updates.
Given the nature of mineralisation and potential implications on recovery or associated impurities, this should be considered at Soto Norte.
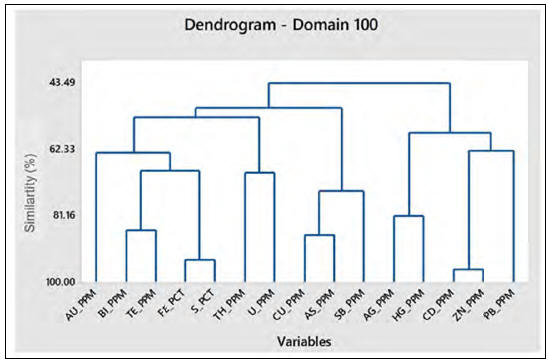
Figure 14.15: Dendogram of Mascota Vein
| Effective Date January 1, 2021 | Aris Gold | |||
| Page 172 of 384 |
| SRK Consulting | Soto Norte NI 43-101– Feasibility Study |
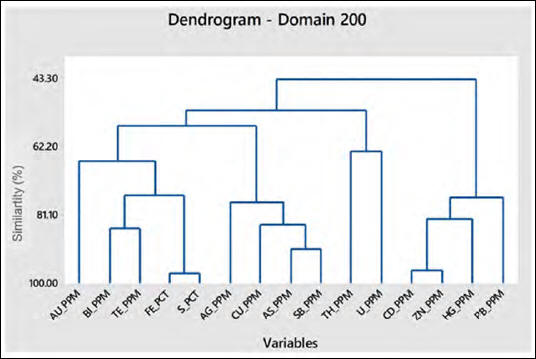
Figure 14.16: Dendrogram of Gigante Vein
14.8.6 Variography
Variography is the study of the spatial variability of an attribute (in this case multiple elements). Supervisor and Datamine Studio 3 software were used for geostatistical analysis for the Project (Figure 14.17 and Figure 14.18).
In order to define variograms of sufficient clarity for modelling, SRK initially considered using a traditional anisotropic variograms, but the resultant studies demonstrated relatively poor variogram structures existed, which is not atypical for vein style deposits at exploration drill-spacings. As a result, SRK has relied upon a combination of Pairwise Relative Variogram, Correlograms or covariance charts in the software to define the models.
In completing the analysis, the following has been considered for each of the domains and key elements:
| ● | Azimuth and dip of each zone was determined |
| ● | The down-hole variogram was calculated and modelled to characterise the nugget effect |
| ● | Experimental Variogram/Pairwise Relative semi-variograms/Correlograms/Covariance were calculated to determine omnidirectional and directional variograms for the along strike, cross strike and down-dip directions |
| ● | Directional and omnidirectional variograms were modelled using the nugget and sill defined in the downhole variography, and the ranges for the along strike, cross strike and down-dip directions |
| ● | All variances were re-scaled to the appropriate sill |
| ● | Variograms have been created based on the domain coding, for all elements: Au, Ag, Cu, Pb, Zn, Fe, S, As, Bi, Sb, Cd, Hg, Te, Th, U. |
| Effective Date January 1, 2021 | Aris Gold | |||
| Page 173 of 384 |
| SRK Consulting | Soto Norte NI 43-101– Feasibility Study |
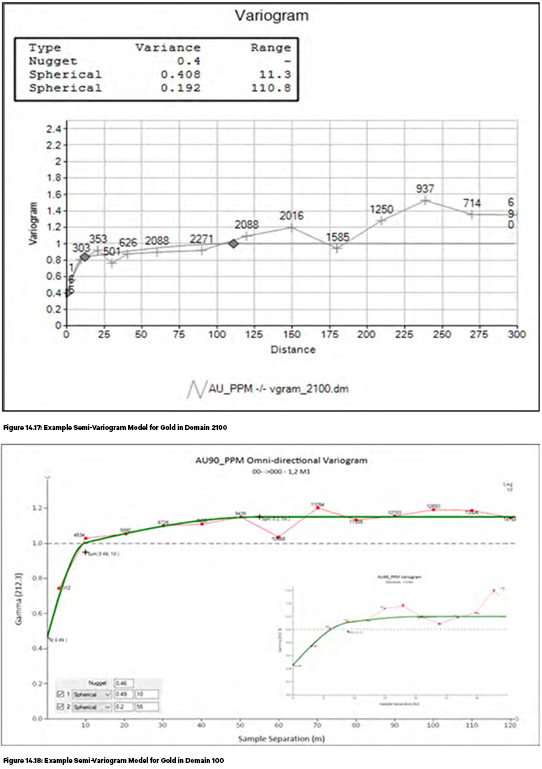
14.8.7 Block Model Parameters
SRK initially created a 3D interpretation and geological block model in real space; however, due to the orientation of the mineralisation striking towards the northeast, the decision was made to rotate the database through 330º into a west-east local grid orientation. To rotate the interpretation, the “CDTRAN” Datamine command has been used based on the parameters shown in Table 14.9.
| Effective Date January 1, 2021 | Aris Gold | |||
| Page 174 of 384 |
| SRK Consulting | Soto Norte NI 43-101– Feasibility Study |
A regularised block size of 10 x 3 x 10 m (X-Y-Z) was selected given that it ensures that narrow vein bodies are appropriately captured and allows for an appropriate level of grade selectivity for underground mine planning and optimisation. This block size is considered reasonable for the drill density observed across the centre of both the Mascota and Gigante vein systems. SRK does note that in the outer areas of the model the block size is relatively small compared to the sample spacing, and therefore should be considered during the classification process as having lower confidence in the level of selectivity presented.
Table 14.9:Block Model Parameters
| Axis | Origin | Local Origin |
Rotation | Block Size (m) |
Sub-Block (m) |
Number of Blocks |
Comments | |||||||||||||||||
| X |
1128600 | 0 | 10 | 2.5 | 310 | |||||||||||||||||||
| Y |
1305800 | 0 | 3 | 0.5 | 700 | |||||||||||||||||||
| Z |
1600 | 0 | 330 | ° | 10 | 1 | 150 | Axis 3 (Datamine) | ||||||||||||||||
In order to reflect the volumes of the geological model as accurately as possible, SRK has made use of sub-blocking within Datamine with the minimum sub-block set to 2.5 x 0.5 x 1.0 m (X-Y-Z). SRK tested the use of larger and smaller sub-blocking and opted for the current selection in an attempt to balance the file size of the block models versus marginal gains in the accuracy of the wireframe volumes versus the combined block volumes.
shows the numeric comparison between wireframes and blocks of all the domains. SRK also completed a visual comparison between the geological model (solids or wireframes) and the block model to ensure a good fit for the equivalent domains.
It is SRK’s opinion that the block model volumes accurately reflect the interpreted geological domains and are appropriate to be used for the basis of the Mineral Resource estimates.
Table 14.10: Volume Comparison Between Wireframes and Block Models
| Domain | Wireframe Volume (m3) | Block Volume (m3) | % Difference | |||
| 100 (Mascota Main Vein) |
6,974,700 | 7,000,414 | 0.37 | |||
| 200 (Gigante Main Vein) |
3,840,200 | 3,836,270 | -0.10 | |||
| 300 | 851,880 | 852,053 | 0.02 | |||
| 400 | 2,823,364 | 2,813,123 | -0.36 | |||
| 500 | 1,153,100 | 1,152,555 | -0.05 | |||
| 600 | 336,690 | 336,505 | -0.05 | |||
| 700 | 798,740 | 798,340 | -0.05 | |||
| 800 | 188,260 | 187,431 | -0.44 | |||
| 900 | 437,100 | 437,081 | 0.00 | |||
| 1000 | 571,060 | 571,000 | -0.01 | |||
| 1100 | 394,690 | 395,750 | 0.27 | |||
| 1200 | 373,220 | 372,390 | -0.22 | |||
| 1300 | 206,340 | 204,953 | -0.67 | |||
| 1400 | 247,070 | 246,995 | -0.03 | |||
| 1500 | 351,350 | 351,016 | -0.09 | |||
| 2100 | 734,230 | 733,431 | -0.11 | |||
| 2150 | 304,653 | 303,916 | -0.24 | |||
| 2200 | 305,713 | 305,604 | -0.04 | |||
| 2250 | 156,047 | 156,179 | 0.08 | |||
| 2300 | 244,025 | 243,668 | -0.15 | |||
| 2350 | 370,263 | 369,954 | -0.08 | |||
| 2400 | 647,947 | 643,906 | -0.62 | |||
| 2500 | 219,396 | 219,370 | -0.01 | |||
| 2600 | 159,172 | 157,166 | -1.26 | |||
| 3100 | 259,794 | 259,074 | -0.28 | |||
| 3200 | 20,769 | 20,761 | -0.04 | |||
| 3300 | 406,926 | 406,093 | -0.20 | |||
| 3400 | 304,502 | 302,484 | -0.66 |
| Effective Date January 1, 2021 | Aris Gold | |||
| Page 175 of 384 |
| SRK Consulting | Soto Norte NI 43-101– Feasibility Study |
| Domain | Wireframe Volume (m3) | Block Volume (m3) | % Difference | |||
| 3500 |
857,416 | 864,971 | 0.88 | |||
| 3600 |
359,530 | 359,271 | -0.07 | |||
| 4100 | 1,293,191 | 1,292,698 | -0.04 | |||
| 4200 | 1,009,834 | 1,007,926 | -0.19 | |||
| 4300 | 330,856 | 330,206 | -0.20 | |||
| 5100 | 1,645,431 | 1,643,265 | -0.13 | |||
| 5200 | 2,478,274 | 2,476,856 | -0.06 | |||
| Total | 31,655,732 | 31,652,674 | -0.01 |
| 14.8.8 Estimation |
SRK has undertaken variography in Supervisor and Datamine Studio 3 for all domains based on the domain code and the 3 m composited, capped drillhole files. The resulting variogram ranges were used in the estimation process as a guide to the dominant direction of mineralisation and search ranges. Quantitative Kriging Neighbourhood Analysis (“QKNA”) was undertaken to determine the optimum parameters to be used in the estimation based on results from the Mascota Main and Gigante domains. QKNA compared search ranges and differing minimum and maximum samples with respect to the volume, slope of regression and percent of blocks filled in each search.
While SRK has grouped data and veins into a number of key domains, each vein within the block model and the associated composites from the wireframes were coded individually. This process has been done to ensure that each vein block was interpolated with their own data and avoid using composites of other veins in the same domain. This method has avoided any potential for cross contamination of composites in the estimation processes.
With regards to search ellipse orientation, given the variability in the vein orientations within the different groupings, SRK has decided to use Datamine’s dynamic anisotropy function. This method uses average dip and dip orientation estimated for each block, which acts as the primary orientation for the predefined search ranges.
SRK also completed an estimate using IDW2 and Nearest Neighbour (“NN”) methodologies for verification purposes for Au, Ag, and Cu. Final grades have been estimated using the parameters determined from QKNA and orientation study using OK in the majority of the veins and IDW2 in some domains where it was found to be the more suitable option based on comparative statistics. Statistical characteristics such as kriging variances, number of samples used in an estimate, etc, are also stored in each individual block for descriptive evaluations.
Main Veins (Domains 100 and 200)
As discussed in Section 14.8.3, sub-domaining wireframes have been used for all the elements within the main Mascota (Domain 100) and Gigante (Domain 200) veins, using Leapfrog™ Indicator RBF Interpolants. The interpolants are based solely on grade at locations where potential breaks in the log-probability plots exist. SRK has not completed any detailed study which could reflect potential changes in the minerology at this stage, as it has not currently been fully defined, but with further investigation and correlation of the main minerology/rock-types domaining might possibly be improved further. This could potentially lead to further confidence in the metallurgical conditions and provide input to a geo-metallurgical block model in the future.
In addition to the domaining, Minesa and SRK noted during review, the presence of high grades within the sample populations which could risk over-estimation on a local scale of the Mineral Resources.
During 2018, SRK completed a sensitivity analysis (using the 2017 PFS geological model as the basis) on
| Effective Date January 1, 2021 | Aris Gold | |||
| Page 176 of 384 |
| SRK Consulting | Soto Norte NI 43-101– Feasibility Study |
the potential impact of these high-grade zones (Figure 14.19). The study included setting up search ranges around high-grade intersections (>30 g/t Au) at 10 m increments from any individual high-grade composite. The results showed there was an influence on the use of using high grades which could potentially increase the average grades for blocks estimated using high-grade samples beyond a 50 m range. The difference in using the restriction between 10 to 50 m only influenced the mean grade of the Mascota vein by less than 10%.
SRK acknowledged that the influence over 50 m maybe considered higher risk which has therefore been addressed in the current model. SRK has selected a range of influence of the higher 90 g/t Au capping of 30 m for its recommendation for the limit of influence of any high-grade samples. The main basis for this is that the target drill spacing is in the order of 50 x 50 m and should therefore allow the influence of the sampling to approximate half the drill spacing. Table 14.11 presents a summary of the gold and silver cut-off used for the sub-domaining and the gold high-grade restriction used in Mascota and Gigante main veins.
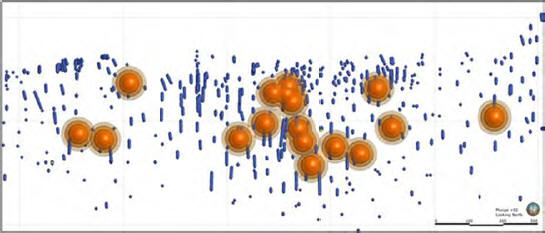
Figure 14.19: Long Section of Mascota Vein Showing Areas of Influence from 10 to 50 m Around High-Grade Gold Grades
Table 14.11: Cut-Off Grades used in Sub Domaining and High-Grade Gold Restriction in Mascota and Gigante Main Veins
| Domain |
Indicator Domain |
Cut-Off Grade (Sub-Domaining) |
High-Grade Restriction | |||||||
| Au (g/t) | Ag (g/t) | Cu (ppm) | ||||||||
| 100 (Mascota |
Low | 30 | 25 | 6,000 | ||||||
| Main Vein) |
High | 90 | 300 | 21,500 | 30 | |||||
| 200 (Gigante |
Low | 25 | 32.5 | 2,600 | ||||||
| Main Vein) |
High | 45 | 210 | 20,250 | 25 | |||||
SRK completed test work to optimise the estimation search ranges and test the sensitivity on the selected estimation methods for the two main domains. During the investigation, SRK elected to use Datamine’s Dynamic Anisotropy for all veins. As part of the dynamic anisotropy, SRK has completed an estimate of the average dip and dip directions for each block based on the wireframe triangles used to define each vein. The dip and dip direction are then estimated by searching with a 75 m isotropic search orientation with a maximum of 10 triangles used for each block. The resultant estimates were visually verified prior to any grade estimates and were deemed to be representative of the underlying geological conditions.
SRK has selected search ranges with consideration to the geological continuity demonstrated from the variography. SRK has not elected to use the final variogram ranges as this would likely result in different
| Effective Date January 1, 2021 | Aris Gold | |||
| Page 177 of 384 |
| SRK Consulting | Soto Norte NI 43-101– Feasibility Study |
numbers of blocks being estimated for the different elements. In the two main veins, the first search is typically between 35 and 50 m. A nested three pass search neighbourhood has been used for both the veins with the number of samples, both for maximum and minimum, being reduced in the final search volumes. The third pass searches are limited in the order of 175 m to limit the potential to push estimates beyond reasonable ranges of influence. A summary of the estimation parameters used for the Mascota vein are shown in Table 14.12. To provide some degree of declustering in the process, SRK has not used the octant options within Datamine, but has used a restriction on the maximum number of samples per borehole to three.
In terms of the impact between the high-grade and low-grade indicator domains, SRK has tested the impact of using both hard and soft kriging boundaries. Given the limited geological understanding on the controls between these domains, it is SRK’s preference to use the soft boundary approach, which would reflect the assumption that change in the mineralogy is more gradual and that no sharp contacts are known to exist. SRK created the soft boundaries in Datamine by running estimates for both the high and low indicator models independently which use the sample selection tool with a tolerance set to 5 m inside and outside of the indicator shapes (sub-domains), respectively. These estimates are later combined to produce the final estimate for each element within the domain.
In the cases where the high-grade threshold exists, a third model has been run using the higher selected cap which have then been cropped out of the model and combined with the lower threshold capped estimates only within 30 m of the high-grade samples.
It is SRK’s view that this estimation methodology considers the potential risk of over-smoothing the high-grade assays in the local models, and therefore reduces the risk of potential over-estimation. Once mining occurs, the range of influence of the high-grade samples should be monitored and this methodology revised to more accurately reflect the local scale continuity of the mineralisation.
| Effective Date January 1, 2021 | Aris Gold | |||
| Page 178 of 384 |
| SRK Consulting | Soto Norte NI 43-101– Feasibility Study |
Table 14.12: Example of Search Parameters Used for Mascota Vein
| SREFNUM | Element | SOIST1 | SOIST2 | SOIST3 | MIN NUM1 | MAX NUM1 | SVOLFAC2 | MIN NUM2 | MAX NUM2 | SVOLFACJ | MIN NUM3 | MAX NUM3 | MAXKEY | SANGL1_F | SANGL2_F | |||||||||||||||
| (m) | (m) | (m) | (# samples) | (#samples) | (#samples) | (#samples) | (#samples) | (#samples) | ||||||||||||||||||||||
| 1 |
Au | 35 | 35 | 20 | 4 | 8 | 2 | 3 | 12 | 5 | 1 | 9 | 3 | TRDIPDIR | TRDIP | |||||||||||||||
| 2 |
Ag | 50 | 50 | 20 | 4 | 8 | 2 | 3 | 12 | 3.5 | 1 | 9 | 3 | TRDIPDIR | TROIP | |||||||||||||||
| 3 |
Cu | 35 | 35 | 20 | 4 | 8 | 2 | 3 | 12 | 5 | 1 | 9 | 3 | TRDIPDIR | TROIP | |||||||||||||||
| 4 |
Pb | 35 | 35 | 20 | 4 | a | 2 | 3 | 12 | 5 | 1 | 9 | 3 | TRDIPDIR | TROIP | |||||||||||||||
| 5 |
Zn | 50 | 50 | 20 | 4 | 8 | 2 | 3 | 12 | 3.5 | 1 | 9 | 3 | TRDIPDIR | TROIP | |||||||||||||||
| 6 |
Fe | 35 | 35 | 20 | 4 | 8 | 2 | 3 | 12 | 5 | 1 | 9 | 3 | TRDIPOIR | TRDIP | |||||||||||||||
| 7 |
s | 35 | 35 | 20 | 4 | 8 | 2 | 3 | 12 | 5 | 1 | 9 | 3 | TRDIPDIR | TROIP | |||||||||||||||
| 8 |
As | 35 | 35 | 20 | 4 | 8 | 2 | 3 | 12 | 5 | 1 | 9 | 3 | TRDIPDIR | TROIP | |||||||||||||||
| 9 |
Bi | 35 | 35 | 20 | 4 | 8 | 2 | 3 | 12 | 5 | 1 | 9 | 3 | TRDIPDIR | TRDIP | |||||||||||||||
| 10 |
Sb | 35 | 35 | 20 | 4 | 8 | 2 | 3 | 12 | 5 | 1 | 9 | 3 | TRDIPDIR | TROIP | |||||||||||||||
| 11 |
Cd | 50 | 50 | 20 | 4 | a | 2 | 3 | 12 | 3.5 | 1 | 9 | 3 | TROIPDIR | TROIP | |||||||||||||||
| 12 |
Hg | 50 | 50 | 20 | 4 | 8 | 2 | 3 | 12 | 3.5 | 1 | 9 | 3 | TRDIPDIR | TROIP | |||||||||||||||
| 13 |
Te | 35 | 35 | 20 | 4 | a | 2 | 3 | 12 | 5 | 1 | 9 | 3 | TRDIPDIR | TROIP | |||||||||||||||
| 14 |
Th | 35 | 35 | 20 | 4 | 8 | 2 | 3 | 12 | 5 | 1 | 9 | 3 | TRDIPDIR | TROIP | |||||||||||||||
| 15 |
u | 35 | 35 | 20 | 4 | a | 2 | 3 | 12 | 5 | 1 | 9 | 3 | TRDIPDIR | TRDIP |
| Effective Date January 1, 2021 | Aris Gold | |||
| Page 179 of 384 |
| SRK Consulting | Soto Norte NI 43-101– Feasibility Study |
Major Veins (Domains 300 to 1500)
In addition to the two main structures, SRK and Minesa have highlighted the top 13 veins which host potentially economic mineralisation and have been considered independently in terms of statistical and geostatistical analysis. SRK has used a similar estimation method for Domains 300 through 1500, with the exception that no internal sub-domaining has been included for each vein. The search ranges used in the first pass are based on those used for the main structures (Table 14.13) for all the veins with the exception of Domain 400 (New Vein), where the drillhole sampling is typically wider and therefore required extended ranges. SRK notes that the third search ranges are typically well beyond the data limits, but the block models and wireframes have been restricted to more appropriate distances during the classification process. Estimates in the final pass are considered to have lower confidence during the classification process.
All domains have been estimated using three estimation methodologies: OK, IDW2 and NN. While the variography has been treated independently, a standard search ellipse has been used for all 13 veins except for the New Vein, where the sample spacing remains relatively wide and longer ranges were required to provide estimates for the block models. Given the longer ranges and wider drill spacing, SRK has noted these differences which were considered during the classification process of the New Vein.
Table 14.13: Summary of Estimation Method and High-Grade Gold Restriction in Main Vein Domains
| Domain | Estimation Method |
High-Grade Restriction applied |
Summary of Ranges Pass 1 |
Average Range (m) |
Summary of Ranges Pass 2 |
Summary of Ranges Pass 3 | ||||||
| 300 | OK | Ag, Cu | Ag, Cu | 20-50 m | 32.5 m | 40-100 m | ||||||
| 400 | OK | N/A | N/A | 50-100 m | 62.5 m | 100-200 m | ||||||
| 500 | OK | Sb | Sb | 20-50 m | 32.5 m | 40-100 m | ||||||
| 600 | OK | N/A | N/A | 20-50 m | 32.5 m | 40-100 m | ||||||
| 700 | OK | N/A | N/A | 20-50 m | 32.5 m | 40-100 m | ||||||
| 800 | OK | Bi | Bi | 20-50 m | 32.5 m | 40-100 m | ||||||
| 900 | OK | S, Th, U | S, Th, U | 20-50 m | 32.5 m | 40-100 m | ||||||
| 1000 | OK | Ag, Bi, U | Ag, Bi, U | 20-50 m | 32.5 m | 40-100 m | ||||||
| 1100 | OK | As, Te, Zn | As, Te, Zn | 20-50 m | 32.5 m | 40-100 m | ||||||
| 1200 | OK | Sb | Sb | 20-50 m | 32.5 m | 40-100 m | ||||||
| 1300 | OK | N/A | N/A | 20-50 m | 32.5 m | 40-100 m | ||||||
| 1400 | OK | N/A | N/A | 20-50 m | 32.5 m | 40-100 m | ||||||
| 1500 | OK | N/A | N/A | 20-50 m | 32.5 m | 40-100 m |
Minor Veins (Domains 2100 to 5200)
Table 14.14 presents the primary estimation method (OK or IDW2) and if gold high-grade restriction was used, for each minor vein domain. Every vein in each domain was interpolated using its own intercepts with spherical search. In some domains where gold over-estimation was observed, a gold high-grade restriction in the third search was used based on potential breaks observed in the probability plots.
Table 14.14: Summary of Estimation Method and High-Grade Gold Restriction in Minor Vein Domains
| Domain | Estimation Method |
High-Grade (g/t) |
Ranges Pass 1 | Average Range (m) |
Ranges Pass 2 | Ranges Pass 3 | ||||||
| 2100 | OK | NA | N/A | 35-55 m | 40 m | 70-110 m | ||||||
| 2150 | OK | NA | N/A | 35-55 m | 40 m | 70-110 m | ||||||
| 2200 | OK | NA | N/A | 35-55 m | 38 m | 70-110 m | ||||||
| 2250 | OK | NA | N/A | 35-55 m | 39 m | 70-110 m |
| Effective Date January 1, 2021 | Aris Gold | |||
| Page 180 of 384 |
| SRK Consulting | Soto Norte NI 43-101 – Feasibility Study |
| Domain | Estimation Method |
High-Grade Restriction Au (g/ t) |
Ranges Pass 1 | Average Range (m) |
Ranges Pass 2 | Ranges Pass 3 | ||||||
| 2300 | OK | NA | N/A | 35-55 m | 36 m | 70-110 m | ||||||
| 2350 | OK | 10 | 10 | 35-55 m | 43 m | 70-110 m | ||||||
| 2400 | OK | 3 | 3 | 35-55 m | 37 m | 70-110 m | ||||||
| 2500 | IDW2 | 7 | 7 | 35-55 m | 43 m | 70-110 m | ||||||
| 2600 | IDW2 | 3 | 3 | 35-55 m | 38 m | 70-110 m | ||||||
| 3100 | IDW2 | NA | N/A | 35-55 m | 45 m | 70-110 m | ||||||
| 3200 | IDW2 | 3 | 3 | 35-55 m | 35 m | 70-110 m | ||||||
| 3300 | OK | NA | N/A | 35-55 m | 38 m | 70-110 m | ||||||
| 3400 | OK | NA | N/A | 35-55 m | 39 m | 70-110 m | ||||||
| 3500 | OK | NA | N/A | 35-55 m | 49 m | 70-110 m | ||||||
| 3600 | OK | 7.5 | 7.5 | 35-55 m | 43 m | 70-110 m | ||||||
| 4100 | OK | 5.5 | 5.5 | 35-55 m | 41 m | 70-110 m | ||||||
| 4200 | OK | NA | N/A | 35-55 m | 49 m | 70-110 m | ||||||
| 4300 | IDW2 | 5.5 | 5.5 | 35-55 m | 38 m | 70-110 m | ||||||
| 5100 | OK | 3 | 3 | 35-55 m | 46 m | 70-110 m | ||||||
| 5200 | OK | NA | N/A | 35-55 m | 39 m | 70-110 m |
Central Mascota Breccia
Sub-domaining wireframes have been used for Au, S and Zn within Breccia domain using Leapfrog™ Indicator RBF Interpolants (Probability 25% for gold). SRK has based the “high-grade” indicator on an analysis of the log probability plot for the domains with noted breaks in the trends within the Au, S and Zn reviews. An example of the analysis and the associated Leapfrog™ indicator models are shown in Figure 14.20. SRK also notes there is a possible break in trend within the Th database but has not defined sub-domains for Th at this stage. SRK does not consider this will have a material impact on the overall estimates.
The interpolants are based solely on grade at locations where potential breaks in the log-probability plots were defined for these elements, 1.2 g/t Au, 2.1% S and 450 ppm Zn. Sub-domaining was not used for the rest of the elements.
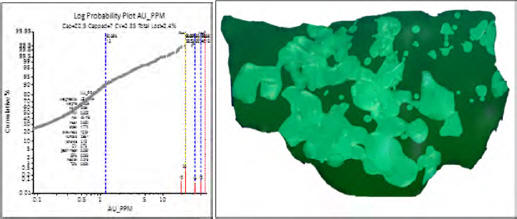
Figure 14.20: Log Probability and Spatial Comparison of 1.2 g/t Au Subdomain within the Breccia Zone
For interpolation, the block model and composites were divided in two zones, Mascota hangingwall and Mascota footwall.
Estimation was completed using IDW2 with an initial search range of 35 x 35 x 20 m using elliptical search oriented according to the mineralisation trend.
| Effective Date January 1, 2021 | Aris Gold | |||
| Page 181 of 384 |
| SRK Consulting | Soto Norte NI 43-101– Feasibility Study |
A minimum of four 3 m composites and maximum of 12 composites was used in the first pass. The second pass used 70 x 70 x 40 m, requiring a minimum of three composites and maximum of 12 composites, with a final pass of 210 x 210 x 140 m, requiring a minimum of one composite and maximum of 10 composites. SRK applied capping for all the elements, including 22 g/t Au, 70 g/t Ag and 6,400 ppm Cu.
Figure 14.21 presents a level plan of the estimated blocks in the breccia and the 3 m composites.
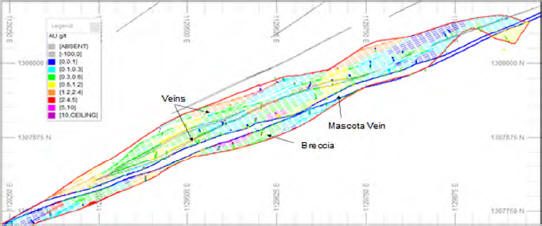
Figure 14.21: Plan View of the Estimated Breccia Blocks and 3 m Composite Gold Grades
Waste Model
To aid the mining study, in addition to the vein and Breccia models, SRK estimated a halo around all blocks flagged with a vein code as waste material, to produce a dilution halo for the stope optimisation (as discussed in Section 14.6, Waste Model).
The block model was divided into three zones and the blocks and composites were coded accordingly, Mascota hangingwall (“MHW”), Mascota footwall (“MFW”) and Gigante footwall (“GFW”). Estimation was completed using IDW2 with an initial search range of 40 x 40 x 40 m using omnidirectional search.
A minimum of four composites and maximum of 12 composites was used in the first pass. The second pass used 80 x 80 x 80 m, requiring a minimum of three composites, with a final pass of 200 x 200 x 200 m, requiring a minimum of one composite. SRK applied capping (MHW: 1.5 g/t Au, 25 g/t Ag, 5,700 ppm Cu; MFW: 1.5 g/t Au, 30 g/t Ag, 6,500 ppm Cu; GHW: 1.5 g/t Au, 22 g/t Ag, 2,300 ppm Cu), to all elements and composited the holes to the same 3 m parameters as used in the veins.
| 14.9 | Estimation Validation |
SRK has undertaken several methods of validation on the resulting estimated model to confirm that the modelled grade estimates represent the input sample data on both local and global scales and to check that the estimate is not biased.
Three techniques were used to evaluate the validity of the block model. Methods of validation used include:
| ● | Visual inspection of block grades in comparison with drillhole data (in plan, cross section, long-section and 3D) |
| ● | Sectional validation of the mean sample grades in comparison to the mean model grades |
| ● | Comparison of block model statistics. |
| Effective Date January 1, 2021 | Aris Gold | |||
| Page 182 of 384 |
| SRK Consulting | Soto Norte NI 43-101 – Feasibility Study |
| 14.9.1 Visual Validation | |
Visual validation provides a comparison of the interpolated block model on a local scale. A thorough visual inspection of cross-sections, long-sections and bench/level plans, comparing the sample grades with the block grades has been undertaken, which demonstrates good comparison between local block estimates and nearby samples, without excessive smoothing in the block model.
Figure 14.22 to Figure 14.24 show examples of the visual validation checks and highlights the overall block grades (AU_PPM, AG_PPM, CU_PPM) corresponding with raw samples grades. It must be noted that at the limit of the estimation the block values have no values. This does not represent the limit to the structure and the mineralised structures are considered open at depth and along strike.
The results of the analysis show a strong correlation between the local estimates and the original composites.
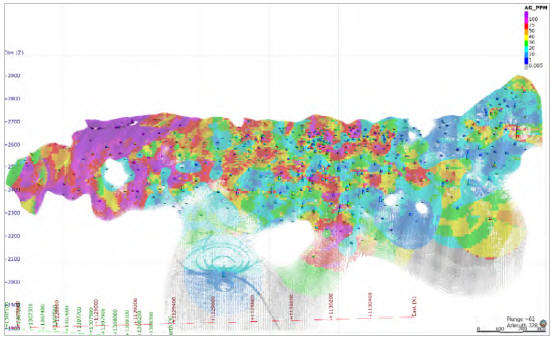
Figure 14.22: Long Section of Block Centroids of Mascota Vein Estimated and Raw Sample Silver Grades
| Effective Date January 1, 2021 | Aris Gold | |||
| Page 183 of 384 |
| SRK Consulting | Soto Norte NI 43-101 – Feasibility Study |
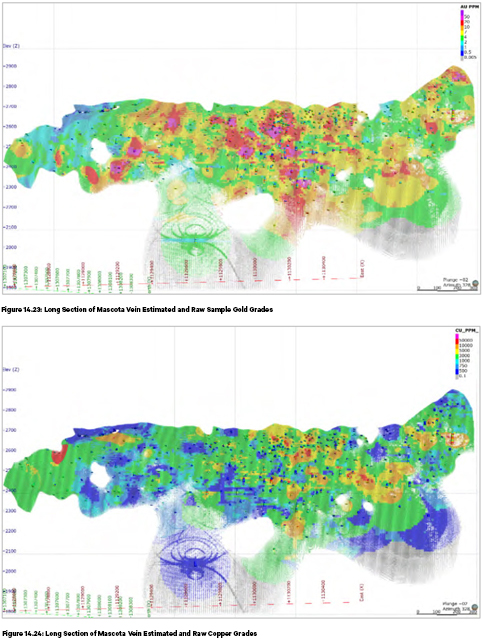
| 14.9.2 Comparative Statistics | |
In comparing the composite means to the block estimates on the top 15 domains, the average grade of the blocks is typically lower than the raw composite mean grades (Table 14.15). SRK, therefore, has compared the results to a de-clustered composite mean based on a default de-clustering grid of 50 x 30 x 50 m, which approximates the typical sampling grid spacing at the Project. The comparisons show reasonable correlation between the composites and the blocks for most domains for Au, with larger variances noted in the Ag and Cu estimates. SRK recommends continual review of the estimation parameters upon any subsequent exploration drilling in the minor veins could further improve the correlation between the composite grades and block grades.
SRK considers that the block grades, (based on long section visual-validation analysis) show reasonable correlations to high-grade sampling.
| Effective Date January 1, 2021 | Aris Gold | |||
| Page 184 of 384 |
| SRK Consulting | Soto Norte NI 43-101– Feasibility Study |
| Table 14.15: | Statistical Comparison of Composite and Estimated Grades by Estimation Method |
| Domain | Units | 100 | 200 | 300 | 400 | 500 | 600 | 700 | 800 | 900 | 1000 | 1100 | 1200 | 1300 | 1400 | 1500 | ||||||||||||||||||
|
Au Grade |
(gil) | 7.37 | 6 84 | 5.47 | 4.84 | 4.51 | 7 15 | 8 28 | 7.49 | 3.59 | 1.28 | 2.78 | 7.02 | 5.28 | 4.15 | 5.25 | ||||||||||||||||||
|
Au Declustered Grade |
(gil) | 6.26 | 5.8 | 5.08 | 4.6 | 4.37 | 6.63 | 7.99 | 6.6 | 3.19 | 1.39 | 2.57 | 5.89 | 4.75 | 3.22 | 4.64 | ||||||||||||||||||
|
AU_OK |
(gil) | 6.14 | 5.57 | 4.99 | 4.3 | 4.38 | 7.25 | 9.01 | 7 | 3.49 | 1.25 | 2.89 | 5.27 | 4.52 | 3.47 | 4.09 | ||||||||||||||||||
|
AU_lOW |
(gil) | 6.14 | 5.71 | 5.13 | 4.25 | 4.24 | 7.17 | 9.17 | 6.81 | 3.46 | 1.19 | 2.88 | 5.21 | 4.47 | 3.52 | 3.96 | ||||||||||||||||||
|
AU_NN |
(gil) | 6.04 | 5.97 | 5.28 | 5.57 | 4.29 | 7.23 | 7.65 | 6.53 | 2.91 | 1.29 | 2.68 | 4.89 | 4.16 | 3.35 | 3.6 | ||||||||||||||||||
|
Difference |
(%) | -2.0096 | -4.00% | 1.70% | -6.50% | 0.30% | 9.50% | 12.80% | 6.10% | 9.30% | -9.80% | 12.50% | -10.70% | -4.70% | 7.90% | -11.80% | ||||||||||||||||||
|
Ag Grade |
(gil) | 49.4 | 33.3 | 34.54 | 24.8 | 39.9 | 40 | 37.7 | 18.6 | 13 | 108.36 | 40.8 | 39.5 | 12.2 | 10.4 | 23.1 | ||||||||||||||||||
|
Ag Declustered Grade |
(g/1) | 44 | 31 | 31 | 24 | 38 | 40 | 35 | 21 | 10 | 104 | 34 | 28 | 12 | 10 | 23 | ||||||||||||||||||
|
AG_OK |
(g/1) | 49 | 35 | 34 | 23 | 39 | 40 | 38 | 17 | 11 | 99 | 42 | 50 | 11 | 8 | 15 | ||||||||||||||||||
|
AG_IDW |
(gil) | 49 | 37 | 36 | 23 | 38 | 39 | 40 | 17 | 12 | 115 | 42 | 51 | 10 | 8 | 15 | ||||||||||||||||||
|
AG NN |
(gil) | 49 | 37 | 38 | 23 | 38 | 39 | 40 | 17 | 12 | 115 | 42 | 51 | 10 | 8 | 15 | ||||||||||||||||||
|
Difference |
(%) | 11.00% | 12.80% | 10.10% | -4.90% | 1.00% | 0.40% | 8.60% | -16.80% | 9.00% | -4.30% | 22.50% | 77.00% | -7.30% | -16.10% | -33.40% | ||||||||||||||||||
|
Cu Grade |
(ppm) | 2,363 | 2,331 | 2,182 | 1,502 | 2,825 | 2,297 | 2,263 | 1,038 | 835 | 813 | 1,175 | 3,772 | 645 | 1,148 | 2,291 | ||||||||||||||||||
|
Cu Dedustered Grade |
(ppm) | 1,970 | 2,199 | 1,856 | 1,268 | 2,556 | 2,220 | 2,039 | 1,025 | 740 | 1,111 | 1,022 | 2,670 | 663 | 1,108 | 2,222 | ||||||||||||||||||
|
CU_OK |
(ppm) | 1,936 | 2,464 | 2,165 | 1,781 | 2,479 | 2,339 | 2,559 | 946 | 784 | 988 | 1,151 | 5,608 | 608 | 1,037 | 1,579 | ||||||||||||||||||
|
CU_IDW |
(ppm) | 1,924 | 2,535 | 2,246 | 1,770 | 2,467 | 2,322 | 2,591 | 962 | 799 | 981 | 1,164 | 5,570 | 590 | 974 | 1,684 | ||||||||||||||||||
|
CU_NN |
(ppm) | 1,924 | 2,535 | 2,246 | 1,770 | 2,467 | 2,322 | 2,591 | 962 | 799 | 981 | 1,164 | 5,570 | 590 | 974 | 1,684 | ||||||||||||||||||
|
Difference |
(ppm) | -170% | 1200% | 16.70% | 40.40% | -3.00% | 5.40% | 25.50% | -770% | 6.00% | -11.10% | 12.60% | 110.00% | -8.20% | -6.40% | -28.90% | ||||||||||||||||||
| Effective Date January 1, 2021 | Aris Gold | |||
| Page 185 of 384 |
| SRK Consulting | Soto Norte NI 43-101– Feasibility Study |
| 14.9.3 | Swath Plots |
As part of the validation process, the input composite samples are compared to the block model grades along strike, across strike and down dip of each vein. The results of which are then displayed on charts known as Swath Plots, to check for visual discrepancies between estimates and the raw data. For example, Figure 14.25 shows the results for the Au, Ag and Cu grades for the Mascota vein, based on section lines cut along the West to East direction of the deposit at intervals.
The resultant plots show a reasonable correlation between the block model grades and the composite grades, with the block model showing a typically smoothed profile of the composite grades as expected. SRK notes that in less densely sampled areas, minor grade discrepancies do exist on a local scale. The largest discrepancies are typically noted at the limits of the deposit, which is a function to a degree of the grade variability in these areas. Infill drilling/grade control will be required to improve the local estimation during mining, however, overall, SRK is confident that the interpolated grades reflect the available input sample data, and the estimate shows no sign of material bias.
Based on the visual, sectional and statistical validation results SRK has accepted the grades in the block model.
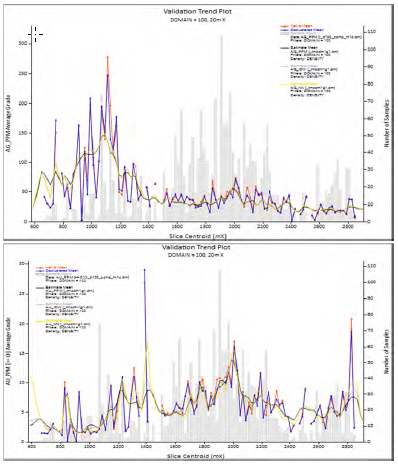
| Effective Date January 1, 2021 | Aris Gold | |||
| Page 186 of 384 |
| SRK Consulting | Soto Norte NI 43-101– Feasibility Study |
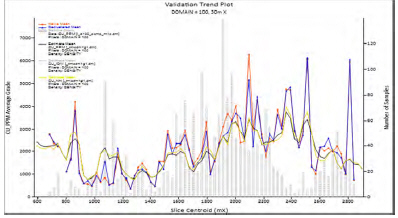
Figure 14.25: Swath Analysis by Easting of Estimated and Composite Silver, Gold, and Copper Grades for the Mascota Vein
| 14.10 | Classification |
SRK has considered sampling quality, sampling density and distance from samples to classify the Mineral Resource according to the 2014 CIM Definition Standards. Data quality, drillhole spacing and the interpreted continuity of grades controlled by the deposit have allowed SRK to classify portions of the veins in the Indicated and Inferred Mineral Resource categories as shown for the main veins of Mascota (Figure 14.26) and Gigante (Figure 14.27).
Indicated Mineral Resources are those kriged blocks, which have been interpolated by drillhole data, with more than two boreholes within 50 x 50 m of the estimated block, within domains which are deemed to have sufficient geological continuity. Down-dip continuity should be shown to a reasonable level of confidence based on borehole intersections.
Inferred Mineral Resources are model blocks lying outside the Indicated wireframes which still display reasonable strike continuity and down-dip extension based on the current borehole intersections. The majority of these blocks have been estimated within search volumes two or three and therefore require infill drilling to improve the quality of the geological interpretation and grade estimate. These estimates lie typically within 150 m of the current drilling coverage, but SRK cautions that in the hanging-wall these are projected down-dip from relatively shallow drilling and significant drilling will be required to increase the confidence in these estimates to an Indicated level of confidence.
| Effective Date January 1, 2021 | Aris Gold | |||
| Page 187 of 384 |
| SRK Consulting | Soto Norte NI 43-101– Feasibility Study |
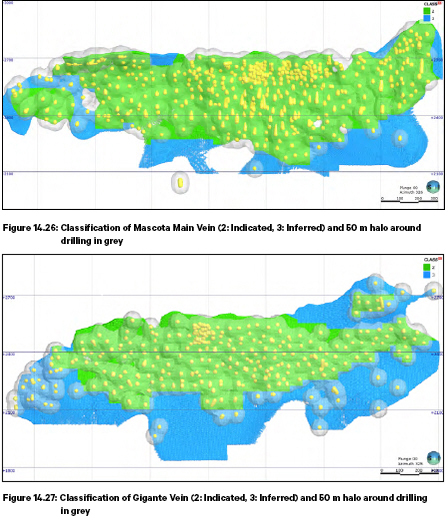
| 14.11 | Mineral Resource Estimate Summary |
In order to determine the quantities of material offering “…reasonable prospects for eventual economic extraction” by an underground mining method, Minesa determined an NSR cut-off approach which had been developed based on initial cost estimates, metallurgical recoveries, treatment and payability terms, and metal price forecasts which were reviewed by SRK including:
| • | Metal price forecasts considered for the calculation of metal equivalent grades: gold (USD1,300/oz); silver (USD18/oz), copper (USD6,800/t) |
| • | The NSR calculation considers the following metallurgical recoveries: gold (92%), silver (92%), and copper (76%). |
Costs and recoveries are based on previous technical studies completed on the Project and other
| Effective Date January 1, 2021 | Aris Gold | |||
| Page 188 of 384 |
| SRK Consulting | Soto Norte NI 43-101– Feasibility Study |
benchmarks, including a recent marketing assessment. SRK reasonably expects the Soto Norte deposit to be amenable to a variety of underground mining methods and the Mineral Resources are reported based on a USD47/t NSR cut-off. The blocks above the NSR cut-off form contiguous mining targets without isolated blocks that would be unlikely to warrant the cost of development. The final NSR calculation for the Mineral Resource estimate (further detailed in Section 15.3) is based on average grade assumptions for the deposit and determined using:
NSR (USD) = 36.1759 x (gold - grade g/t Au) + 0.4426 x (silver grade g/t Ag) + 0.0046 x (copper grade ppm Cu) – 4.5752 x (sulphur grade % S) - 0.0037 x (arsenic grade ppm As) – 0.0082 x (antimony grade ppm Sb) – 0.0065 x (bismuth grade ppm Bi) – 0.0067 x (cadmium grade ppm Cd) – 0.277 x (mercury grade ppm Hg) – 0.0001 x (zinc grade ppm Zn) – 0.02
A Gold Equivalent (AuEQ) grade and contained ounces has been separately included in the MRE based on the NSR formula to determine equivalent values for copper and silver in relation to gold, taking into account process recoveries, metal prices, realisation costs and payabilities for each metal. The gold value used in the AuEQ estimate also carries the full cost of penalty elements. The NSR cut-off considers marginal mining costs, processing costs, and G&A costs totalling USD47/t. This cut-off has been applied to the block model and the resultant blocks reviewed in Datamine to ensure continuity for potential underground mining stopes.
The MRE for the Soto Norte Project with an effective date of 22 May 2019 is summarised in Table 14.16.
| 14.11.1 Factors That May Affect the Mineral Resource | Estimate |
Factors which may affect the Mineral Resource estimates include:
| • | Metal price and exchange rate assumptions. |
| • | Changes to the assumptions used to generate the cut-off value. |
| • | Additional drilling and sampling data. |
| • | Changes in local interpretations of mineralisation geometry and continuity of mineralisation zones. |
| • | Density and domain assignments. |
| • | Changes to design parameter assumptions that pertain to stope designs. |
| • | Changes to geotechnical, mining and metallurgical recovery assumptions. |
| • | Assumptions as to the continued ability to access the site, retain mineral and surface rights titles, obtain environmental and other regulatory permits, and obtain the social licence to operate. |
| Effective Date January 1, 2021 | Aris Gold | |||
| Page 189 of 384 |
| SRK Consulting | Soto Norte NI 43-101– Feasibility Study |
| Table 14.16: | Soto Norte Mineral Resources Effective 22 May 2019 (1, 2, 3, 4) |
| INDICATED CLASSIFICATION | Gold Equivalent | |||||||||||||||||||
| Domain | Tonnes | Au | Au | Ag | Ag | Cu | Cu | AuEQ | AuEQ | |||||||||||
| (kt) | (g/t) | (koz) | (g/t) | (koz) | (%) | (klb) | (g/t) | (koz) | ||||||||||||
| Mascota |
16,128 | 6.29 | 3,264 | 54.7 | 28,383 | 0.20 | 72,344 | 7.58 | 3,930 | |||||||||||
| Mascota Superior |
9,331 | 5.44 | 1,632 | 30.1 | 9,034 | 0.17 | 34,665 | 6.16 | 1,848 | |||||||||||
| Mascota-Gigante |
6,363 | 4.57 | 934 | 27.1 | 5,538 | 0.15 | 21,122 | 5.24 | 1,072 | |||||||||||
| Gigante |
7,602 | 6.29 | 1,537 | 34.3 | 8,386 | 0.24 | 39,921 | 7.25 | 1,772 | |||||||||||
| Gigante Inferior |
1,631 | 5.08 | 266 | 23.5 | 1,232 | 0.19 | 6,813 | 5.84 | 306 | |||||||||||
| New |
832 | 6.90 | 185 | 28.2 | 754 | 0.21 | 3,790 | 7.67 | 205 | |||||||||||
| Aserradero |
3,484 | 3.42 | 383 | 11.5 | 1,291 | 0.15 | 11,778 | 3.86 | 433 | |||||||||||
| Breccia |
2,650 | 2.96 | 252 | 8.0 | 681 | 0.05 | 2,753 | 3.16 | 269 | |||||||||||
| Halo |
42 | 1.23 | 2 | 18.1 | 25 | 0.25 | 235 | 2.20 | 3 | |||||||||||
| Subtotal Indicated |
48,062 | 5.47 | 8,454 | 35.8 | 55,324 | 0.18 | 193,422 | 6.35 | 9,818 | |||||||||||
| INFERRED CLASSIFICATION | Gold Equivalent | |||||||||||||||||||
| Domain | Tonnes | Au | Au | Ag | Ag | Cu | Cu | AuEQ | AuEQ | |||||||||||
| (kt) | (g/t) | (koz) | (g/t) | (koz) | (%) | (klb) | (g/t) | (koz) | ||||||||||||
| Mascota |
2,007 | 3.83 | 247 | 60.3 | 3,890 | 0.13 | 5,844 | 5.42 | 350 | |||||||||||
| Mascota Superior |
4,779 | 5.46 | 840 | 24.6 | 3,781 | 0.17 | 17,526 | 6.10 | 937 | |||||||||||
| Mascota-Gigante |
3,851 | 3.99 | 494 | 28.5 | 3,525 | 0.11 | 9,505 | 4.71 | 584 | |||||||||||
| Gigante |
2,002 | 4.46 | 287 | 46.6 | 3,001 | 0.37 | 16,220 | 6.23 | 401 | |||||||||||
| Gigante Inferior |
5,530 | 3.79 | 674 | 25.2 | 4,485 | 0.27 | 33,366 | 4.88 | 868 | |||||||||||
| New |
3,627 | 4.17 | 487 | 22.6 | 2,633 | 0.15 | 12,272 | 4.79 | 558 | |||||||||||
| Aserradero |
5,088 | 3.00 | 491 | 8.3 | 1,353 | 0.11 | 12,226 | 3.31 | 542 | |||||||||||
| Breccia |
456 | 3.45 | 51 | 5.7 | 84 | 0.03 | 310 | 3.57 | 52 | |||||||||||
| Halo |
2 | 1.35 | - | 16.9 | 1 | 0.24 | 13 | 2.36 | 0 | |||||||||||
| Subtotal Inferred |
27,343 | 4.06 | 3,571 | 25.9 | 22,754 | 0.18 | 107,281 | 4.83 | 4,249 | |||||||||||
(1) Mineral Resources are not Mineral Reserves and do not have demonstrated economic viability. All figures are rounded to reflect the relative accuracy of the estimate and have been used to derive sub- totals, totals and weighted averages. Such calculations inherently involve a degree of rounding and consequently introduce a margin of error. Where these occur, SRK does not consider them to be material. All composites have been capped where appropriate. Measured and Indicated Mineral Resources are inclusive of those Mineral Resources modified to produce Mineral Reserves; that is, they are reported on an ‘inclusive basis’. The Concession is wholly owned and exploration is operated by Sociedad Minera de Santander S.A.S (Minesa).
(2) The standard adopted in respect of the reporting of Mineral Resources for the Project, following the completion of required technical studies, is in accordance with the NI 43-101 guidelines and the 2014 CIM Definition Standards, and have an Effective Date of 22 May 2019.
(3) SRK reasonably expects the Soto Norte deposit to be amenable to a variety of underground mining methods. Mineral Resources are reported based on an NSR cut-off which considers marginal mining costs, processing costs, and G&A costs totalling USD47/t. The NSR cut-off calculation has been determined based on metal price forecasts, metallurgical recovery assumptions from initial testwork, mining costs, processing costs, general and administrative (G&A) costs, and other NSR factors. The final NSR calculation is based on average assumptions for the deposit and determined using NSR (USD) = 36.1759 x (gold grade g/t Au) + 0.4426 x (silver grade g/t Ag) + 0.0046 x (copper grade ppm Cu) - 4.5752 x (sulphur grade %S) - 0.0037 x (arsenic grade ppm As) - 0.0082 x (antimony grade ppm Sb) – 0.0065 x (bismuth grade ppm Bi) – 0.0067 x (cadmium grade ppm Cd) – 0.277 x (mercury grade ppm Hg) – 0.0001 x (zinc grade ppm Zn) -0.02. Metal price forecasts considered for the calculation of metal equivalent grades are Gold (USD1,300/oz), Silver (USD18/oz), Copper (USD6,800/t). NSR cut-off calculations assume average metallurgical recoveries of: Gold (92%), Silver (92%), Copper (76%). A Gold Equivalent (AuEQ) grade and contained ounces has been separately included in the resource estimate based on the NSR formula to determine equivalent values for copper and silver in relation to gold, taking into account process recoveries, metal prices, realisation costs and payabilities for each metal. The gold value used in the AuEQ estimate also carries the full cost of penalty elements.
(4) SRK completed a site inspection of the deposit by Mr. Ben Parsons, MSc. MAusIMM (CP), an appropriate “independent qualified person” as defined in National Instrument 43-101.
| Effective Date January 1, 2021 | Aris Gold | |||
| Page 190 of 384 |
| SRK Consulting | Soto Norte NI 43-101– Feasibility Study |
| 14.12 Grade Sensitivity Analysis | |
SRK has completed a number of estimates on the deposit using a variety of parameters and the resultant models produced a robust estimate in terms of the selected estimation parameters. The Mineral Resources of the Soto Norte Project are sensitive to the selection of the reporting cut-off value. To illustrate this sensitivity, the block model quantities and grade estimates based on varying NSR cut-off values within the in situ underground Mineral Resources, which are presented in Table 14.17 and Table 14.18.
Table 14.17: Indicated Estimates1 at a Range of NSR Cut-Offs
| Gold Equivalent | ||||||||||||||||||||||
| NSR Cut-off (USD/t) |
Tonnes(kt) | NSR Value (USD/t) |
Au (g/t) | Au (koz) | Ag (g/t) | Ag (koz) | Cu (%) |
Cu (klb) |
AuEQ |
AuEQ (koz) | ||||||||||||
| 0 | 309,970 | 36 | 1.13 | 11,274 | 7.8 | 77,407 | 0.05 | 339,204 | 1.00 | 9,917 | ||||||||||||
| 10 | 111,710 | 95 | 2.71 | 9,732 | 18.1 | 65,108 | 0.1 | 249,885 | 2.63 | 9,432 | ||||||||||||
| 20 | 63,067 | 157 | 4.39 | 8,893 | 28.9 | 58,682 | 0.15 | 211,815 | 4.34 | 8,800 | ||||||||||||
| 30 | 52,235 | 185 | 5.13 | 8,618 | 33.7 | 56,519 | 0.17 | 199,088 | 5.11 | 8,588 | ||||||||||||
| 40 | 49,331 | 194 | 5.37 | 8,514 | 35.1 | 55,728 | 0.18 | 195,206 | 5.36 | 8,505 | ||||||||||||
| 50 | 47,528 | 199 | 5.51 | 8,426 | 36.1 | 55,109 | 0.18 | 192,589 | 5.50 | 8,406 | ||||||||||||
| 60 | 45,499 | 206 | 5.68 | 8,308 | 37 | 54,144 | 0.19 | 189,080 | 5.69 | 8,330 | ||||||||||||
| 70 | 43,175 | 213 | 5.87 | 8,154 | 38 | 52,793 | 0.19 | 184,161 | 5.89 | 8,173 | ||||||||||||
| 80 | 40,363 | 223 | 6.13 | 7,956 | 38.9 | 50,557 | 0.2 | 177,951 | 6.16 | 8,003 | ||||||||||||
| 90 | 37,691 | 233 | 6.39 | 7,746 | 39.7 | 48,142 | 0.21 | 171,062 | 6.44 | 7,805 | ||||||||||||
| 100 | 35,027 | 243 | 6.68 | 7,520 | 40.3 | 45,369 | 0.21 | 163,834 | 6.72 | 7,565 | ||||||||||||
| 110 | 32,558 | 253 | 6.96 | 7,290 | 40.7 | 42,639 | 0.22 | 156,099 | 6.99 | 7,321 | ||||||||||||
| 120 | 30,090 | 265 | 7.27 | 7,035 | 41.4 | 40,038 | 0.22 | 148,066 | 7.33 | 7,087 | ||||||||||||
| 130 | 28,013 | 275 | 7.55 | 6,803 | 42 | 37,796 | 0.23 | 140,962 | 7.60 | 6,846 | ||||||||||||
| 140 | 25,928 | 286 | 7.86 | 6,553 | 42.6 | 35,473 | 0.23 | 133,088 | 7.91 | 6,590 | ||||||||||||
| 150 | 23,987 | 298 | 8.17 | 6,303 | 43.1 | 33,271 | 0.24 | 125,600 | 8.24 | 6,353 | ||||||||||||
| 160 | 22,129 | 310 | 8.5 | 6,048 | 43.8 | 31,152 | 0.24 | 118,080 | 8.57 | 6,097 | ||||||||||||
| 170 | 20,468 | 322 | 8.82 | 5,805 | 44.5 | 29,282 | 0.25 | 111,061 | 8.90 | 5,857 | ||||||||||||
| 180 | 18,963 | 333 | 9.14 | 5,571 | 45.3 | 27,602 | 0.25 | 104,607 | 9.21 | 5,612 | ||||||||||||
| 190 | 17,531 | 345 | 9.47 | 5,336 | 46 | 25,939 | 0.25 | 98,416 | 9.54 | 5,375 | ||||||||||||
| 200 | 16,299 | 357 | 9.77 | 5,122 | 46.9 | 24,551 | 0.26 | 92,777 | 9.87 | 5,171 | ||||||||||||
1The reader is cautioned that the figures in these tables should not be misconstrued with a Mineral Resource estimate. The figures are only presented to show the sensitivity of the block model estimates to the selection of cut-off value and AuEQ. All figures are rounded to reflect the relative accuracy of the estimate.
Table 14.18: Inferred Estimates1, Soto Norte at a Range of NSR Cut-Offs
| Gold Equivalent | ||||||||||||||||||||||
| NSR Cut-off (USD/t) | Tonnes(kt) | NSR Value (USD/t) |
Au (g/t) | Au (koz) |
Ag (g/t) | Ag (koz) |
Cu (%) |
Cu (klb) |
AuEQ |
AuEQ (koz) | ||||||||||||
| 0 |
327,316 | 16 | 0.59 | 6,259 | 4.0 | 41,835 | 0.03 | 239,990 | 0.44 | 4,654 | ||||||||||||
| 10 |
76,594 | 61 | 1.84 | 4,527 | 12.2 | 29,976 | 0.09 | 149,260 | 1.69 | 4,152 | ||||||||||||
| 20 |
36,746 | 113 | 3.25 | 3,845 | 21.0 | 24,860 | 0.15 | 118,594 | 3.12 | 3,690 | ||||||||||||
| 30 |
29,585 | 134 | 3.85 | 3,663 | 24.6 | 23,397 | 0.17 | 109,792 | 3.70 | 3,523 | ||||||||||||
| 40 |
28,034 | 140 | 4.00 | 3,606 | 25.5 | 22,944 | 0.17 | 108,047 | 3.87 | 3,488 | ||||||||||||
| 50 |
27,038 | 143 | 4.09 | 3,554 | 26.0 | 22,630 | 0.18 | 106,796 | 3.95 | 3,436 | ||||||||||||
| 60 |
25,622 | 148 | 4.21 | 3,470 | 26.6 | 21,954 | 0.18 | 104,228 | 4.09 | 3,370 | ||||||||||||
| 70 |
23,681 | 155 | 4.39 | 3,342 | 27.2 | 20,716 | 0.19 | 100,375 | 4.28 | 3,262 | ||||||||||||
| 80 |
20,773 | 166 | 4.67 | 3,121 | 28.7 | 19,172 | 0.21 | 95,274 | 4.59 | 3,065 | ||||||||||||
| 90 |
18,197 | 177 | 4.97 | 2,905 | 30.5 | 17,837 | 0.23 | 91,019 | 4.89 | 2,862 | ||||||||||||
| 100 |
16,407 | 186 | 5.20 | 2,742 | 31.5 | 16,612 | 0.24 | 86,327 | 5.14 | 2,712 | ||||||||||||
| 110 |
14,982 | 194 | 5.40 | 2,603 | 32.0 | 15,401 | 0.25 | 81,837 | 5.36 | 2,583 | ||||||||||||
| 120 |
12,852 | 207 | 5.74 | 2,373 | 33.3 | 13,762 | 0.26 | 73,790 | 5.72 | 2,364 | ||||||||||||
| 130 |
10,956 | 222 | 6.14 | 2,162 | 34.6 | 12,173 | 0.27 | 65,270 | 6.14 | 2,162 | ||||||||||||
| 140 |
9,710 | 233 | 6.45 | 2,012 | 35.0 | 10,915 | 0.27 | 57,125 | 6.44 | 2,011 | ||||||||||||
| 150 |
8,515 | 245 | 6.79 | 1,859 | 35.1 | 9,618 | 0.26 | 48,400 | 6.77 | 1,854 | ||||||||||||
| 160 |
7,551 | 256 | 7.10 | 1,724 | 35.4 | 8,588 | 0.26 | 42,915 | 7.08 | 1,718 | ||||||||||||
| 170 |
6,764 | 267 | 7.39 | 1,607 | 36.1 | 7,841 | 0.26 | 38,760 | 7.38 | 1,605 | ||||||||||||
| 180 |
5,986 | 279 | 7.72 | 1,486 | 36.8 | 7,083 | 0.26 | 34,476 | 7.71 | 1,484 | ||||||||||||
| 190 |
5,362 | 290 | 8.02 | 1,382 | 37.6 | 6,481 | 0.26 | 31,035 | 8.02 | 1,382 | ||||||||||||
| 200 |
4,676 | 304 | 8.40 | 1,263 | 38.4 | 5,772 | 0.27 | 27,655 | 8.40 | 1,263 | ||||||||||||
1The reader is cautioned that the figures in these tables should not be misconstrued with a Mineral Resource estimate. The figures are only presented to show the sensitivity of the block model estimates to the selection of cut-off value and AuEQ. All figures are rounded to reflect the relative accuracy of the estimate.
| 14.13 Relevant Factors | |
SRK is not aware of any environmental, permitting, legal, title, taxation marketing or other factors that could materially affect the estimation of Mineral Resources that are not discussed in this Technical Report.
| Effective Date January 1, 2021 | Aris Gold | |||
| Page 191 of 384 |
| SRK Consulting | Soto Norte NI 43-101– Feasibility Study |
| 15 | MINERAL RESERVE ESTIMATES |
| 15.1 | Introduction |
The Mineral Reserve estimate has been prepared in accordance with CIM definition standards. The Mineral Reserves were estimated based only on the Mineral Resources that were classified as Indicated. The wireframes used to convert the mineral resources to mineral reserves were subjected to a detailed mine planning exercise based on the selected Modified Avoca mining method.
The QP who has reviewed the Mineral Reserve estimate and the life of mine plan is Mr Chris Bray, BEng, MAusIMM(CP), an independent qualified person: as defined in NI 43-101. The effective date of the Mineral Reserve estimate is 01 January 2021.
| 15.2 | Modifying Factors |
Mine modifying factors were assessed through benchmark assessment and first principles calculation for a range of scenarios for Modified Avoca including:
| ● | Backfill mucked at drawpoint to create a free face |
| ● | Tight blasting against fill |
| ● | Use of Temporary Rib Pillars (“TRP”) to manage backfill followed by recovery of the TRP’s |
| ● | First principles estimate of modifying factors considered allowances (where applicable) for: |
| ● | Mine RoM dilution and loss factors |
| ● | Backfill dilution from mucking at the drawpoint |
| ● | Overbreak dilution (Equivalent linear overbreak slough, “ELOS”) |
| ● | Floor dilution from overmucking. |
| ● | Drawpoint angle |
| ● | Temporary rib pillars |
| ● | Underperforming blasts |
| ● | Hangingwall angle |
Modifying factors (mining dilution and losses) were applied following the stope optimisation process and applied in the mine schedule as follows:
| ● | Stope Diluted Tonnes: |
| ○ | All stopes were assigned a dilution value (GT_Stope_Diln field) based on geotechnical domains provided by Minesa as wireframes designated as either 12.5%, 17.5% or 20% which were assigned to all stopes (see Table 15.1). Diluted Tonnes were calculated for stopes using the formula: Diluted Tonnes = (Tonnes) / (1.0 – (GT_Stope_Diln) |
| ● | Stope Recovered Tonnes: |
| ○ | Unplanned mining losses were applied to stopes based on the stope width as shown in Table 15.2. Recovered tonnes were calculated using the formula: Recovered Tonnes = (Diluted Tonnes) |
| Effective Date January 1, 2021 | Aris Gold | |||
| Page 192 of 384 |
| SRK Consulting | Soto Norte NI 43-101– Feasibility Study |
x (1.0 – ‘Unplanned Mining Loss’)
| ● | Development Dilution and Recovered Tonnes: |
| ○ | All development is assumed to have 0% dilution and ore development is assumed to have 0% unplanned mining losses. |
| ○ | Waste development has a stripping factor and an over-break factor assigned. |
| ○ | Ore development was not given an over-break or stripping factor in order to balance the mining inventory. |
| ● | Additional Mining Losses: Provisions are included in the mine design for additional mining losses for Modified Avoca. On the final level of sill pillar extraction, below the grout consolidated fill, for every 30 m of strike length a stabilising 5 m rib pillar is left in situ, resulting in a loss of around 14%. |
| Table 15.1: | External Mining Dilution by Geotechnical Domain |
| Stope N1 range | External Mining Dilution | |||
|
0.01 to 1.1 |
20% | |||
|
1.1 to 2.6 |
17.5% | |||
|
> 2.6 |
12.5% |
| Table 15.2: | Unplanned Mining Loss by Stope Width |
| Stope Width | Unplanned Mining Loss | |||
|
Narrow (2.5 to 5.0 m) |
8.0% | |||
|
Wide (>5.0 m) |
7.0% |
| 15.3 | NSR Value and Cut-Off Approach |
The Stope Optimiser was run based on the cost estimates, metallurgical recoveries, treatment and payability terms and metal price forecasts at the time of mine planning. The calculation of metal equivalent grades used metal price forecasts for gold (USD1,300/oz), silver (USD18/oz), copper (USD7,000/t), and metallurgical recoveries of gold (92%), silver (92.5%), and copper (76%).
The NSR value calculation considers production of two separate saleable products from a single ore feed including a copper concentrate which contains payable copper, gold, and silver, and a pyrite concentrate which contains payable gold and silver.
The calculation assumes that any additional tonnage not used to produce these concentrates goes to dry filtered tailings which includes non-recovered metals. Table 15.3 provides a summary of the input parameters and commercial terms used as a basis for the purposes of the NSR calculation.
| Table 15.3: | NSR Cut-off Parameters |
| Metal Prices | ||||||||||
|
Gold |
USD/oz | 1,300 | ||||||||
|
Copper |
USD/t | 7,000 | ||||||||
|
Silver |
USD/oz | 18 | ||||||||
| Mill Feed Grade | ||||||||||
|
Gold |
g/t Au | 4.96 | ||||||||
|
Copper |
% Cu | 0.174 | ||||||||
|
Silver |
g/t Ag | 28.7 | ||||||||
|
Product |
Mass Balance | Process Recovery % | ||||||||
| % tonnes | Au | Cu | Ag | |||||||
| Effective Date January 1, 2021 | Aris Gold | |||
| Page 193 of 384 |
| SRK Consulting | Soto Norte NI 43-101– Feasibility Study |
|
Copper concentrate |
0.8 | 40.0 | 76 | 56 | ||||||||
| Pyrite concentrate |
6.2 | 52.5 | 16 | 36 | ||||||||
|
Dry Filtered Tailings |
93.0 | 7.5 | 8 | 8 | ||||||||
| Total |
100 | 100 | 100 | 100 | ||||||||
|
Saleable Product |
Moisture |
Realisation Costs |
Treatment Charge |
Refining Charges (on payable metal) | ||||||||
| Au | Cu | Ag | ||||||||||
| % | USD/dmt | USD/t conc | USD/oz Au | USD/lb Cu | USD/oz Ag | |||||||
|
Copper concentrate |
9 | 2.99 | 169.2 | 8.00 | 12.94 | 0.58 | ||||||
| Pyrite concentrate |
9 | 8.72 | 168.3 | 7.14 | 0.44 | |||||||
|
Saleable Product |
Metal Payability (%) | |||||||||||
| Au | Cu | Ag | ||||||||||
|
Copper concentrate |
97.5 | 98.9 | 92.4 | |||||||||
| Pyrite concentrate |
95.0 | - | 81.7 | |||||||||
NSR is expressed as a linear function of the grade of sulphur, gold, silver, copper, arsenic, antimony, bismuth, cadmium, mercury and zinc in the block model. The linear correlation coefficients for individual elements are listed along with the average NSR for the mining inventory and shown in Table 15.4. The correlation coefficients are derived from revenues and charges associated with individual elements in the copper and pyrite concentrate, as shown in Table 15.5.
| Table 15.4: | Linear Correlation Coefficients of NSR Formula |
| Element | Grade | Coefficient | NSR | |||
| S |
4.19 | -4.57518654 | -19.15 | |||
| Au |
4.96 | 36.17589371 | 179.32 | |||
| Ag |
28.7 | 0.442632963 | 12.70 | |||
| Cu |
1,740 | 0.004573578 | 7.96 | |||
| As |
313 | -0.0036661 | -1.15 | |||
| Sb |
85 | -0.00824168 | -0.70 | |||
| Bi |
18.1 | -0.00645465 | -0.12 | |||
| Cd |
8.0 | -0.00674461 | -0.05 | |||
| Hg |
0.72 | -0.02771046 | -0.02 | |||
| Zn |
513 | -0.00014252 | -0.07 | |||
| Constant |
-0.02 | -0.02 | ||||
|
Total |
178.7 |
| Table 15.5: | NSR Make-up by Individual Revenues and Charges |
| Item | Metal | Cu Concentrate | Pyrite Concentrate | |||
| Payable Metal Value |
Au | 80.26 | 102.69 | |||
| - Refinery Charge |
Ag | 8.31 | 4.76 | |||
| Cu | 8.34 | |||||
| Total | 96.91 | 107.45 | ||||
| Treatment Charge |
Au | -1.16 | -9.97 | |||
| Ag | -0.12 | -0.46 | ||||
| Cu | -0.12 | |||||
| Realisation Costs |
Au | -2.48 | -8.34 | |||
| Ag | -0.26 | -0.39 | ||||
| Cu | -0.26 | |||||
| Penalties |
As | -1.15 |
| Effective Date January 1, 2021 | Aris Gold | |||
| Page 194 of 384 |
| SRK Consulting | Soto Norte NI 43-101– Feasibility Study |
| Item | Metal | Cu Concentrate | Pyrite Concentrate | |||
| Sb | -0.70 | |||||
| Bi | -0.12 | |||||
| Cd | -0.05 | |||||
| F | -0.02 | |||||
| Hg | -0.07 | |||||
| Zn | 0.00 | |||||
| Te |
The key assumptions associated with the NSR development are:
| ● | Copper concentrate freight and treatment charges are allocated between gold, silver, and copper proportional to the payable value of each metal. |
| ● | Copper concentrate penalties from arsenic, antimony, bismuth, cadmium, mercury, and zinc are calculated at a rate representing the average of the LoM concentrate grade. |
| ● | Pyrite concentrate mass pull is linearly proportion to the head grade of sulphur; hence, pyrite concentrate freight and treatment charges are also proportional to the sulphur assay. |
NSR values were estimated for individual blocks in the block model using the following formula:
NSR (USD) = 36.1759 x (gold grade g/t Au) + 0.4426 x (silver grade g/t Ag) + 0.0046 x (copper grade ppm Cu) – 4.5752 x (sulphur grade %S) – 0.0037 x (arsenic grade ppm As) – 0.0082 x (antimony grade ppm Sb) – 0.0065 x (bismuth grade ppm Bi) – 0.0067 x (cadmium grade ppm Cd) – 0.277 x (mercury grade ppm Hg) – 0.0001 x (zinc grade ppm Zn) – 0.02
The following is an example of how the NSR value (USD) is estimated for individual blocks with unique grades:
Block Grade:
| ● | Gold grade = 4.96 g/t Au |
| ● | Silver grade = 28.7 g/t Ag |
| ● | Copper grade = 1740 ppm Cu |
| ● | Sulphur grade = 4.19% S |
| ● | Arsenic grade = 313 ppm As |
| ● | Antimony grade = 85 ppm Sb |
| ● | Bismuth grade = 18.1 ppm Bi |
| ● | Cadmium grade = 8 ppm Cd |
| ● | Mercury grade = 0.72 ppm Hg |
| ● | Zinc grade = 513 ppm Zn |
NSR value (rounded):
NSR (USD) = (36.1759 x 4.96) + (0.4426 x 28.7) + (0.0046 x 1740) – (4.5752 x 4.19) – (0.0037 x 313) –
| Effective Date January 1, 2021 | Aris Gold | |||
| Page 195 of 384 |
| SRK Consulting | Soto Norte NI 43-101– Feasibility Study |
(0.0082 x 85) – (0.0065 x 18.1) – (0.0067 x 8) – (0.277 x 0.72) – (0.0001 x 513) – 0.02 = USD 178.7
The generalised formula for estimating the breakeven NSR cut-off (“NSR_BE”) is as follows:
NSR_BE = Operating Costs (Mine + Mill + G&A) + Royalties + (Sustain Capital / Production Rate)
The initial cost inputs estimated for the NSR_BE calculation were as follows:
NSR_BE = 27.24 + 12.26 + 11.13 + 8.78 + 13.56 = USD72.97
It must be noted that the breakeven NSR cut-off does not consider selling costs as they have already been captured in the NSR value estimates.
A detailed HoV evaluation was undertaken over a range of NSR cut-off value and production rate scenarios to assess the project economics. The HoV assessment (Figure 15.1) showed an optimal NSR cut-off value of USD120/t and production rate of 2.6 Mtpa, which has been used as the basis for the mine plan supporting the Mineral Reserve estimate.
The resultant stope optimiser shapes, which considered the described NSR cut-off above USD120/t and modifying factors, were prepared for the final mine design by removing any irregular or minor isolated stope shapes as well as stope shapes that were within the 30 m crown pillar, outside the current lease boundaries, or would interfere with planned infrastructure.
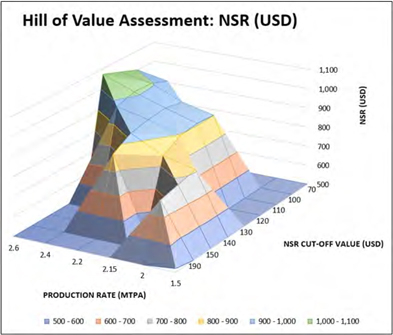
Figure 15.1 Hill of Value Results
| 15.4 | Mineral Reserve Estimate Summary |
The Mineral Reserve estimate have been prepared in accordance with CIM standard definitions for Proven Mineral Reserves and Probable Mineral Reserves. The Indicated Mineral Resources reported above include those Mineral Resources modified to estimate the Mineral Reserves.
The Mineral Reserve has been estimated using accepted industry practices for underground mines, including the identification of the optimal final mining envelope(s) based on the selected mining methods,
| Effective Date January 1, 2021 | Aris Gold | |||
| Page 196 of 384 |
| SRK Consulting | Soto Norte NI 43-101– Feasibility Study |
appropriate modifying factors and cut-off value calculations based on detailed cost estimation. The identified mining envelopes were subjected to detailed mine design, scheduling and the development of a cash flow model incorporating Minesa’s technical and economic projections for the mine for the duration of the LoMP.
Any mineralisation which occurs below the cut-off value or is classified as an Inferred Mineral Resource is not considered as Mineral Reserves and is treated as mineralised waste for the purposes of the LoMP. The Mineral Reserve estimate for the Soto Norte Project is stated in Table 15.6, effective 01 January 2021.
An AuEQ grade and contained ounces has been separately included in the mineral reserve estimate based on the NSR formula to determine equivalent values for copper and silver in relation to gold, considering process recoveries, metal prices, realisation costs and payabilities for each metal. The gold value used in the AuEQ estimate also carries the full cost of penalty elements.
| 15.4.1 | Factors That May Affect the Mineral Reserve Estimate |
Factors that may affect the Mineral Reserve estimate include:
| ● | Long-term commodity price assumptions. |
| ● | Long-term exchange rate assumptions. |
| ● | Long-term consumables price assumptions. |
| ● | Assumptions as to the continued ability to access the site, retain mineral and surface rights titles, obtain environmental and other regulatory permits, and obtain the social licence to operate. |
Other factors that can affect the estimates include additional drilling and sampling data, changes to the Mineral Resources input parameters, constraining stope designs, cut-off grade assumptions, geotechnical and hydrogeological factors, metallurgical and mining recovery assumptions, and the ability to control unplanned dilution.
Skilled TBM tunnelling personnel (and management) will be critical in providing tunnel access and materials handling between the mine and process facilities. Skilled mining contractors are also an important component of achieving the mine plan (development and production targets) who will take a lead role in developing the mine for the initial years with mobile equipment to be covered by a Maintenance and Repair Contract (“MARC”) with the Original Equipment Manufacturer (“OEM”) for the initial five years of the mine life. Over this period, the mine will train up local operators who will develop into skilled operators as the mine makes the transition into a fully owner-operator site.
Commencement of mine development and operation will require granting of the exploitation licence.
| 15.5 | Relevant Factors |
SRK is not aware of any environmental, permitting, legal, title, taxation marketing or other factors that could materially affect the estimation of Mineral Reserves that are not discussed in this Technical Report.
| Effective Date January 1, 2021 | Aris Gold | |||
| Page 197 of 384 |
| SRK Consulting | Soto Norte NI 43-101– Feasibility Study |
| Table | 15.6: Soto Norte Mineral Reserves Effective 01 January 2021(1, 2, 3, 4) |
| Classification | Tonnes | Gold | Silver | Copper | Gold Equivalent | |||||||||||||||||
| AuEQ | AuEQ | |||||||||||||||||||||
| (kt) | (g/t) | (koz) | (g/t) | (koz) | (%) | (klb) | (g/t) | (koz) | ||||||||||||||
| Proven | - | - | - | - | - | - | - | - | - | |||||||||||||
| Probable | 24,767 | 6.22 | 4,950 | 34.4 | 27,386 | 0.19 | 102,868 | 6.95 | 5,535 | |||||||||||||
| Proven + Probable |
24,767 | 6.22 | 4,950 | 34.4 | 27,386 | 0.19 | 102,868 | 6.95 | 5,535 | |||||||||||||
(1) All figures are rounded to reflect the relative accuracy of the estimate and have been used to derive sub-totals, totals and weighted averages. Such estimates inherently involve a degree of rounding and consequently introduce a margin of error. Where these occur, SRK does not consider them to be material. Indicated Mineral Resources are inclusive of those Mineral Resources modified to produce Mineral Reserves; that is, they are reported on an ‘inclusive basis’. The Concession is wholly owned by and exploration is operated by Sociedad Minera de Santander S.A.S.
(2) The standard adopted in respect of the reporting of Mineral Reserves for the Project, following the completion of required technical studies, is in accordance with the NI 43-101 guidelines and the 2014 CIM Definition Standards, and have an Effective Date of 01 January 2021.
(3) SRK reasonably expects the Soto Norte deposit to be amenable to a variety of underground mining methods and the mine plan supporting the Mineral Reserve estimate is primarily based on Modified Avoca with additional backfill waste sourced from an underground quarry. Mineral Reserves are reported at an NSR cut-off estimate based on metal price assumptions, metallurgical recovery assumptions from initial testwork, mining costs, processing costs, general and administrative (G&A) costs, and other NSR factors that were estimated at the time of mine planning. The final NSR calculation is based on average assumptions for the deposit and determined using NSR (USD) = 36.1759 x (gold grade g/t Au) + 0.4426 x (silver grade g/t Ag) + 0.0046 x (copper grade ppm Cu) – 4.5752 x (sulphur grade %S) – 0.0037 x (arsenic grade ppm As) – 0.0082 x (antimony grade ppm Sb) – 0.0065 x (bismuth grade ppm Bi) – 0.0067 x (cadmium grade ppm Cd) – 0.277 x (mercury grade ppm Hg) – 0.0001 x (zinc grade ppm Zn) -0.02. Metal price assumptions considered for the calculation of metal equivalent grades: gold (USD1,300/oz), silver (USD18/oz), copper (USD7,000/t). NSR and Cut-off value calculations assume average metallurgical recoveries: gold (92.5%), silver (92%), copper (76%). The NSR cut-off value of USD120/t and production rate of 2.6 Mtpa has been used as the basis for the mine plan supporting the Mineral Reserve estimate. A Gold Equivalent (AuEQ) grade and contained ounces has been separately included in the mineral reserve estimate based on the NSR formula to determine equivalent values for copper and silver in relation to gold, taking into account process recoveries, metal prices, realisation costs and payabilities for each metal. The gold value used in the AuEQ estimate also carries the full cost of penalty elements.
(4) SRK has completed a site inspection of the deposit by Mr Chris Bray BEng MAusIMM (CP), an appropriate “independent qualified person” as defined in National Instrument 43-101.
| Effective Date January 1, 2021 | Aris Gold | |||
| Page 198 of 384 |
| SRK Consulting | Soto Norte NI 43-101 – Feasibility Study |
| 16 | MINING METHODS |
| 16.1 | Introduction |
The parallel vein systems in the Soto Norte Project area are defined over a strike length of 2.6 km and the two main vein systems considered, Mascota and Gigante, each have strike lengths of around 2.0 km. Other minor vein structures of mining interest have strike lengths as low as 15 m.
The majority of vein structures are sub vertical, dipping from 70 to 80° and can range in true width from 1 m or less to over 30 m (typically between 3 and 18 m). There are some vein structures in the hangingwall zones which dip at 60°, and an isolated zone in the southwest where the vein lays over on a 15° dip, closer to surface.
The vein structures extend to surface, with significant variances in elevation due to the terrain, and are open at depth and along strike. The depth limit of the resources considered for mining is 2,100 mRL.
The minimum stope width defined for mining is 2.5 m and stoping blocks are categorised as follows:
| ● | Longitudinal narrow stoping for stope widths from 2.5 to 5 m |
| ● | Bulk (or wide) longitudinal stoping for stope widths greater than 5 m. |
The predominant mining method considered for the Project is Modified Avoca for stoping blocks identified as longitudinal narrow and wide stopes. CRF is applied to limited specific areas of poor ground classification. Table 16.1 provides a summary of the split of development and stope production ore in the LoMP and the mining method applied.
Table 16.1: Summary of Mining Methods
| Development and Stope Type | Mining Method | % Ore Tonnes | % Gold Ounces | |||
| Ore Development |
Jumbo Development | 17% | 15% | |||
| Longitudinal Narrow |
Modified Avoca | 19% | 17% | |||
| Longitudinal Wide |
Modified Avoca | 64% | 68% | |||
| Total | 100% | 100% | ||||
The mine plan supporting the Mineral Reserve targets a sustainable production rate of 2.6 Mtpa over a 7-year period. The ramp up to full production is five years with two years of initial ore development prior to the process facilities being operational, outlined as follows:
| ● | The mine design is separated into a number of mining zones due to the extensive strike length and depth of the deposit. A number of underground accesses have been incorporated to enable timely entry and egress, optimise materials handling to the process facilities and provide sufficient ventilation to working areas. |
| ● | An access tunnel will be developed using a TBM from the Padilla site to the underground mine, a distance of approximately 6.9 km (Figure 16.1). The mined ore will be crushed underground and conveyed at a rate of 2.6 Mtpa to a processing facility located on the surface at Padilla. The processing facility will produce saleable gold concentrates. |
| ● | The Emboque zone is designed with decline access from surface with a separate ventilation adit from El Cuatro. The La Bodega zone is accessed through the Emboque decline on a connecting level (2,610 mRL). |
| Effective Date January 1, 2021 | Aris Gold | |||
| Page 199 of 384 |
| SRK Consulting | Soto Norte NI 43-101 – Feasibility Study |
| ● | The mine utilises Modified Avoca as the primary mining method (Overhand sequence) and CRF to backfill limited areas of poor ground. A significant amount of waste is required for the mining method to use as both a working platform between levels and to maintain ground stability. |
| ● | To produce enough waste for the mining method approaches, underground quarry waste stopes are designed to supplement the development waste generated. The waste used in the mine plan will be utilised in several forms including unconsolidated, cement reinforced, and grout injected depending on the mining method applied and sequence of the mining cycle. Once the individual waste stopes are completed there is an opportunity to store dry filtered tailings underground. |
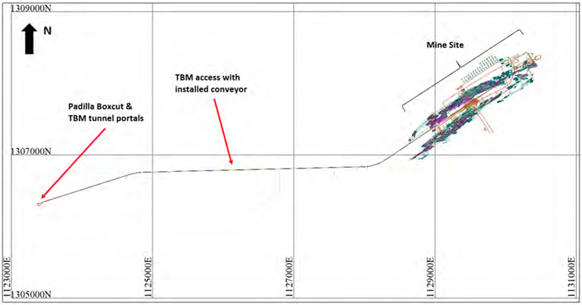
Figure 16.1: Plan of Padilla Boxcut, Access Development and Production Stopes
| 16.2 | Mining Access and Layout |
| 16.2.1 Tunnel Access | |
The tunnel access development from Padilla will be initiated using the New Austrian Tunnel Method (“NATM”), also known as the Sequential Excavation Method approach, where ground conditions are assessed through progressive geotechnical site investigation. The distance from Padilla to the mine location is approximately 5.6 km and the single TBM tunnel access is described as follows:
| ● | The tunnel has been designed with a minimum finished 8 m bore. This size of tunnel has been selected due to the haulage profile of the underground truck fleet and the location of the underground conveyor. The underground conveyor is installed for the primary purposes of moving RoM out of the mine to the process facilities at Padilla but will also be used for moving waste out of the mine in the initial years of operation and the transport of dry filtered tailings back into the underground mine later in the mine life for storage in the underground waste quarry stopes. |
| ● | The tunnel is designed with a positive gradient of 1.7% for the entire length of the alignment. The first straight segment is 1.23 km before entering an 800 m radius turn for a length of 210 m, the next segment is 3.12 km in length on a straight alignment. The tunnel then enters a 600 m radius turn for a distance of 325 m and then proceeds on a straight alignment for 1.93 km. Total length of the tunnel (including the 70 m starter tunnel) is 6.9 km. |
| Effective Date January 1, 2021 | Aris Gold | |||
| Page 200 of 384 |
| SRK Consulting | Soto Norte NI 43-101 – Feasibility Study |
The TBM tunnel access allows easier management of ventilation, ground conditions, and water drainage over this distance. A schematic of the TBM tunnel access profile, looking from Padilla, is provided in Figure 16.2, showing a loaded MT65 truck for scale.
Due to the known poorer ground conditions for tunnelling near Padilla, a substantial box cut (Figure 16.3) has been designed into the hillside, which will bypass some of the initial tunnelling challenges. The initial tunnel access will be driven using the NATM and jumbos over 40 m followed by development of a TBM launch chamber (10 mW x 10 mH over a length of 29 m).
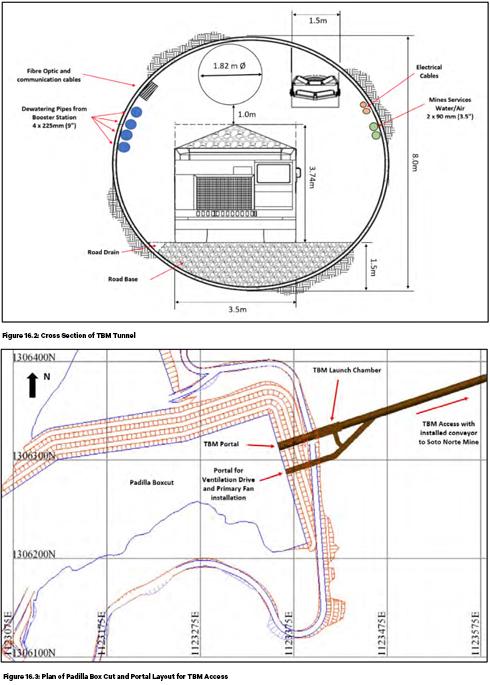
The declines and inclines in the Soto Norte mine design maintain a stand-off distance of more than 50 m from the orebody footwall and any stoping activities to minimise any risk of influence on ground conditions. The declines and inclines were designed at a grade of 1:7, except the portal entrance, which is designed at
| Effective Date January 1, 2021 | Aris Gold | |||
| Page 201 of 384 |
| SRK Consulting | Soto Norte NI 43-101 – Feasibility Study |
a 1:20 incline to facilitate water drainage.
Level development is located every 120 to 150 m along the length of the decline which will be utilised as stockpiles or muck bays. Operating stockpiles are located within each level for loading trucks. Stockpiles are 20 m long and have a 1:50 incline from the decline.
Figure 16.4 and Figure 16.5 provide respective plan and a long views of the underground accesses and underground development. Figure 16.6 provides an oblique view of the mine design showing access and ventilation development, production stopes and underground quarry stopes. Figure 16.7 provides a vertical section view in the vicinity of the Emboque decline showing the terrain. Figure 16.8 provides a typical level section through all zones on the 2,430 mRL, showing the location of main access, ventilation, and pass infrastructure.
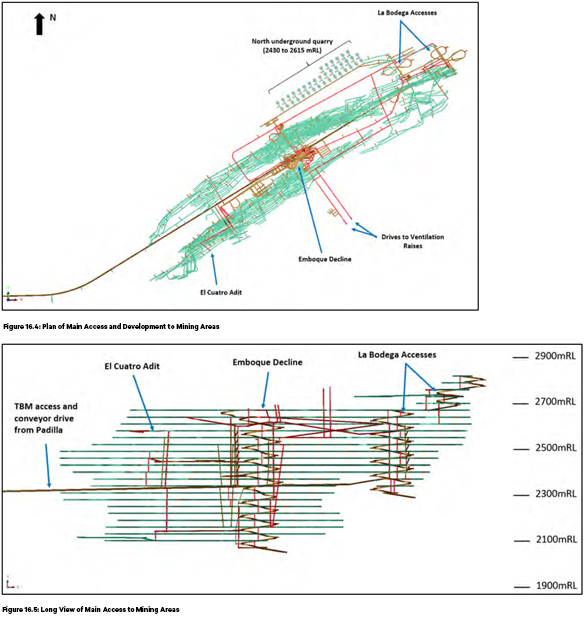
| Effective Date January 1, 2021 | Aris Gold | |||
| Page 202 of 384 |
| SRK Consulting | Soto Norte NI 43-101 – Feasibility Study |
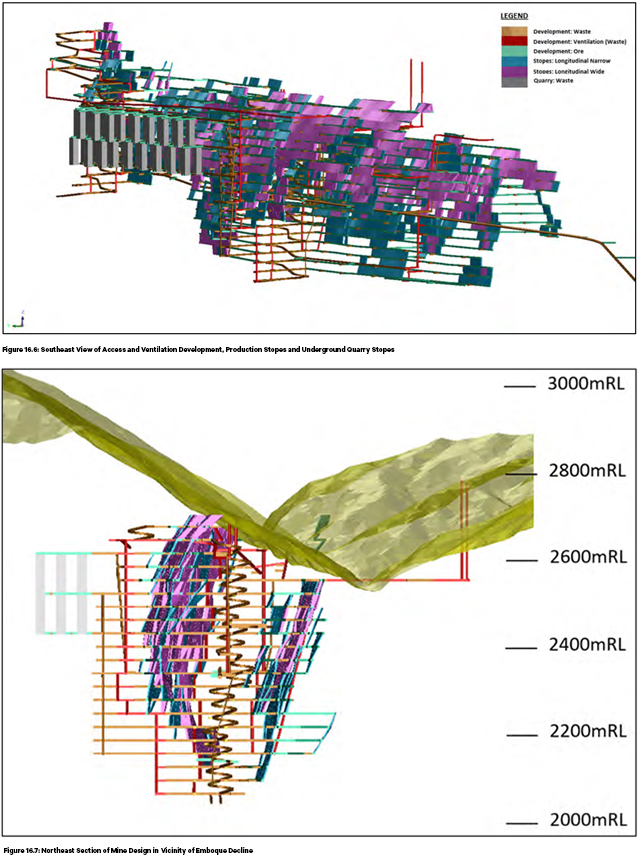
| Effective Date January 1, 2021 | Aris Gold | |||
| Page 203 of 384 |
| SRK Consulting | Soto Norte NI 43-101 – Feasibility Study |
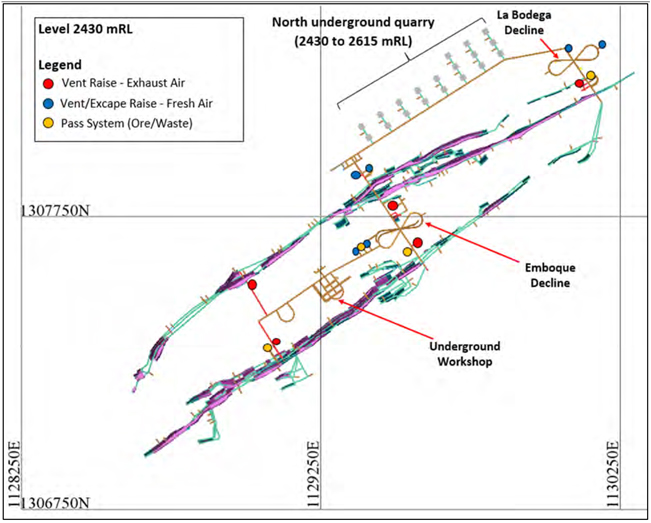
Figure 16.8: Plan of All Zones on Level 2,430 mRL
| 16.2.2 | Tunnel Profiles and Development |
The main access tunnel profiles are planned at a dimension of 5.5 mW x 5.5 mH which provides enough space for a loaded 65 t truck, which is to be the largest mobile equipment operating in the mine. Figure 16.9 shows the design profile layout for services in a drive of this size taking into consideration that it some areas it will need to include:
| ● | Ventilation ducting and fans up to 1,400 mm diameter |
| ● | Dewatering lines from the pump stations |
| ● | Fibre optic and communication cables |
| ● | Electrical cables for high (HV) and low (“LV”) voltage |
| ● | Road base. |
Figure 16.10 shows an example profile of an ore drive at a dimension of 5.0 mW x 5.5 mH which needs to provide enough space for up to two ventilation ducts and 65 t truck (ejector) for backfilling.
| Effective Date January 1, 2021 | Aris Gold | |||
| Page 204 of 384 |
| SRK Consulting | Soto Norte NI 43-101 – Feasibility Study |
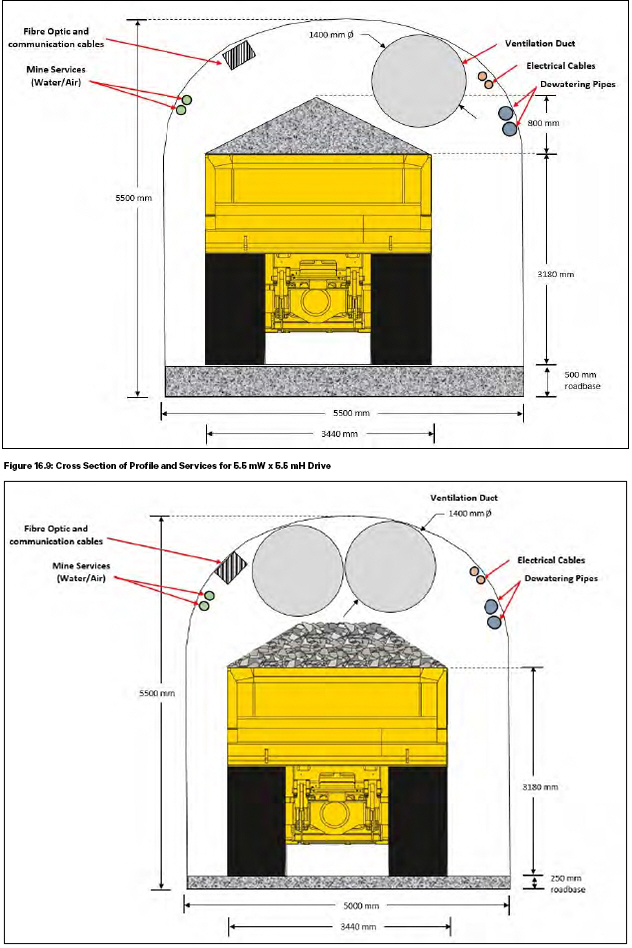
| Effective Date January 1, 2021 | Aris Gold | |||
| Page 205 of 384 |
| SRK Consulting | Soto Norte NI 43-101 – Feasibility Study |
| 16.3 | Mine Geotechnical |
| 16.3.1 | Introduction |
The geotechnical work undertaken to support the FS mine design was carried out by Minesa. The raw data generated for geotechnical characterisation including geotechnical core logging and laboratory testing along with detailed analysis results that were used to inform mine design criteria.
As part of the geotechnical study, SRK undertook global and local geotechnical numerical modelling in FLAC3D based on the 3D geotechnical model completed by Minesa and a version of the mine design and schedule that was available in February 2020.
| 16.3.2 | Work Summary |
Geotechnical Dataset
A large suite of geotechnical data collected from borehole core was utilised to build up a high quality, comprehensive database of geotechnical information for underground design. The full mine geotechnical database comprised:
| ● | Over 226,000 m of borehole core that was geotechnically logged using Bieniawski’s RMR89 and Barton’s Q (1993) classification systems |
| ● | A structural database comprising over 56,000 orientated discontinuity readings generated from down-hole acoustic televiewer imaging of 67 drillholes (30,000 m of core drilling) |
| ● | A strength testing database comprising the results of: |
| ○ | 187 laboratory uniaxial compressive strength tests |
| ○ | 69 laboratory triaxial strength tests of 69 samples |
| ○ | 23 laboratory tensile strength tests |
| ○ | 41 laboratory joint shear strength tests |
| ○ | over 26,000 point load index strength tests. |
| ● | Geotechnical mapping of 30 surface and 30 underground stations in the mine area, and 52 surface stations west of the mine and around the main access tunnel. |
A significant amount of high quality, spatially relevant rock mass and structural data has been collected. Extensive use has been made of the data to develop a detailed 3D geotechnical block model in Leapfrog Geo using the Q and RMR classification system. The model was fully populated using Ordinary Kriging taking into consideration the presence and orientation of dominant structures, faults and shear zones. A number of sub-blocked models were created that included the five main veins (which represent 84% of the resource), areas containing the production development and areas containing the non-production development. These models were used to inform the detailed stope and development stability assessments.
Stope and Development Stability and Support
The industry standard Modified Stability Graph method was used for geotechnical stope design. Depth of mining, an estimate of in situ stress (using the modified Sheory Method) and mining induced stress concentrations developed using ocscience RS2 finite element modelling were used in conjunction with area
| Effective Date January 1, 2021 | Aris Gold | |||
| Page 206 of 384 |
| SRK Consulting | Soto Norte NI 43-101 – Feasibility Study |
specific Q’ values, strength estimates and joint condition to develop area specific Modified Stability Graph N values. The standard stope dimension used for the study is 30 m high by 15 m long. For this stope dimension, a number of stability and dilution categories were developed, as shown in Table 16.2.
The distribution of calculated N values was represented in the geotechnical block model to identify areas of potentially unstable stopes of standard dimension. The distribution of N’ values in the hangingwall of the Gigante vein is shown in Figure 16.11.
Table 16.2: N’ Stability Ranges Used in Rock Mass Assessment for 30 m high / 15 m long Stopes
| N’ stability range | Stability category | Dilution category | ||
| < 0.1 (Red) | Unstable transitional, potentially unstable | > 20% | ||
| 0.1 – 1.2 (Yellow) | Stable with support | > 20% | ||
| 1.2 – 6.0 (Green) | Stable transitional | 10 – 20% | ||
| > 6.0 (Blue) | Stable | 5 – 10% | ||
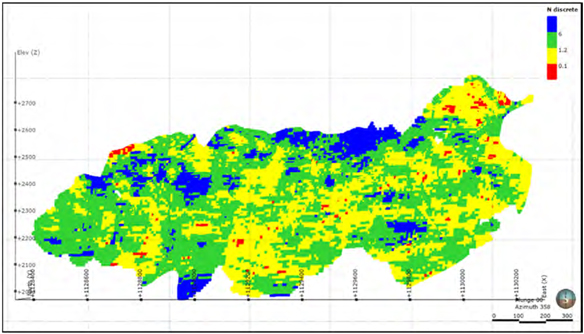
Figure 16.11: Long Section of Gigante Hangingwall N’ Stability Model
Using the standard stability graph, cable bolt design charts along with the empirical dilution graph developed by Sourineni et al (2016), cable bolt design requirements and dilution estimated were applied to each N’ category for the standard stope dimensions, as shown in Table 16.3. Due to the steeply dipping nature of the orebody, a conservative assumption has been made that cable bolting will be applied to both the hangingwall and footwall of the in-stope development. The minor portion of stopes within very poor-quality ground will be mined using CRF to prevent instability. Poor-quality ground should be mined with a maximum 15 m span along strike, leaving 5 m rib pillars or using local adjustments to the sublevel height.
Table 16.3: N’ Stability and Dilution Categories and Ground Support Requirements
| N’ range | Dilution | Stability | Cable length (m) |
Cable spacing (m) |
Cable / linear m of production drive | |||||
| < 0.1 | 20.0% | Unstable transitional | 9 - 13 | 1.0 - 1.5 | 102 | |||||
| Effective Date January 1, 2021 | Aris Gold | |||
| Page 207 of 384 |
| SRK Consulting | Soto Norte NI 43-101 – Feasibility Study |
| N’ range | Dilution | Stability | Cable length (m) |
Cable spacing (m) |
Cable /linear m of production drive | |||||
|
0.1 - 1.2 |
20.0% | Stable with support | 6 - 9 | 1.5 - 2.0 | 49 | |||||
|
1.2 - 6.0 |
10 – 20% | Stable transitional | 6 - 9 | 2.0 - 2.5 | 37 | |||||
|
> 6.0 |
5 – 10% | Stable | 6 - 9 | 2.0 - 2.5 | 37 |
All data generated were input to the mine plan and economic model.
For production and non-production development, a similar approach was used with the intersection of the 3D geotechnical sub-block model with the design layout being used to define percentage or development lying within specific rock mass classes, of which seven classes were defined. The Q support design chart and kinematic stability analysis using the Rocscience code UnWedge were used to develop support recommendations.
3D Numerical Modelling
Three-dimensional numerical modelling was used to assess potential zones of high stress concentrations in the mining sequence using the elastic boundary element code MAP3D. Identified high stress zones were then modelled in more detail using local models developed in the inelastic finite difference code FLAC3D.
The local model aimed to assess stope stability and highlight the zones of high stress concentration in the Emboque sector while incorporating the effect of backfill and elastoplastic rock mass behaviour.
Mine Access Tunnels
For the TBM access tunnel, in addition to the portal site investigation holes, several boreholes were drilled from surface close to the tunnel alignment to provide rock mass characterisation data along the length of the tunnel. These data were used to estimate rock support requirements using a combination of the empirical Q support design chart, kinematic stability analyses and 3D finite element modelling.
Gall Zeidler Consultants (“GZ”) is a leading consulting group for geotechnics, tunnel engineering and tunnel construction management with specialised experience in TBM and NATM tunnelling methods. GZ carried out a geotechnical assessment in 2018 and confirmed that both a Double Shielded TBM and Gripper-Type TBM are suitable for development of the Soto Norte access tunnel from Padilla. The geomechanical properties of the tunnel alignment indicate that the gripper machine is suitable for 98% of the tunnel alignment (when considering the entire length of the tunnel in the mining area) without ground improvement.
Minesa also undertook numerical modelling using RocScience RS3 Software which uses the Finite Element Modelling (“FEM”) approach to simulate the stability of the access tunnels and sensitivity to variations on in-situ stress regime.
| 16.3.3 | Conclusions and Recommendations |
SRK carried out the 2017 PFS geotechnical study for Soto Norte and has been involved in a review capacity for the Feasibility Study. Based on this long association with the Project, SRK can attest to and confirm that the geotechnical database on which the mine geotechnical analyses are based is very comprehensive, spatially relevant, and of a high quality.
| Effective Date January 1, 2021 | Aris Gold | |||
| Page 208 of 384 |
| SRK Consulting | Soto Norte NI 43-101 – Feasibility Study |
The 3D geotechnical model has allowed the spatial variability of the rock mass to be determined and geotechnical mine design parameters to be developed to a high degree of accuracy. Methodologies used for stope dimensioning, stope support and development support are appropriate and to international standards. The use of numerical modelling techniques to support some of the empirical assessments are appropriate.
The work undertaken to develop ground conditions, excavation and support requirements for the TBM access tunnel is entirely appropriate for a feasibility study.
The Project risks associated with the understanding of the geotechnical conditions are low. SRK considers that there are several risks that will require addressing and mitigating during further study iterations or during preliminary mine development. These are:
| ● | The underground capital infrastructure and proposed quarry stopes lie outside the boundary of the 3D geotechnical model. Whilst ground support has been estimated using average deposit rock mass conditions, there is no location specific rock mass information for these large excavations. Specific ground investigation programmes will need to be commissioned for these prior to final design and excavation. |
| ● | The mine is located in a structurally complex area with a potentially complex in situ stress regime. In situ stress is an important input into numerical models; however, for the numerical models, in situ stress estimates have been made using empirical equations and with reference to the World Stress Map. To improve and validate the numerical modelling site specific in situ stress measurements will be required at some stage. This can either by done in deep boreholes or during initial trial mining. |
| ● | For the TBM access tunnel, out of necessity, geotechnical conditions have been interpolated over long distances between site investigation boreholes. It is possible that the ground conditions between boreholes may be better or worse than interpreted and that the excavation methods and support requirements may need to be modified. Probe drilling will need to be employed during tunnel excavation to confirm ground conditions ahead of the advancing face. |
| ● | This geotechnical modelling was conducted using assumed theoretical stresses, however, the models should be computed with real field stress measurements once these become available. It is recommended to carry out further sensitivity models varying the initial stress state to address the possible outcomes when higher horizontal or higher vertical stresses occur. |
| 16.4 | Mine Water Management |
| 16.4.1 | Introduction |
The importance of water resources in the vicinity of the Project was recognised early in the Project development process. Several studies were commissioned to collect and evaluate baseline data and use these to develop conceptual and numerical models to support the engineering designs and evaluate the potential impacts (described in Section 20.6).
Figure 16.12 presents the Project area drainage system relative to the underground mine, TBM tunnel alignment and Padilla facilities. The catchment area shown is for the Punta Panaga gauging station which measures flow on Vetas river at its confluence with the Suratá river. The Vetas is a tributary of the larger Suratá river, although it contributes more flow than the Suratá itself at this location as the Project is located in the headwaters of the Suratá river. The underground mine, shown in orange on Figure 16.12, is located in the upper reaches of the La Baja stream which is a tributary of the Vetas river. Figure 16.13 shows the
| Effective Date January 1, 2021 | Aris Gold | |||
| Page 209 of 384 |
| SRK Consulting | Soto Norte NI 43-101 – Feasibility Study |
drainage of the project area in more detail along with average stream flows obtained from the baseline flow accretion surveys.
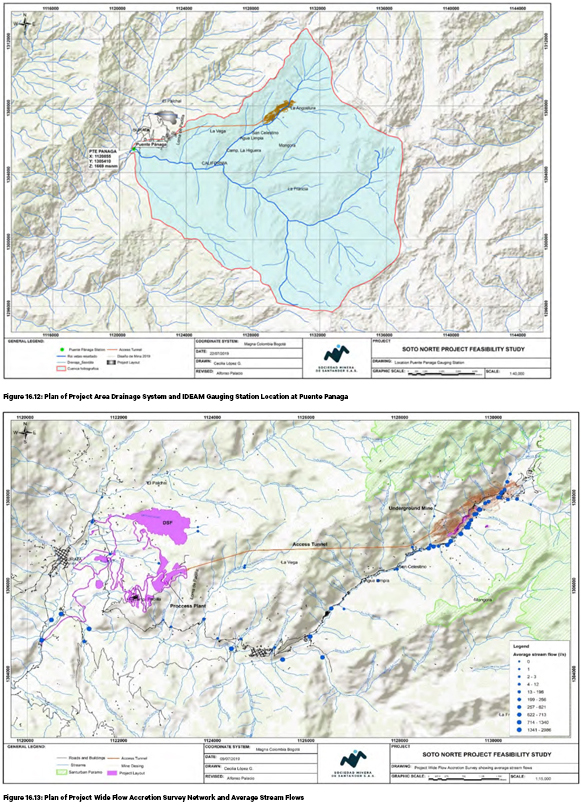
The remainder of this section presents a summary of:
| Effective Date January 1, 2021 | Aris Gold | |||
| Page 210 of 384 |
| SRK Consulting | Soto Norte NI 43-101 – Feasibility Study |
| ● | Surface water management plans. |
| ● | Groundwater management plans for the underground mine (included dewatering design and grouting plans). |
The following components of the mine water management plan are presented in Section 18.7:
| ● | Site water balance. |
| ● | Water treatment requirements. |
| ● | Water management during mine closure. |
| 16.4.2 | Surface Water Management |
The mine area sits within the La Baja catchment, with its two key tributaries (Angostura and Paez) draining the upland páramo. The La Baja stream joins the Vetas river, which ultimately discharges into the Suratá river. The Padilla plant site, including DSF and associated water treatment facilities, have been planned in minor tributaries of the Suratá river. Larger stream flows are sustained by groundwater discharged baseflow but are highly variable in response to rainfall events.
Local Water Resources
Local stream water sources in Soto Norte are classified with a high-Water Regulation Index (“WRI”), meaning the combination of climate, soils, hydrogeology and land use provide high water production during both dry and wet seasons. Several streams in the area, however, are classified with high to critical Water Use Index (“WUI”), which means that the existing use amongst the communities is causing stress on some streams due to a non-regulated nature of local water intake. Figure 16.14 shows the WUI for catchments within the project Area of Interest (“AoI”). The greatest stresses are observed in the vicinity of the California community and the upper reaches of La Baja where water demand is largely driven by small scale mining activities. The WUI for the Padilla area is either low or very low indicating little stress on water resources in this area.
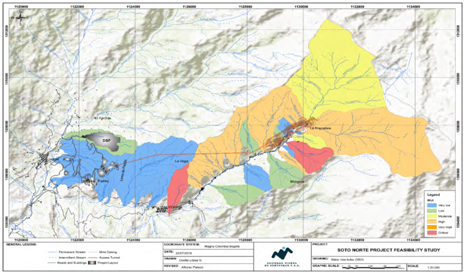
Figure 16.14: Plan of Water Use Index in Project AoI Catchments (Source: ESIA, 2019)
Baseline Water Quality
Baseline water quality has been evaluated against standard Colombian hydrological indices.
| Effective Date January 1, 2021 | Aris Gold | |||
| Page 211 of 384 |
| SRK Consulting | Soto Norte NI 43-101 – Feasibility Study |
| ● | Water Quality Index (IDEAM, 2011) |
| ● | Potential Water Quality Alteration Index (IDEAM, 2013). |
The predominant water quality in the Project area is ‘Acceptable’ with some local streams of “Regular” and “Poor” quality. The water resource is also of high potential for contamination due to non-regulated mining activities, especially in California and Vetas, and the lack of sewage treatment plants in the rural area. The Soto Norte underground mine will be located in the upper portion of the La Baja stream which is of poor quality due to small scale mining operations discharging their wastewater without treatment. The lower portions of the La Baja stream show better quality due to dilution by non-impacted tributaries.
The predominant water use is related to industrial processes, out of which small mining operations are the most relevant.
Operational Surface Water Management
Non-contact water systems consisting of diversion channels are proposed for the principal mine facilities in the Padilla area. The channels are provided at the upstream side to divert non-contact surface water away from the process facilities and then discharge to natural drainage courses leading to the Suratá river.
The roads will have their own drainage works with culverts to allow the free flow of stormwater and existing streamflow. A new bridge will be built where the TBM tunnel access road intersects with the Vetas River. All these points are included as part of the stream intervention permits requested in the environmental license (Section 7.4 of the EIA).
The drainage system of the DSF is defined by the deposition plan and growth of the facility and this is discussed in more detail in Section 18.6. In summary, the DSF drainage approach includes the following key components:
| ● | Diversion channels around the DSF to collect non-contact water. This system is complemented with French drains installed along small transverse dykes upstream of the deposition, which will be connected to the diversion channels. These filters will be built in different stages in advance of the deposition plan and will be covered with dry filtered tailings. |
| ● | Flow-through drains above the liner system to collect contact water and convey it to the collection pond, where water will be pumped to the Water Treatment Plant. |
| ● | Flow-through drains below the liner system to allow free flow of existing seepages and streams, minimising the risk of pore pressure build up underneath the facility. |
| 16.4.3 | Ground Water Management |
A complete hydrogeological assessment was carried out by SRK for the PFS, FS, and EIA development with the purpose of determining the following:
| ● | Hydrogeological area of influence |
| ● | Any potential impacts of underground mining on surface streams |
| ● | Develop environmental management plans to guarantee the water supply for the local community that could be potentially affected |
| ● | Mine dewatering and grouting strategies |
| Effective Date January 1, 2021 | Aris Gold | |||
| Page 212 of 384 |
| SRK Consulting | Soto Norte NI 43-101 – Feasibility Study |
| ● | Mine water treatment. |
To determine the above-mentioned points, conceptual and numerical models were constructed, requiring data inputs from surface and subsurface parameters such as lithology, structures, geomechanics, hydraulic properties, water quality, water levels and stream flows, amongst others. The key sources of information that were used to build the hydrogeology models are:
| ● | Geology and structural features: these were used to group the geological units and structures, that exert a strong control on groundwater behaviour. Given that the rocks in the Project area do not have significant primary permeability, fracturing and faulting are the key features that generate secondary permeability, hence controlling groundwater recharge, flow and discharge. Understanding regional and local geology is the basis of the hydrogeological conceptual model, which is the first step to define the hydrogeological units. |
| ● | Hydraulic testing: packer, slug and pumping tests have been carried out in the Project area since 2010. The data from these tests allowed the assessment of hydraulic properties (conductivity and transmissivity) in the different lithologies of the Project area. This is the second step to refine the boundaries and properties of the hydrogeological units that are built into the models. |
| ● | Groundwater levels: more than 50 vibrating wire piezometers (“VWP”) and 20 standpipe piezometers have been installed in the Project area since 2010. Data from the piezometer network were complemented with water level data from the northeast of the Project, collected by Ausenco in 2012 and 2013. Groundwater levels were used to determine the flow pathways, recharge and discharge areas. |
| ● | Hydro-geochemistry: a total of 18 water samples from the Paez Lake, standpipe piezometers and water springs were analysed by a certified chemical laboratory. The results were used to assess the groundwater baseline quality and to determine the correlation between different water sources using Piper and Stiff diagrams. |
| ● | Isotopic analyses: a total of 1,017 water samples were taken for isotopic assessment with 1,013 of these samples analysed for deuterium (2H+) and 18-Oxygen (18O), and four analysed for tritium (3H). All samples were analysed in the Environmental Isotope Laboratory of the University of Waterloo in Canada. The isotope analysis provided enough information to assess any relationship between water sources and by doing so, proved that no relationship exists between the páramo water, deep water table and stream water makeup. |
| ● | Stream flows, climate data, soil and land use: information from these was used as input into the precipitation/run-off numerical model. |
Conceptual Groundwater Model
The following section describes the conceptual groundwater model in terms of hydrogeological units, groundwater recharge processes, groundwater flow pathways and groundwater discharge mechanisms.
The hydrogeological units were defined based on the results of hydraulic testing and water level monitoring, along with geological, structural and geotechnical information derived from drill core logging (exploration and geotechnical). RQD, rock strength, weathering and fracture intensity were the main parameters for the delimitation of the 10 hydrogeological units (Table 16.4).
Two broad domains, sedimentary and igneous-metamorphic, were first defined in relation to the regional
| Effective Date January 1, 2021 | Aris Gold | |||
| Page 213 of 384 |
| SRK Consulting | Soto Norte NI 43-101 – Feasibility Study |
geology context; thereafter, the igneous-metamorphic domain was discretised into smaller units to represent the variation in the degree of fracturing, which is stronger and more intense in proximity to the LBFZ and its associated structures. The higher permeability rocks are located within the mineral deposit due to the development of a dextral strike-slip fault system that generated secondary porosity through fracturing and shearing. The igneous-metamorphic rock that is distal to the influence of LBFZ is fresh, competent and massive with isolated low-density fracturing, hence its low permeability. The sedimentary domain was further discretised based on local and regional geological maps and drilling information in the area provided by Minesa, and 3D formation extents taken from the Minesa regional geological model.
The 3D conceptual model with annotated hydrogeological units can be seen Figure 16.15 and Figure 16.16.
Table 16.4: Soto Norte Project Hydrogeological Units (Source: Ingetec & Minesa, 2020)
| Hydrogeological Classification |
Hydrogeological Unit |
Lithostratigraphic Units and Geological Structures |
Description | |||
| A: Sediments or rocks with primary porosity and intergranular flow |
A.1: Regional-scale aquifer with medium productivity |
Alluvial deposits |
Alluvial deposits along La Baja Stream, Vetas and Suratá rivers. These are comprised of poorly sorted material ranging from silt and fine-grained sand to gravel and boulders. | |||
| B: Rocks with secondary porosity and flow through fractures or voids |
B.1: Local-scale discontinuous aquifer with very high productivity |
Intensely faulted and fractured gneiss |
Fractured and faulted gneiss and intrusive rocks in the mineral deposit area, surrounding the major veins. Argillic and phyllic alterations are ubiquitous. | |||
| B: Rocks with secondary porosity and flow through fractures or voids |
B.2: Regional-scale discontinuous aquifer with medium productivity |
Moderately fractured gneiss; Tambor Formation |
Transition zone in between the fractured gneiss from the deposit area and the competent gneiss in the upper land. Lower fracture intensity and hydrothermal alteration. | |||
| B: Rocks with secondary porosity and flow through fractures or voids |
B.3: Local-scale discontinuous aquifer with low productivity |
La Luna, Rosablanca, Simiti, and Tablazo Formations; Mascota and Gigante breccias |
Sedimentary rocks comprised of chert, shale, limestone, and siltstone. Mascota and Gigante breccias, faulted and with abundant clay and gouge from argillic alterations. | |||
| C: Sediments and rocks with limited groundwater resources |
C.1: Quaternary sediments and weakly consolidated rocks with low productivity |
Umir and Paja Formations; Colluvial deposits |
Sedimentary rocks with predominant claystone and shale and minor layers of limestone and siltstone. Localised colluvial deposits with silty-clayey matrix. | |||
| C: Sediments and rocks with limited groundwater resources |
C.2: Competent igneous-metamorphic and volcanic rocks with low productivity |
Regional Crystalline Basement; Silgara Formation |
Competent igneous-metamorphic rocks with low fracturing and almost non-existent hydrothermal alteration. Low permeability gneiss, granite, schists, amongst others. | |||
| Effective Date January 1, 2021 | Aris Gold | |||
| Page 214 of 384 |
| SRK Consulting | Soto Norte NI 43-101 – Feasibility Study |
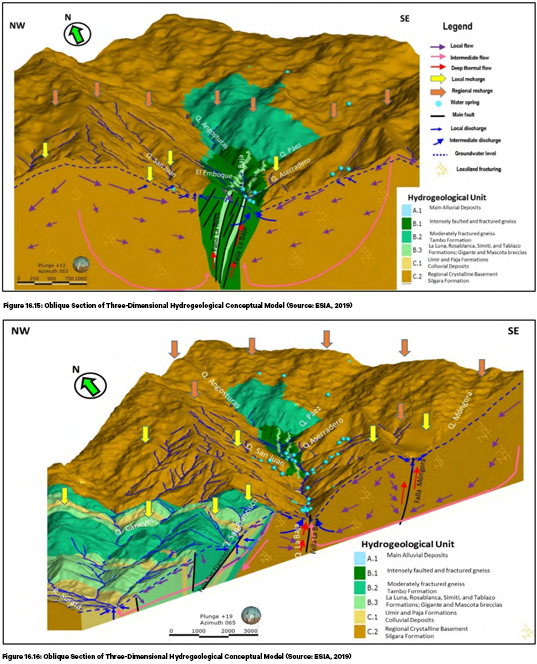
Groundwater recharge is typically broken down into 1) primary or direct recharge occurring because of direct infiltration of rainfall through the soil zone, and 2) secondary or indirect recharge occurring because of infiltration through stream beds and localised ponding. Primary or direct recharge is the dominant recharge mechanism at the Soto Norte Project. The major streams in the Project area are groundwater fed and are not, therefore, sources of recharge. Some secondary recharge may occur on the upland streams, which are situated above the water table, especially where they pass over fractured outcrops.
Groundwater flow is categorised into the following broad categories for the purposes of presenting flow pathways:
| ● | Local scale flows: typically shallow and present within the same catchments that groundwater recharge |
| Effective Date January 1, 2021 | Aris Gold | |||
| Page 215 of 384 |
| SRK Consulting | Soto Norte NI 43-101 – Feasibility Study |
| ● | occurs. Groundwater flow pathways are typically of the order of tens to hundreds of metres and do not exceed 2 km. These localised systems account for the majority of groundwater flow in the Project area. |
| ● | Intermediate scale flows: associated with deeper groundwater pathways and, in some instances, cut across catchment divides. Groundwater flow pathways are typically of the order of hundreds of meters to several kilometres and do not exceed 10 km. Intermediate scale flows are present throughout the Project in relatively low volumes due to permeability reduction with depth. |
| ● | Regional scale flows: characteristic of major regional scale aquifer systems where groundwater flow pathways can exceed several tens of kilometres in length. There are no groundwater flows of this nature in the Project area due to the inherently poor aquifer systems and steep mountainous terrain. |
| ● | Geothermal flows: several elevated temperature springs and boreholes with artesian conditions are evident in the Project area in proximity to La Baja Stream, in La Bodega and El Gigante locations. These are described as geothermal to differentiate them from shallow, low temperature springs. The geothermal flows are, in reality, a subcategory of the “Intermediate scale flows” that follow a deep flow path within the La Baja Fault Zone (Figure 16.15). |
Measured baseflow along La Baja Stream, as well as artesian conditions in boreholes and high temperature mineralised springs/seepages, indicate that the La Baja Stream is the main groundwater discharge zone in the area of the proposed mine workings.
Baseflow to springs and surface watercourses is the primary discharge mechanism (regional scale), with the Vetas and Suratá rivers forming the main discharge zones to the west of the Project area.
Several springs are reported at varied elevations along the La Baja Valley. Groundwater level data indicates that many of these springs represent interflow or localised perched water systems within the weathered zone of the slopes of the La Baja Valley. Artisanal mine workings and the Emboque tunnel are also points of discharge within the La Baja Valley.
Numerical Groundwater Model
The objectives of the Numerical Groundwater Model are dictated by the EIA Terms of Reference (“ToR”) outlined by the National Bureau of Environmental Licences (ANLA). In summary, the requirements consist of the following:
| ● | Produce a 3D numerical model representative of the conceptual model |
| ● | Correctly define the area of interest (model extent) |
| ● | Choose appropriate hydraulic borders |
| ● | Include as input data: historical water levels, hydraulic properties for each unit, flow directions, hydraulic connections |
| ● | Set appropriate discretisation of mesh at the areas of interest |
| ● | Establish an appropriate selection of model layers |
| ● | Report on the following phases: model construction, calibration, validation, and predictive runs |
| ● | Accompany the report of the calibration and validation stages with statistical indicators and model stability analyses |
| Effective Date January 1, 2021 | Aris Gold | |||
| Page 216 of 384 |
| SRK Consulting | Soto Norte NI 43-101 – Feasibility Study |
| ● | Simulate steady state groundwater levels, including how levels will vary throughout Project development by recording hydrogeological inflows into the underground workings |
| ● | Water quality prediction, dewatering systems and grouting designs. |
A brief summary of the construction of the Numerical Groundwater Model along with conclusions and key findings is provided below.
The following software packages were used in constructing the numeric models:
| ● | SWAcMOD: enables the detailed simulation of rainfall, evapotranspiration, surface water rapid-runoff, actual evapotranspiration, soil moisture deficit accounting, shallow sub-surface interflow, unsaturated zone recharge attenuation and macropore bypass mechanisms. Spatially distributed time variant groundwater recharge outputs from SWAcMOD feed directly into the MODFLOW-USG model. |
| ● | MODFLOW-USG (UnStructured Grid) Code: used to develop the groundwater numerical model. MODFLOW-USG is an open-source industry-standard numerical modelling code. It was chosen as it offered the most flexible and transparent options to best represent the conditions specific to the Soto Norte Project. |
The model grid consists of an irregular shaped domain (approximately 20 km long x 20 km wide x 1.5 km deep) that incorporates a considerable land area beyond the AoI. The model grid is shown in Figure 16.17 and consists of a hexagonal mesh with 17 layers. A 3D visualisation of the model mesh is shown in Figure 16.18 highlighting the topography of model layer 1 and layer 17 for the entire model domain. The higher mesh resolution in the vicinity of the Vetas and La Baja valleys is evident.
The geometry of the model grid was constructed considering:
| ● | Material variation with depth (soil saprolite, weathered rock and fresh rock) |
| ● | Correctly simulated underground workings (800 m below surface), high resolution within mine working levels |
| ● | Correctly simulated deep groundwater intermediate flows and regional recharge |
| ● | Higher density grid within the area of interest (underground mine and TBM tunnel access) |
| ● | Avoid boundary (limits) effecting the simulations and outputs. |
The main areas of interest within the model domain are characterised by a refinement of the model mesh. Mesh refinement near Padilla, El Cuatro, Emboque, La Bodega and Aserradero, as well as along the TBM tunnel access from Padilla, facilitates high resolution model calibration in these areas. The valley bottoms where there are surface water channels are also refined to effectively simulate surface water-groundwater interaction. Areas remote from the mine area have a coarser resolution to reduce model run times. Figure 16.17 presents the mesh resolution for the various features simulated in the model. The model mesh and extent comprise 36,095 nodes per layer for a total of 613,615 nodes in the complete model.
| Effective Date January 1, 2021 | Aris Gold | |||
| Page 217 of 384 |
| SRK Consulting | Soto Norte NI 43-101 – Feasibility Study |
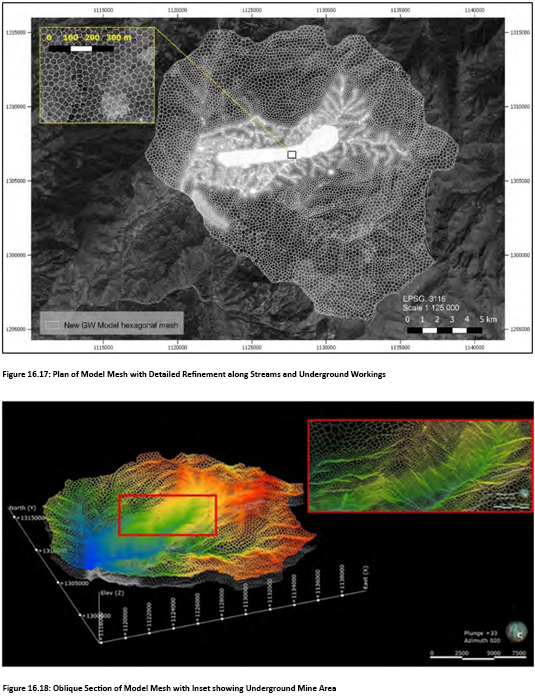
The numerical model was calibrated to both observed surface water flows and groundwater levels. A summary of calibration statistics is provided in Table 16.5, observation points are grouped by elevation. Figure 16.19 presents the plot of observed vs modelled heads. Three “HIDRO” holes located in the San Juan valley some 750 to 850 m northwest of the mine zone are highlighted on the figure as simulated heads are of the order of 150 to 200 m too high. This area of poorer calibration is attributed to compartmentalised fracture zones in the connection with base of the San Juan valley.
An example of the calibration to surface water flows is presented in Figure 16.20 which compares the combined flows from the MODFLOW and SWacMOD models to observed flows at the Puente Panega gauge.
| Effective Date January 1, 2021 | Aris Gold | |||
| Page 218 of 384 |
| SRK Consulting | Soto Norte NI 43-101 – Feasibility Study |
Table 16.5: Groundwater Calibration Results by Elevation
| Monitoring Type | Mean absolute error |
Standard deviation of error |
Root Mean Square (RMS) error |
Normalised RMS % | Number of calibration points | |||||
|
All calibration points |
23.12 | 37.72 | 38.03 | 1.98 | 114 | |||||
|
>3100 mRL |
14.72 | 18.30 | 18.80 | 3.15 | 27 | |||||
|
2800-3100 mRL |
36.03 | 58.55 | 60.87 | 17.69 | 29 | |||||
|
2500-2800 mRL |
20.85 | 30.19 | 29.96 | 11.86 | 47 | |||||
|
2000-2500 mRL |
21.81 | 7.46 | 22.85 | Too few points | 6 | |||||
|
<2000 mRL |
17.02 | 27.52 | 24.93 | Too few points | 5 |
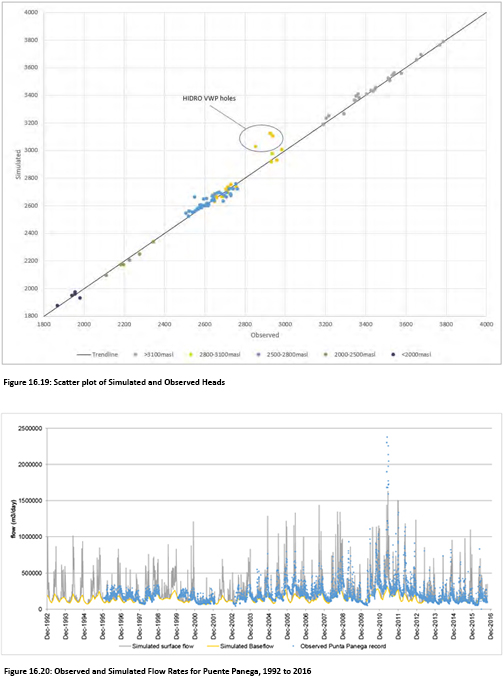
| Effective Date January 1, 2021 | Aris Gold | |||
| Page 219 of 384 |
| SRK Consulting | Soto Norte NI 43-101 – Feasibility Study |
Mine Dewatering
The Soto Norte underground dewatering strategy was designed with the following overall aims:
| ● | To minimise groundwater inflows to the underground mine and therefore maximise mining productivity, through cover drilling, pre-grouting and pre-dewatering of production areas |
| ● | To separate clean and dirty water streams and thereby minimise water settlement and treatment costs |
| ● | To minimise any potential drawdown impacts on the surrounding environment. |
The MODFLOW-USG (SNT107) model was used to determine groundwater inflows for the dewatering system design. The modelled groundwater inflow rates (Figure 16.21) were used as a basis for the sizing the pumping system.
In the mine area, where inflow risks are greater, the declines are to be cover drilled and if necessary pre-grouted to avoid uncontrolled inrushes. The TBM tunnel will be advanced without pre-grouting where operationally feasible to facilitate drainage and dewatering of the upper level stopes. The configuration of grouting used within the groundwater model, SNT107, reflects these objectives. Multiple sensitivity model simulations were used to assess grout plan effectiveness.
The numerical groundwater model outputs included a time series of flow rates in 3D space across the mine, for the entire life of mine. These inflows were segregated into four zones, namely El Cuatro, Emboque, La Bodega and TBM tunnel. Each of these four zones was again subdivided into blocks of 100 m depth. This approach was taken to summarise the inflow distribution with depth for each mining area.
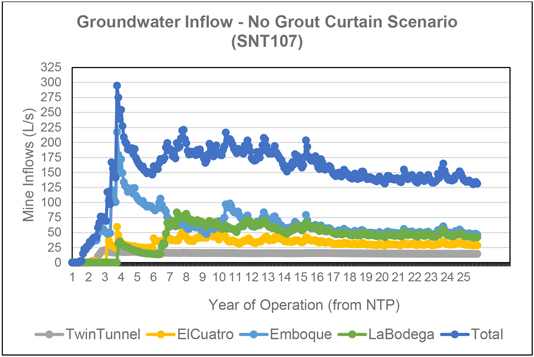
Figure 16.21: Annual Predicted Groundwater Inflow Rates
The design flows for pump and pipeline selection were determined by applying a Factor of Safety to the maximum expected inflows as calculated by the groundwater model. This safety factor considered flow from backfill material as well as service water. Due to the modular nature of the pumping stations (multiple pumps in parallel) and the use of relatively conservative safety factors, SRK does not consider it necessary to
| Effective Date January 1, 2021 | Aris Gold | |||
| Page 220 of 384 |
| SRK Consulting | Soto Norte NI 43-101 – Feasibility Study |
allocate additional stand-by capacity in the pumping station design.
Average quarterly inflows and maximum quarterly static heads have been used for the system design. For temporary systems, pipes will run along the backs of the declines while permanent pipelines run vertically in dedicated bores or ventilation drives. The final head for the pump selection considers head losses as a sum of friction losses and minor losses.
Table 16.6: Inflow Rate Assumptions Used in Dewatering Design
| Section ID
|
Flow (L/s) | |||
|
Temporary
|
Permanent | |||
|
Tunnel |
80 | - | ||
|
Temporary Upper El Cuatro |
20 | - | ||
|
Temporary Upper Emboque |
120 | - | ||
|
Upper Emboque Booster |
300 | 300 | ||
|
Upper Bodega |
120 | 120 | ||
|
Mid Emboque |
180 | 380 | ||
|
Temporary Mid Bodega |
120 | |||
|
Lower Emboque |
120 | 120 | ||
|
Upper Emboque |
120 | |||
|
Temporary Lower Bodega |
120 | |||
|
Mid Bodega |
120 | |||
“-“ no dewatering system installed
For the purposes of managing inflows, the underground mine has been divided into 13 sections that represent flow running from one station to another or to a portal. Some of the stations underground will be fitted with a permanent pump station once the location is developed. A temporary dewatering system has been designed for development of the declines until the permanent pump stations are installed. According to the mine schedule, the following timeline for permanent stations is expected:
| ● | Upper Emboque and Upper Emboque Booster permanent station locations are excavated by Month 3 of Year 4, with stations becoming operational 6 months later by Month 10 of Year 4 |
| ● | Upper Bodega station location is reached by Month 11 of Year 6 and operational by Month 4 of Year 7 |
| ● | The location for the main permanent pumping station at Mid Emboque will be excavated by Month 5 of Year 10 and the station is assumed to be operational by Month 10 of Year 10 |
| ● | The excavation of the permanent station at lower Emboque is completed by Month 7 of Year 13 and operational by Month 1 of Year 14 |
| ● | The connection between Mid Emboque and the Mid Bodega permanent station is realised by Month 5 of Year 12 and the Mid Bodega station becomes operational in Month 7 of Year 12. |
The proposed temporary and permanent dewatering systems are described below. The permanent system is summarised schematically in Figure 16.22.
| Effective Date January 1, 2021 | Aris Gold | |||
| Page 221 of 384 |
| SRK Consulting | Soto Norte NI 43-101 – Feasibility Study |
For the advance of the declines, Challenge WEARTUFF WTX3 pumps are used in series to overcome the high heads, fed by submersible 37 kW Flygt pumps. 110 mm OD PN16 High Density Poly Ethylene (“HDPE”) pipe is used for the majority of temporary dewatering systems along the declines.
The permanent dewatering system has been designed with the operation and maintenance objective to reduce the number of pump models to be used at the mine. Challenge WT106 and WT114 pumps are used for medium head pumping (~175 m) at stations 6 and 2 respectively. WT109 pumps are used for the only high head (~330 m) pumping station (4), which discharges from the tunnel to the Emboque Portal. 37 kW Flygt Bibos are used for low head (<60 m) pumping stations, including the booster station at station 4 which discharges along the tunnel to the Padilla portal. Station 4 can either discharge to the Emboque Portal via the WT109 pumps or along the tunnels to Padilla. The primary discharge will be to Padilla where the main water treatment infrastructure is located; the option of discharging to Emboque is, however, required to mitigate against any potential flow impacts in the La Baja Stream, if required.
A fleet of 35 x 8 kW Flygt 2125 face/sump pumps is included in the design. These pumps will be used to manage water at the face of advancing declines and the TBM tunnel access, and pump back to the WTX03 pumps or main pumping stations. It is also likely that they will be used to keep the 37 kW Flygt pumps away from the face as they are significantly lighter and easier to handle.
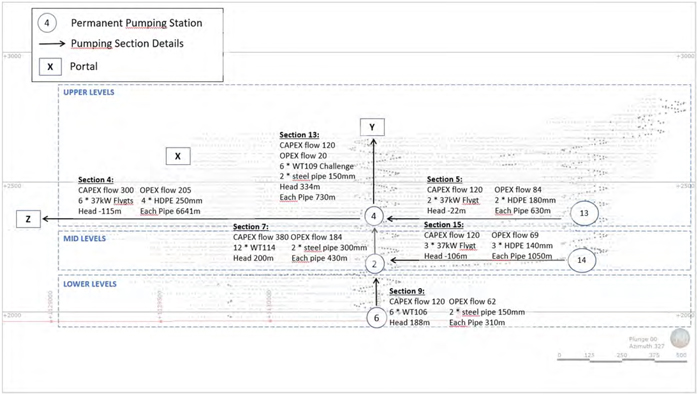
Figure 16.22: Long Section of Permanent Dewatering Design Infrastructure and Duty Flow Rate and Static Head, and Pump and Pipe Selections
Grouting Strategy
An assessment of ground investigation and ground treatment requirements was undertaken to manage the underground mine water aspects for the future mine development, operations and commitments as identified in the EIA. The objectives of the grouting programme can be broadly broken down into operational and environmental objectives as defined in Table 16.7. The preferred method for dealing with inflows varies by area and, in many cases, it will be necessary to implement more than one approach to meet the
| Effective Date January 1, 2021 | Aris Gold | |||
| Page 222 of 384 |
| SRK Consulting | Soto Norte NI 43-101 – Feasibility Study |
objectives. The range of options is shown schematically in Figure 16.23.
The intention is to ultimately dewater the underground area to facilitate mining, except for specific sensitive areas where grouting is required. Only the minimum amount of grouting to facilitate construction will be performed in all other areas and where possible controlled dewatering will be the primary means of facilitating the development. A strategy for implementing the dewatering and grouting plan has been developed in support of the current feasibility study and is summarised as follows:
| ● | The TBM tunnel will be advanced with systematic cover drilling undertaken from the TBM. Areas of high inflow risk (based on results of cover drilling) will be pre-grouted. Post-excavation grouting will be undertaken on minor inflows. |
| ● | Advance dewatering of the Emboque decline is planned using dewatering wells drilled from surface. The Project will also maintain the capacity to undertake systematic cover drilling and pre-grouting if the advance dewatering wells do not achieve their objectives. |
| ● | A grout-curtain is planned between the Emboque and La Bodega mining areas to minimise any potential groundwater drawdown to the east of the mine operation. Future versions of the mine plan will need to consider advancing the TBM tunnel to the eastern end of La Bodega to facilitate site investigation and testing from underground at the earliest available opportunity. This testing may indicate the grout curtain needs to be installed several years earlier than currently proposed. |
| ● | For the purposes of the FS design, it is assumed that mining areas beneath La Baja Stream will require pre-grouting to minimise any potential risks of inflows from surface water. Further hydrogeological characterisation of the surficial deposits beneath La Baja will be undertaken at the detailed design stage to determine if this is necessary. |
The complex hydrogeological setting of the Project results in a significant uncertainty over the precise location and magnitude of groundwater inflows, although primary or direct recharge of groundwater from the direct infiltration of rainfall through the soil zone has been established as the dominant recharge mechanism at the Project. It is therefore essential that the detailed design of the dewatering and grouting programme is supported by additional site investigation and hydrogeological characterisation. The current study is considered reasonable for the feasibility-level assessment of environmental impacts, mine dewatering, and overall groundwater management. The dewatering system and grouting programs have considered these inherent uncertainties and have been specifically designed to ensure the operation is able to manage the full range of groundwater inflows and implement any potential environmental mitigation measures in a timely manner.
Table 16.7: Objectives of Planned Grouting Operations
| Area
|
Operational Objective | Environmental Objective | ||
| TBM Grouting | To facilitate efficient advance of the TBM | Control inflows to minimise impacts on surface and groundwater | ||
| Decline Pre-Grouting (El Cuatro & Emboque) |
Seal inflows as necessary to allow efficient advance of decline | No environmental objective necessary. Area will be fully dewatered to facilitate mining. | ||
| Decline Pre-Grouting (La Bodega) |
Seal inflows as necessary to allow efficient advance of decline/incline | Seal to avoid any potential impacts in the area, in accordance with broader |
| Effective Date January 1, 2021 | Aris Gold | |||
| Page 223 of 384 |
| SRK Consulting | Soto Norte NI 43-101 – Feasibility Study |
| Area
|
Operational Objective | Environmental Objective | ||
| objectives of La Bodega Grout Curtain | ||||
| La Bodega Grout Curtain | No operational objective, grout curtain is driven purely by environmental requirement | To prevent any potential drawdown impacts propagating to the east and any potential impacts in the region. | ||
| La Baja River Curtain |
Reduce inflows from La Baja River in general and prevent uncontrolled inrushes when mining below the river. |
Reduce any potential impacts of flow reduction on the La Baja River. |
| Zone
Water Management Option |
TBM Grouting |
Decline Pre-Grouting (EI Cuatro & Emboque) |
Decline Pre-Grouting (La Bodega) |
La Bodega Grount Curtain |
La Baja River Curtain | |||||
| Pre-grouting prior to mine development | ||||||||||
| Pre-grouting from face during mine development | ||||||||||
| Post-grouting | ||||||||||
| Advance dewatering using vertical wells (drilled from surface or underground) | ||||||||||
| Dewatering using horizontal drains installed from underground | ||||||||||
| Grout-Curtains | ||||||||||
| Key | ||||||||||
| Preferred option | ||||||||||
| Backup option to be used in support of preferred option | ||||||||||
| Secondary option to be considered in detailed design | ||||||||||
| Contrary to overall objectives – avoid where possible | ||||||||||
| Not applicable | ||||||||||
Figure 16.23: Grouting and Dewatering Strategy by Zone
Figure 16.24 and Figure 16.25 provide respective plan and oblique views of the planned underground grouting plan based on the anticipated water inflow risk. Cover drilling is assigned at an average rate of 16.2 m per metre of decline development based on benchmark exercises from other operations. Pre-grouting tonnes are assigned where a decline segment is categorised as a fault intersection with an allowance for 5 m either side of the fault and areas associated with the La Bodega grout curtain. The grouting plan will evolve significantly through the detailed design phase of the Project, particularly with respect to the extent and scheduling of the La Bodega grout curtain.
| Effective Date January 1, 2021 | Aris Gold | |||
| Page 224 of 384 |
| SRK Consulting | Soto Norte NI 43-101 – Feasibility Study |
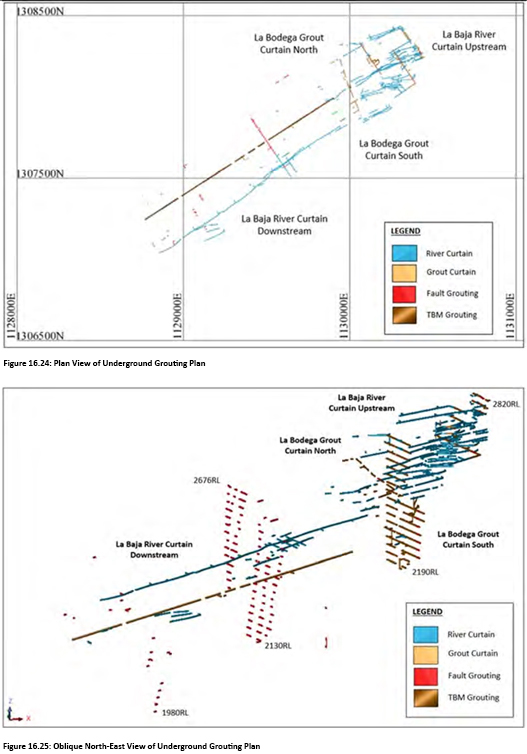
Construction of the La Bodega Grout Curtain and La Baja River Grout Curtain may be required to minimise any potential impact of underground mining at Soto Norte on the surface and ground water in the vicinity of the Soto Norte Project. This type of grouting involves managing and performing dozens of simultaneous operations, each of which requires a high degree of care. A high level of quality skills and depth of both theoretical and practical knowledge is required to successfully investigate, design and implement a grouting project of this nature.
The grout take (or absorption) required to construct the grout curtains will ultimately depend on the geology and method of construction. The main factors influencing grout absorption are:
| Effective Date January 1, 2021 | Aris Gold | |||
| Page 225 of 384 |
| SRK Consulting | Soto Norte NI 43-101 – Feasibility Study |
| ● | The rock condition, which includes the type of rock, degree of fracturing, width of fractures and infill. |
| ● | Grouting pressure applied. High pressure may result in damage to the rock mass due to uplift, hydraulic fracturing and wash out of material in fractures. If the grout pressure is too low, then inadequate grouting of the rock mass may result. |
| ● | Grouting materials applied. A thin grout with fine-grained cement will travel further than a thicker grout mix with coarse-grained cement. |
Where grout curtains are to be constructed from underground it is proposed to perform this operation using downhole water hammers (for example, Wassara drill system, LKAB). Most of these hammers can be utilised with relatively small underground exploration drills (such as the Diamec Smart 6).
Table 16.8 provides the respective order-of-magnitude estimates of the drilling and grouting requirements for the each of the grout curtains (La Bodega and La Baja River). These estimates are based upon benchmarking against comparable operations and an assessment of the site-specific conditions then used to estimate equipment and consumable requirements in the mine schedule.
Table 16.8: Curtain Drilling and Grouting Requirement Estimates
|
Curtain Drilling & Grouting
|
Units |
Grout Curtain | ||||
| La Bodega | River | |||||
| LH Drilling |
||||||
|
Hole Length |
m | level spacing | 50 | |||
|
Holes per Ring |
each | 1 | 2 | |||
|
Ring Spacing |
m | 3.0 | 3.0 | |||
|
Extension Hole Length |
m | 50 | 50 | |||
|
Extension Holes per Level |
each | 3 | 3 | |||
|
Curtain Drilling & Grouting |
||||||
|
Grout Consumption |
kg/m drilled | 15.5 | 15.5 | |||
|
% Drilling Grouted |
% | 100% | 100% | |||
Vertical Dewatering Wells
Dewatering wells are considered for the Emboque decline only. Dewatering wells at the La Bodega area are not considered, as the intention is to minimise drawdown in that area. Dewatering wells are not considered in El Cuatro either as early under-draining will be achieved by the TBM tunnel advance. The minimum target depth for de-watering wells or wells should be 300 m and substantially deeper wells may be considered if packer testing data indicates that permeable zones are present at depth.
| 16.5 | Mining Method |
| 16.5.1 | Introduction |
Modified Avoca mining follows essentially the same practices as conventional Avoca, with the exception that access to the level is only from one end. Once the void has been opened, the backfill must be placed by driving over the ore sill with a scoop or truck (ejector) and dumping into the open stope. As with conventional Avoca, the open span between the ore face and the muck pile can be varied according to ground conditions and dilution impact.
| Effective Date January 1, 2021 | Aris Gold | |||
| Page 226 of 384 |
| SRK Consulting | Soto Norte NI 43-101 – Feasibility Study |
Modified Avoca was selected as the primary mining method for production at Soto Norte Project after completing several trade-off studies for the following reasons:
| ● | The deposit is structurally conducive to this method |
| ● | Provides a means to manage the geotechnical constraints on open stope dimensions |
| ● | Production rate advantages due to stope turnover and multiple backfill fronts |
| ● | Reduced operating development costs |
| ● | Backfill plant and extensive pipe reticulation is not required, significantly reducing upfront investment. |
The main challenge with using the Modified Avoca method at Soto Norte is generating sufficient waste to use as a backfill material to stabilise the mined stopes and use as a working platform for subsequent lifts (that is, working on top of fill). The Modified Avoca method is applied in an Underhand (Bottom-up) mining sequence for individual stoping panels between sill pillars which are later recovered.
The planned quarry waste stopes for backfill waste are designed as open stopes, to be self-supporting with a standoff distance of 25 m between adjacent waste stopes. The initial slot will be drilled using a boxhole borer with longhole drilling and blasting. Longhole drilling will be undertaken with upholes and downholes from the upper and lower drill drives.
| 16.5.2 | Modified Avoca |
Figure 16.26 to Figure 16.33 provide schematic long views of the sequence of the modified Avoca method proposed for Soto Norte which is described as follows.
| 1. | The planned modified Avoca method commences with development to the strike extent of the individual veins followed by slot drilling and retreat of a lower production level with a stope height of 24.5 m (level spacing of 30 m) over a limited strike length of 15 m (Figure 16.26). |
| 2. | The 15 m stope span is backfilled with unconsolidated waste (from the upper second level) and the next production stope (15 m strike length) is mined with a separate slot, leaving a TRP in place to hold the backfilled waste and minimise mine dilution (Figure 16.28). Once the stope is mined, the TRP is mostly recovered using the Orica wireless initiation technology (“WebGen™”). Following recovery of the TRP, the stope void is backfilled. |
| 3. | Once the lower production level has retreated a minimum of three (15 m) stopes along strike, production on the second level can commence on top of the backfilled stopes (see Figure 16.30). Production on the lower level will always lead the production level above by at least three stopes to minimise the open stope span prior to backfilling with both levels, retreating back the respective footwall access drives. |
| 4. | When the second level has retreated a minimum of three (15 m) stopes along strike, production on the upper third level (or sill level) can commence on top of the backfilled stopes (Figure 16.32). Prior to production on the sill level, the overlying backfill waste is pressure grout stabilised. The sill level is retreat mined under the grout consolidated waste, leaving a 5 m stabilising rib pillar every 30 m along the sill (Figure 16.33). |
| 5. | Over time, the grout stabilised waste sill is anticipated (or induced) to fail, resulting in a shrinkage of the unconsolidated waste above into the mined sill void between rib pillars. The grout stabilised waste |
| Effective Date January 1, 2021 | Aris Gold | |||
| Page 227 of 384 |
| SRK Consulting | Soto Norte NI 43-101 – Feasibility Study |
| sill pillars will be routinely monitored using remote Cavity Monitoring Survey (“CMS”), or Drone surveys, and shrinkage voids will be filled with additional waste from the upper level footwall accesses as required to maintain stability (see Figure 16.34). |
All aspects of the mining method approach planned at Soto Norte have been successfully achieved during operations including:
| ● | Multi-level Avoca at the Barkers gold mine in Western Australia, retreating back to a central access with sill and rib pillars for additional support and stress management. |
| ● | Multi-level Avoca at the Pajingo gold mine in Queensland, Australia, retreating back to a central access and stress management techniques at depth (inclined mining front). The mine also targeted 100% extraction of the ore with sill pillar recovery using grout consolidation of the overlying waste. |
| ● | Use of TRP to manage backfill waste for the modified Avoca method at the Musselwhite gold mine in Ontario, Canada to reduce stope dilution and losses. The TRP are recovered using the Orica WebGen™ technology. |
| ● | Examples of working underground mines where pillars have been successfully extracted under grout consolidated waste including the Crusader gold mine (Australia), Cracow gold mine (Australia) and Chelopech copper-gold mine (Bulgaria). |
| ● | Examples of operations which utilise underground quarries are provided in Section 16.5.5. |
SRK notes that the mine production plan for Soto Norte is conservative by limiting all individual stopes to 15 m of strike length prior to filling. There is a real opportunity to increase the stope strike lengths significantly in zones of good ground conditions prior to filling which will provide better mining efficiency and productivity.
| Effective Date January 1, 2021 | Aris Gold | |||
| Page 228 of 384 |
| SRK Consulting | Soto Norte NI 43-101 – Feasibility Study |
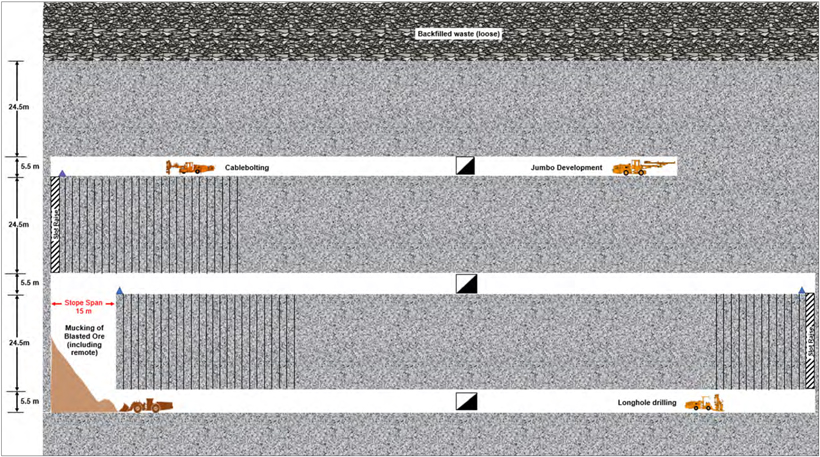
Figure 16.26: Long Section Example of Modified Avoca Initial Level Development and Stope Production
| Effective Date January 1, 2021 | Aris Gold | |||
| Page 229 of 384 |
| SRK Consulting | Soto Norte NI 43-101 – Feasibility Study |
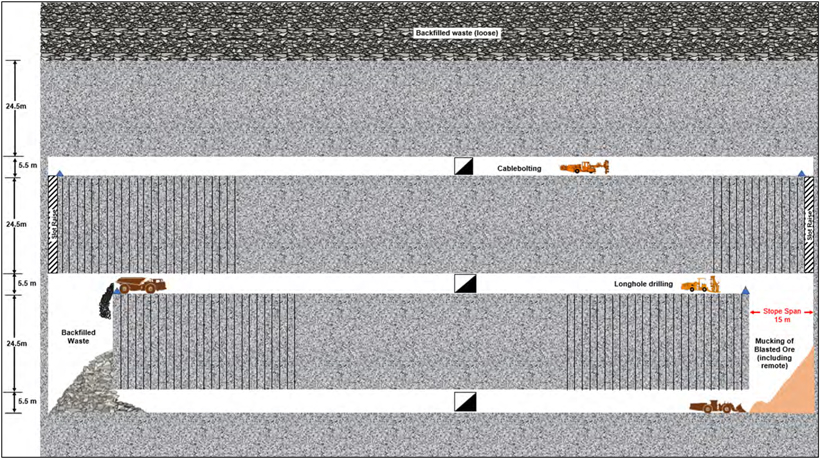
| Figure 16.27: | Long Section Example of Modified Avoca Stope Production Commenced on Lower Level and Waste Backfilling |
| Effective Date January 1, 2021 | Aris Gold | |||
| Page 230 of 384 |
| SRK Consulting | Soto Norte NI 43-101 – Feasibility Study |
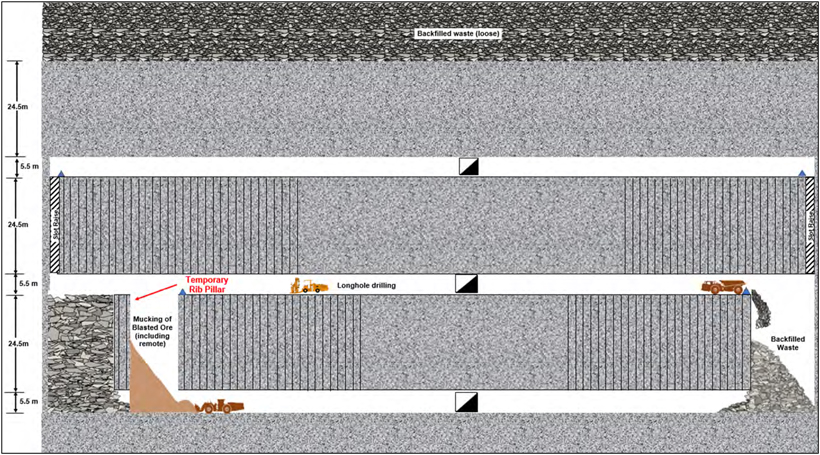
| Figure 16.28: | Long Section Example of Modified Avoca Temporary Rib Pillar to contain Waste Backfill and Continued Stope Production on Lower Level |
| Effective Date January 1, 2021 | Aris Gold | |||
| Page 231 of 384 |
| SRK Consulting | Soto Norte NI 43-101 – Feasibility Study |
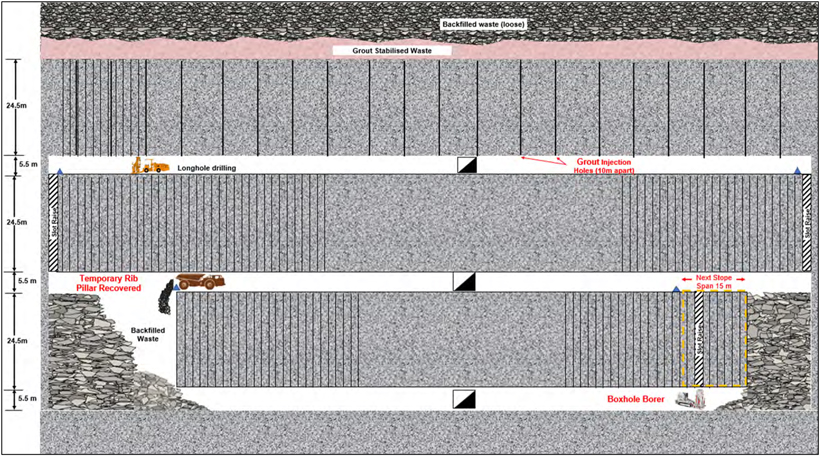
| Figure 16.29: | Long Section Example of Modified Avoca Upper Sill Level Grout Injection to Stabilise Backfilled Waste and Slot Raise Drilling on Lower Level |
| Effective Date January 1, 2021 | Aris Gold | |||
| Page 232 of 384 |
| SRK Consulting | Soto Norte NI 43-101 – Feasibility Study |
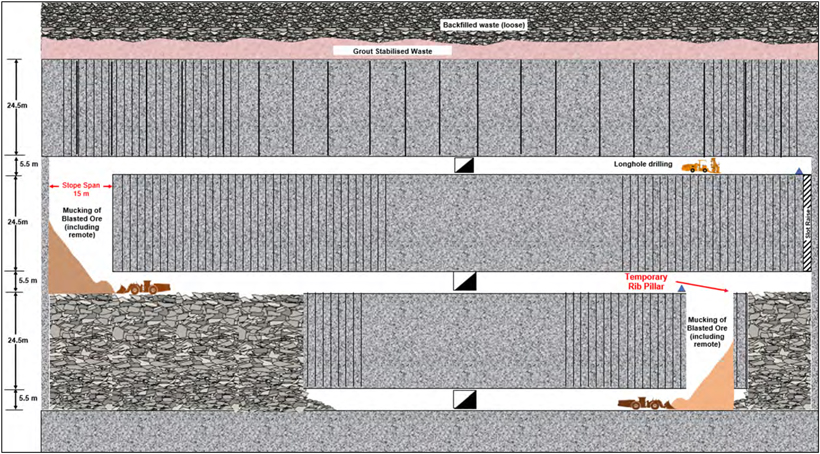
| Figure 16.30: | Long Section Example of Modified Avoca Stope Production Commenced on Second Level and Continued Production on Lower Level |
| Effective Date January 1, 2021 | Aris Gold | |||
| Page 233 of 384 |
| SRK Consulting | Soto Norte NI 43-101 – Feasibility Study |
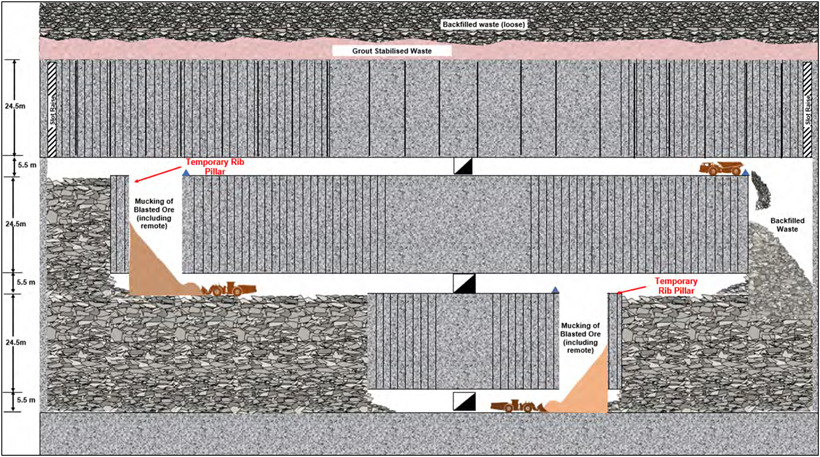
| Figure 16.31: | Long Section Example of Modified Avoca Production on Lower Level Nearing Completion and Continued Stope Production on Second Level |
| Effective Date January 1, 2021 | Aris Gold | |||
| Page 234 of 384 |
| SRK Consulting | Soto Norte NI 43-101 – Feasibility Study |
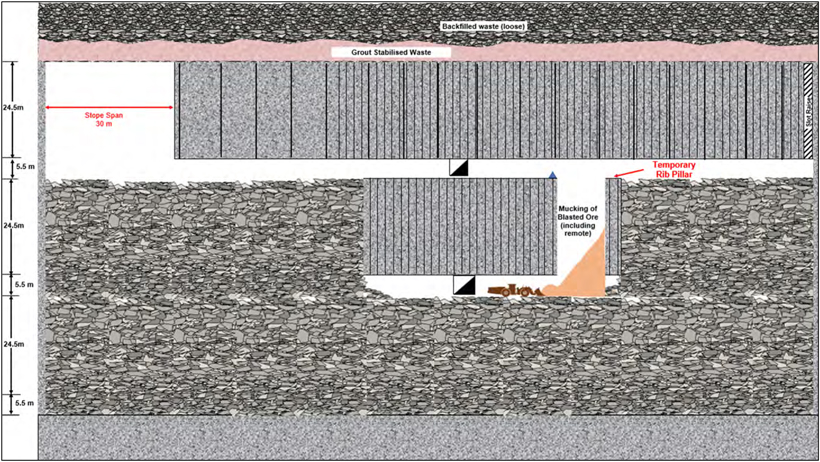
| Figure 16.32: | Long Section Example of Modified Avoca Stope Production Commenced on Upper Sill Level and Production on Second Level Nearing Completion |
| Effective Date January 1, 2021 | Aris Gold | |||
| Page 235 of 384 |
| SRK Consulting | Soto Norte NI 43-101 – Feasibility Study |
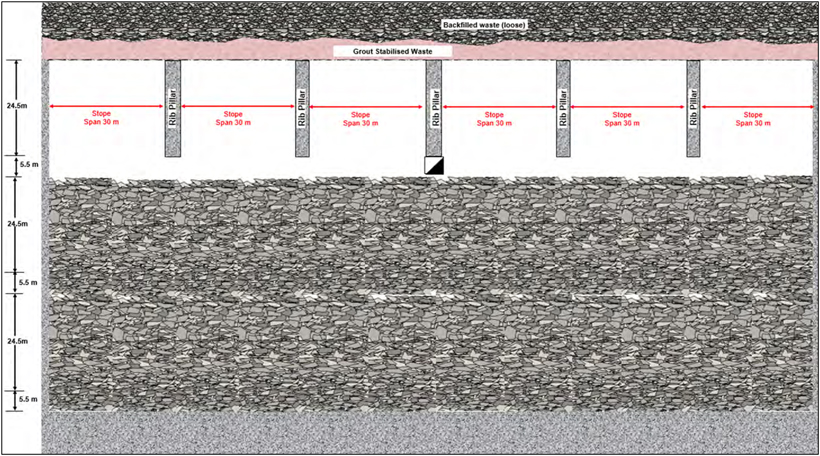
| Figure 16.33: | Long Section Example of Modified Avoca Stope Production Completed on All Levels with Grout Stabilised Waste and Rib Pillars |
| Effective Date January 1, 2021 | Aris Gold | |||
| Page 236 of 384 |
| SRK Consulting | Soto Norte NI 43-101 – Feasibility Study |
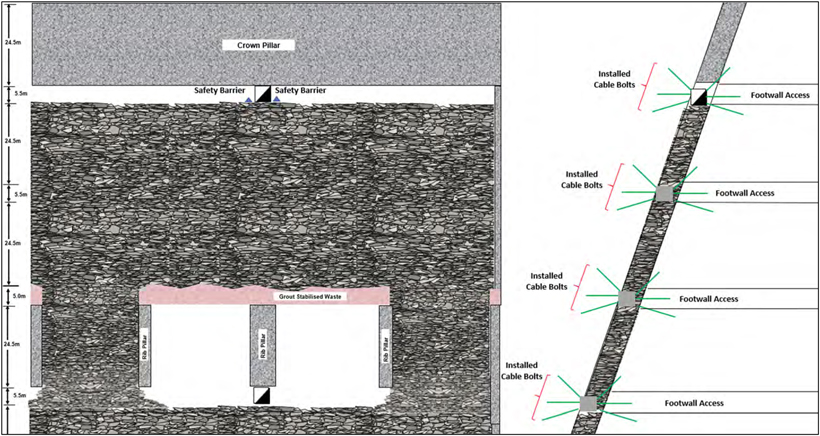
| Figure 16.34: | Long Section on Left, Cross Section on Right of Modified Avoca with Induced Failure of the Grout Stabilised Waste Sill Pillars Below the Crown Pillar Followed by Backfilling |
| Effective Date January 1, 2021 | Aris Gold | |||
| Page 237 of 384 |
| SRK Consulting | Soto Norte NI 43-101 – Feasibility Study |
| 16.5.3 | Mine Backfill |
The mine plan for Soto Norte requires several backfill approaches for the mining methods utilised including:
| ● | Modified Avoca: unconsolidated waste backfill for stabilising mined stope spans and used as a working platform. The waste overlaying sill pillars will be pressure injected with cement for recovering the pillars. |
| ● | For stope areas located in poor ground conditions (approximately 5% of the production tonnage), CRF (at 5% cement) has been applied. |
The 5% cement binder used for CRF in the FS is deemed appropriate when considering the previous backfill testwork. Separate testwork was completed by Paterson & Cooke (P&C, 2018a and 2018b) and Golder Associates (Golder, 2017) and is a typical cement content used by operating mines using CRF. Future testwork should be undertaken to optimise (and potentially reduce) the use of cement binder in the mine plan.
Table 16.9 provides the LoM backfill void volumes and tonnages for unconsolidated and cemented rockfill types. Table 16.10 shows the LoM tonnages of development and underground quarry waste which are sourced for backfill purposes.
Underground waste quarry stopes (Figure 16.4) have been designed as there is a shortage of waste required for the selected mining methods and it is the most efficient and cost-effective approach as well as reduces the surface footprint of the operation by eliminating the requirement for a surface quarry. The quarry stopes reduce the working capital requirement and as development is not required to be front-loaded in order to meet the production requirements and provides additional flexibility for production activities without the reliance of backfill waste from development activities or sourcing on surface and transporting underground. Once the individual waste stopes are completed there is an opportunity to store dry filtered tailings underground.
Table 16.9: LoM Backfill Requirements
| Type of Backfill | Units | Quantity | ||||||
| Unconsolidated Rockfill | Mt | 7.61 | ||||||
| M.m3 | 5.11 | |||||||
| Cemented Rockfill | Mt | 2.22 | ||||||
| M.m3 | 1.49 | |||||||
| kt cement | 111 |
Table 16.10: LoM Backfill Source
| Source of Backfill | Units | Quantity | ||||||
| Development Waste | Mt | 5.81 | ||||||
| M.m3 | 2.23 | |||||||
| Quarry Waste | Mt | 4.02 | ||||||
| M.m3 | 1.54 |
CRF uses a methodology similar to dry rock filling for disposing of waste into an open stope, except that a binder (cement) is added to the rock prior to deposition. The waste rock generated from mine development and designated underground waste quarry stopes is mixed with a cement slurry binder in a designated mixing area (stockpile). The CRF will be prepared (mixed) by a loader and delivered to the primary stopes
| Effective Date January 1, 2021 | Aris Gold | |||
| Page 238 of 384 |
| SRK Consulting | Soto Norte NI 43-101 – Feasibility Study |
as required. The resulting CRF mixture is then dumped into the open stope which rills at the angle of repose a shown in Figure 16.35 (Cordova M., et al, 2016) and the cementitious binder adheres to the rock particles and helps it to become a more stable mass. A small waste rock bund at the stope brow can be constructed by dumping waste rock to contain fill inside the stope and there is an additional opportunity to complete filling the stope void with unconsolidated rock waste.
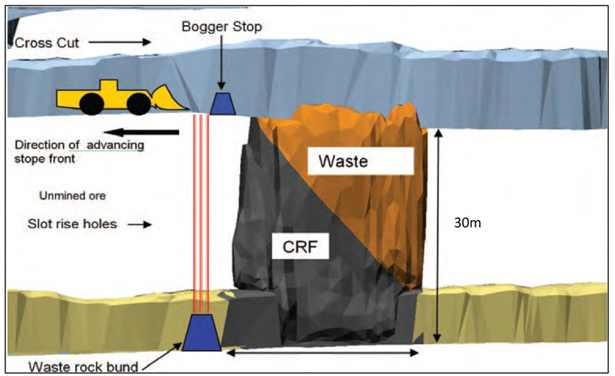
Figure 16.35: Long Section Example of CRF Placement in Poor Ground Conditions
| 16.5.4 | Mining Method Justification |
The application of multi-level Avoca mining, temporary rib pillars and recovery of sill pillars under grout stabilised rockfill has been successfully implemented on many occasions at underground mining operations and provides the opportunity to increase the recovery of the orebody at lower levels of dilution.
The stabilisation of rockfill is through the penetration of a binder material through the void space, which is typically in the range 20 to 30% by volume. In some cases, a low-viscosity cement binder was used, however, there are other cases where ordinary Portland cement has been used successfully also.
In order to successfully implement mining of pillars under grout stabilised fill at Soto Norte, laboratory testing and trial pillar extraction will need to be undertaken to refine the equipment, consumables and approach for mining under consolidated fill during the operational phase of the Project.
Stope blasting techniques will also need to be trialled to determine the effective standoff distance to minimise blast damage to the grout stabilised fill pillar.
| 16.5.5 | Backfill Material Source Justification |
The consideration of underground quarrying of backfill material as an alternative to sourcing waste from surface quarries is not a new concept. Trade-off studies were undertaken at various study levels for Soto Norte which determined that an underground quarry was the preferred approach (see Section 16.7.5) from a material handling and cost perspective given the location (and terrain) in the vicinity of the Project.
| Effective Date January 1, 2021 | Aris Gold | |||
| Page 239 of 384 |
| SRK Consulting | Soto Norte NI 43-101 – Feasibility Study |
Whilst underground quarrying is not a traditional source for waste backfill material in hard-rock metal mines, it is used extensively for the extraction of industrial minerals and aggregate, for example:
| ● | Lhoist North America: production of industrial minerals and aggregate in the USA from the Crab Orchard, Anderson and Ripplemead mines |
| ● | United States Lime & Minerals Inc.: production of limestone and dolomite in the USA from the St. Clair mine |
| ● | Mississippi Lime Company: production of limestone and dolomite in the USA from the Ste. Genevieve mine |
| ● | Linwood Mining & Minerals Corp.: production of limestone and dolomite in the USA from the Davenport mine |
| ● | Carmeuse Lime & Stone Inc.: production of limestone and dolomite in the USA from the Butler, Maysville and Luttrell mines |
| ● | Rogers Group Inc.: production of limestone in the USA from the White’s Creek mine. |
The approach of sourcing backfill waste from an underground quarry, for the planned mining method, has been determined through consideration of the topographical challenges and distance required to transport the material. Minesa has considered the alternatives and determined that underground quarrying has minimal impact on the surface (and Environmental footprint), the lowest backfill cost, and lowest risk of delays to production from sourcing waste backfill.
| 16.6 | Mine Production |
The mine design and schedule for Soto Norte requires significant upfront development to provide sufficient working areas to achieve a sustainable production rate of 2.6 Mtpa. When the minimum development is in place, then the required production activities can progress to enable an optimal ramp-up to full production. The number of active stopes required to sustain the production rate of 2.6 Mtpa ranges between 8 to 19 per month depending on the contribution of development ore and the variable width of individual stopes.
The average stope cycle duration for each stope type (not accounting for schedule dependencies) is shown in Figure 16.36, split into non-critical and critical path activities (note that the stope cycle durations are sourced from the schedule results of the mine plan). In addition to this, the mine plan accounts for dependencies between stopes as follows:
| ● | Activities are rigidly linked to prevent multiple primary activities that require a common sill from occurring at the same time. For example, all production drilling is assumed to be downhole so drilling of a stope must wait for the completion of the mucking of a stope on the level above and filling of the prior stope on the same level. Each of these activities would require equipment to drive over the open drill collars or would be impossible if the drill rig were working. |
| ● | Activities are linked between levels in the same mining panel to ensure a three stope lead before a stope on the level above can be mined. |
| ● | No production drilling can start on a stope until cablebolting of stopes using the top sill is complete. |
| ● | Slot raises are dependent upon completion of production drilling to limit risk of production drills working near open raises. |
| Effective Date January 1, 2021 | Aris Gold | |||
| Page 240 of 384 |
| SRK Consulting | Soto Norte NI 43-101 – Feasibility Study |
| ● | Additional constraints (such as production stope panel to production stope panel links) are considered where multiple mining panels share a common access. |
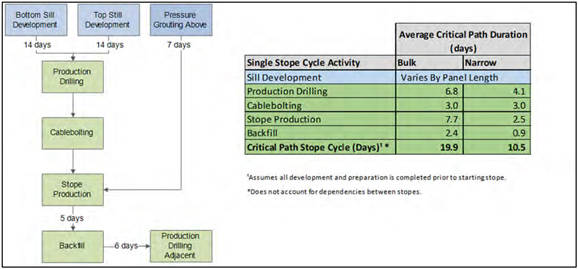
Figure 16.36: Average Stope Cycle Durations
The mining method approach for all stope types (longitudinal narrow, longitudinal wide and quarry stopes) is described in Section 16.5 with the suggested production drilling as follows:
| ● | Narrow vein stopes (2.5 to 5 m width): 76 mm up and/or down drilling and blasting using a dice 5 pattern: 1.8 m burden and 2.3 m spacing. |
| ● | Wide stopes (>5 m width): 89 mm up and/or down hole fan drilling and blasting with full rings depending on width: 2.1 m burden and 2.7 m spacing. |
| ● | Quarry Stopes: 102 mm up and/or down hole fan drilling and blasting with full rings depending on width: 2.7 m burden and 3.1 m spacing. |
Figure 16.37 shows the typical stoping retreat directions for individual stopes, using level 2430 mRL as an example. The location of individual veins determines the access and materials handling route which is dependent on proximity to the main accesses in each of the mining zones.
| Effective Date January 1, 2021 | Aris Gold | |||
| Page 241 of 384 |
| SRK Consulting | Soto Norte NI 43-101 – Feasibility Study |
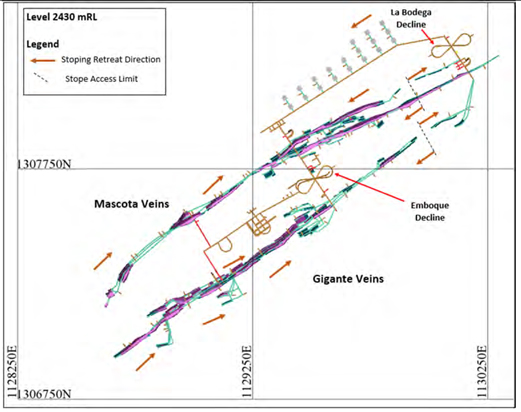
Figure 16.37: Plan of Stoping Direction in All Zones of Level 2,430 mRL
| 16.7 | Stope Design Approach |
| 16.7.1 | Introduction |
The stope optimisation process included an assessment of the NSR followed by use of the Deswik software Stope Optimiser module (“Deswik.SO”) to generate mineable shapes and quantify the diluted tonnes and grade available as the basis for the mine schedule.
| 16.7.2 | Stope Optimisation |
The Stope Optimisation (“SO”) work was undertaken in Deswik.SO software. Due to the block model size, the model was split into 11 separate frameworks (unique 3D volumes) to improve the stope optimiser processing time. Key settings were as follows:
| ● | USD100 NSR runs were completed using the 11 frameworks. The USD100 NSR value was chosen to maximise the number of stopes. |
| ● | Optimisation field set to DIL_NSR. |
| ● | Exclusion 1 is used to prevent shapes from being created if they intersect any blocks previously flagged with EXCLUDE =1, such as blocks outside the lease boundaries. |
| ● | Dip and strike were informed by simplified versions of the mineralisation wireframes. |
| ● | Dilution applied in schedule as a percentage, not with SO as fixed wall offsets. |
| ● | The block model NSR values were diluted by the estimated percentage of dilution based on the geotechnical numerical model. The diluted NSR was then used for optimisation. This process was |
| Effective Date January 1, 2021 | Aris Gold | |||
| Page 242 of 384 |
| SRK Consulting | Soto Norte NI 43-101 – Feasibility Study |
| completed to ensure all stopes generated were greater than USD100 NSR, once dilution was applied in the schedule. |
| ● | Using fixed wall offsets would require SO to be run again to change stope dilution. |
| ● | Minimum stope width set at 2.5 m. |
| ● | Minimum waste pillar width set to 7 m. |
| ● | Maximum strike length set to 15 m. |
| ● | Maximum allowable waste set to 100% to allow high grade lenses to generate stopes even if there is substantial dilution. |
| 16.7.3 | Stope Shape Screening |
The resultant shapes from the SO outputs were reviewed and screened. This process removed stopes if they fell into the following categories:
| 1. | SO shapes below the NSR cut-off value of USD120. |
| 2. | SO shapes that were generated in proximity to infrastructure. |
| 3. | SO shapes that were isolated (single stopes generated, that would require significant development for minimal or negative return on investment). |
| 4. | SO shapes that were considered un-minable (including stopes that were generated within the 30 m crown pillar from surface topography, determined from earlier studies). |
| 16.7.4 | Longhole Production |
Due to the variability of narrow and bulk stopes along strike a common access drive profile of 5.0 mW x 5.5 mH is required with enough space for the range of equipment types required for the narrow and wide stope mining (mainly driven by 65 t truck for backfilling and ventilation duct). The drive profile reduces the maximum vertical drill height to 24.5 m for all stoping areas.
Slot raises are initially drilled using a boxhole borer followed by rings of blast holes which can be either up or down holes (depending on access) which are progressively fired into the slot and stope void.
The blasted stope RoM can be removed on the lower level by conventional loader (limited to the stope brow) or tele-remote methods when the stope is open past the brow. Once the individual stopes have been fully excavated, a bund is installed at the stope access and the stope void is filled with unconsolidated waste or cemented rock fill (for areas of poor ground) depending on the location, mining method and sequence of mining.
Figure 16.38 provides a section view of a typical drill ring approach for longitudinal wide stopes at Soto Norte. In practice the open stope span along strike, prior to filling, will be routinely monitored for geotechnical stability to determine if there are opportunities to increase the stope length and delay backfilling. Routine stope reconciliation will also be required to monitor performance through CMS to understand the effectiveness of ground support and backfill on mine dilution and recovery. Key performance indicators from individual stopes will provide opportunities for continuous improvement (for example, under drilling the stope boundaries to reduce overbreak) in subsequent short-term planning.
| Effective Date January 1, 2021 | Aris Gold | |||
| Page 243 of 384 |
| SRK Consulting | Soto Norte NI 43-101 – Feasibility Study |
For narrow vein stopes (2.5 to 5 m width) the 24.5 m stope height will be achieved in one pass of uphole drilling using 76 mm diameter drill holes. The drill pattern will be undertaken as a dice-five or staggered pattern to reduce mine dilution and manage stope stability.
Figure 16.39 provides a typical section and plan view of drill ring layout for longitudinal narrow stopes at Soto Norte. If required, a ‘dice-five’ drill pattern can be applied, where an easier longhole is drilled between rings (dashed line) to reduce the burden (and blast vibration) for narrow vein stopes.
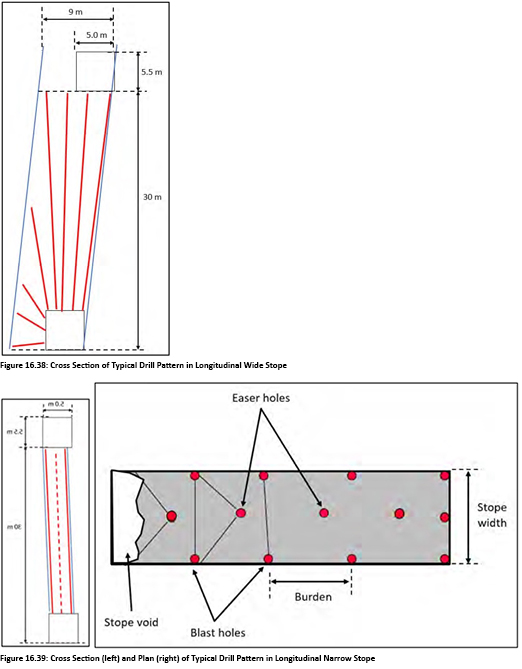
| 16.7.5 | Quarry Waste Stopes |
| Effective Date January 1, 2021 | Aris Gold | |||
| Page 244 of 384 |
| SRK Consulting | Soto Norte NI 43-101 – Feasibility Study |
The mine plan requires underground waste (quarry) stopes to supplement the development waste generated to use with the planned mining method(s). The planned waste stopes are located away from planned stoping areas and are designed according to the geotechnical stability guidelines. The waste stope dimensions are designed to be self-supporting at 20 mW x 20 mL x 90 mH with a standoff distance of 25 m between adjacent waste stopes (Figure 16.40). The initial slot will be drilled using a boxhole borer and with 102 mm diameter longhole drilling and blasting (Figure 16.41). Longhole drilling will be undertaken with upholes and downholes from the upper and lower drill drives. Blasted waste material is loaded and hauled from the lower drive where it is transported to mined out stopes as a source of backfill.
The waste stopes will be mined as required and later in the mine life there is potential opportunity to store a portion of the dry filtered tailings in the completed underground waste stopes.
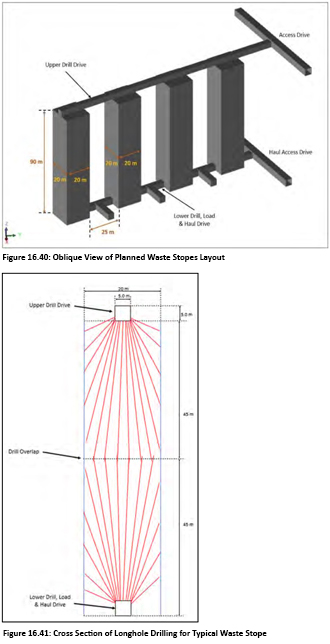
| Effective Date January 1, 2021 | Aris Gold | |||
| Page 245 of 384 |
| SRK Consulting | Soto Norte NI 43-101 – Feasibility Study |
| 16.8 | Materials Handling and Mine Equipment |
| 16.8.1 | Introduction |
The materials handling approach for Soto Norte considers three distinct phases based on the underground development completed in the mine schedule:
| ● | Phase 1: Pre-Production (prior to TBM tunnel breakthrough): |
| ○ | Separate material movement (waste+ore) by truck at El Cuatro and Emboque sites and storage on surface at Padilla. Trucked by contractor through California at 28 ktpm. |
| ○ | Single TBM tunnel developed from Padilla where waste material is transported and stored. |
| ○ | TBM tunnel not connected from Padilla to mine. |
| ● | Phase 2: Production with temporary underground crushers (2340 mRL): |
| ○ | TBM tunnel has connected with the Emboque decline and mobile crushers positioned on the 2340 mRL. |
| ○ | The mobile crushers are positioned to transfer material (ore+waste) to the permanent installed TBM conveyor. Material is campaign conveyed to Padilla for ore processing and waste storage. |
| ● | Phase 3: Production with permanent crushers operational (2340 mRL): |
| ○ | Mobile crushers are installed in permanent positions on the 2340 mRL. All material feeds down to this level via separate ore and waste passes (loader/truck fed). |
| ○ | Material (ore+waste) is campaign conveyed from the crushers to Padilla for ore processing and waste storage. |
| 16.8.2 | Mine Equipment |
The primary equipment selected for mine development and production activities is as follows:
| ● | Mine Development: |
| ○ | Tunnel Boring Machine (one TBM for the tunnel access from Padilla) |
| ○ | Twin Boom Jumbo based on the Atlas Copco MC2 |
| ○ | Cover drilling Jumbo based on the Atlas Copco EC2. |
| ● | Underground Loaders: |
| ○ | Based on a standard 18 t capacity loader (Atlas Copco ST18) for development, production and backfill activities. |
| ● | Truck Haulage: |
| ○ | 65 t capacity (Atlas Copco MT65) for materials handling on main haulage levels and with ejector truck models used for transporting backfill waste to production areas. |
| ● | Ground Support: |
| ○ | TBM has on-board bolting capacity |
| ○ | Bolting of all jumbo headings using an Atlas Copco M2D |
| Effective Date January 1, 2021 | Aris Gold | |||
| Page 246 of 384 |
| SRK Consulting | Soto Norte NI 43-101 – Feasibility Study |
| ○ | Shotcrete activities to be undertaken by a Normet Spraymec 5100VC and Utimec LF600 Agitator truck. |
| ● | Production Drilling: |
| ○ | Bulk stopes to drill 89 mm diameter using a Simba E7C. A similar approach will be used for Quarry waste stopes drilling 102 mm diameter holes |
| ○ | Narrow Stopes to drill 76 mm diameter using a Simba E7C. A similar approach will be used for Alimak stopes with the drill mounted on a raise platform (e.g. Horidiam). |
| ● | Charge up wagon: |
| ○ | Emulsion charge-up using a Charmec LC605DV for both development and production activities. |
For specialised drilling (for example, service boreholes) and raise bore development, contractor services will be utilised. The mine will have separate compressed air driven Alimak units primarily for developing the pass system, escapeway, and some ventilation raises.
Table 16.11 provides the main list of primary and secondary support equipment considered in the mine plan and unit productivities used to determine equipment requirements over the LoM.
In addition, Table 16.12 provides the equipment operating factors used to estimate operating costs and determine replacement capital throughout the LoM. Table 16.13 provides the operating factors for the other major capital items to be considered in the mine including:
| ● | Mobile crushing systems (temporary and permanent) and support equipment |
| ● | Materials handling support equipment |
| ● | Pumping equipment for main station, booster station and sump pumps |
| ● | Primary and secondary ventilation fans |
| ● | Diesel generator to be considered for initial power requirements at Padilla. |
| Effective Date January 1, 2021 | Aris Gold | |||
| Page 247 of 384 |
| SRK Consulting | Soto Norte NI 43-101– Feasibility Study |
Table 16.11: Mine Equipment and Productivity Assumptions
| Fleet | Unit | Produetivity | ||||||||||||||||||
| per annum | per month | per day | per hour | Notes | ||||||||||||||||
| Truck - 60t Copacity (MT65) |
Based on TKM Model In searate spread sheet | |||||||||||||||||||
| Development loader· 18t (ST18) |
t/hr | 345.762 | 28.813 | 953 | 88 | Based on loader tonnes per hour | ||||||||||||||
| Production Loader · 18t (ST18) |
t/hr | 495.425 | 41,285 | 1,365 | 95 | Based on loader tonnes per hour | ||||||||||||||
| Rodcfillloader- 18t (ST18) |
t/hr | 514,714 | 42.893 | 1,418 | 131 | Based on loader tonnes per hour | ||||||||||||||
| TBM |
dev m adv | 5,201 | 428 | 14.3 | 0.6 | Based on m advance per dey (Robbins and Paper) | ||||||||||||||
| Cover Drilling Jumbo - E2C |
dev m cover | 902 | 74 | 2.5 | 0.1 | Based on Cover drill metres per year | ||||||||||||||
| Twin Boom Jumbo - M2C |
dev m adv | 6,276 | 523 | 17.4 | 0.7 | Based on Twin Boom Jumbo drill metres per year | ||||||||||||||
| Bolting Jumbo - M2D |
dev m adv | 4,184 | 349 | 11 | 0.5 | 1.5 x bolter for every 1 x Twin Boom Jumbo | ||||||||||||||
| longhole Drill - Sulk (Simba E7C) |
drill m | 90,024 | 7,502 | 247 | 10 | Based on LH drill metres per year | ||||||||||||||
| Longhole Drill - Narrow (Simba E7C) |
drill m | 72.963 | 6,080 | 200 | 8 | Besed on LH drill metres per year | ||||||||||||||
| Longhole Drill - Sludge Drilling |
drlll m | 54,813 | 4,568 | 150 | 6 | Based on LH drill metres per year | ||||||||||||||
| Chargeup wagon (CHARMEC lC 605 DV) DEV |
dev m adv | 7,980 | 665 | 22 | 1 | Based on Development Rate | ||||||||||||||
| Chorgeup wagon (CHARMEC LC 605 DV) PRO |
Mtpa | 1.983,815 | 165.318 | 5,435 | 226 | Based on Produc:tion Rate | ||||||||||||||
| Shotcrete machine (SPRAYMEC 5100 VC) |
spray m3 | 11,912 | 993 | 33 | 1.4 | Based on shotctete estimates | ||||||||||||||
| Cement Carrier (UTlMEC lF 600 AGITATOR) |
spray m3 | 5,956 | 496 | 16 | 0.7 | Sased on 2x Cement Carrier per 1 x Spraymec | ||||||||||||||
| Cablebolter - Cabletec M |
cable m | 55,800 | 4,650 | 155 | 6.5 | Based on cable bolting estlmates | ||||||||||||||
| ITH Rig -Diamec Smart 6 |
drill m | 72,963 | 6.080 | 200 | 8 | Based on Curtain drill metres per year | ||||||||||||||
| Raisebore (Robbins 123RH) |
raise m | 1,095 | 91 | 3 | 0.1 | Based on designated Raise Bore Raises and Redpath advance rates | ||||||||||||||
| Alimak Raise Climber |
raise m | 548 | 46 | 2 | 0.1 | Based on designated Alimak Raises and DMC advance rates | ||||||||||||||
| Mobile Compressor (275 HP) |
1 x Mobile Compressor for every Alimak | |||||||||||||||||||
| Secondary Breakage Drill (SB9) |
Mtpa | 2,000,000 | 166.667 | 5,479 | 228 | Production rate based; 1 x Drill minimum at all times | ||||||||||||||
| Road Roller/Compactor (CAT CS533E) |
Mtp a | 1,500.000 | 125,000 | 4,110 | 171 | Productlon rate based; 1 x Road Roller at all times | ||||||||||||||
| Cleanup Bobcat (CAT 226B) |
Mtpa | 4,000,000 | 333,333 | 10,959 | 457 | Procduction rate based; 1 x Bobcat at all times for conveyor spillage | ||||||||||||||
| Grade Control/Probe Drill (Diamec Smart 8) |
drill m | 15,0OO | 1.250 | 41 | 1.7 | Based on grade control metres (ptoduction rate- based) | ||||||||||||||
| Grader (CAT 12K) |
Mtpa | 1,500,000 | 125,000 | 4,110 | 171 | Production rate based; 1 x Grader at all time | ||||||||||||||
| Service (Fuel) Truck (UTIMEC MF 350) |
1 x Service Truck for every 7 Drills | |||||||||||||||||||
| Lube truck (UTIMEC MF 350) |
1 x Lube Truck for every 7 Drills | |||||||||||||||||||
| Scissor lift (UTILIFT MF 540) |
Mtpa | 2,000,000 | 166,667 | 5,479 | 228 | Production rate based; 1 x Scissor Lift at all times | ||||||||||||||
| Crane truck (UTIMEC MF100 MATERIAL) |
Mtpa | 2,000,000 | 166,667 | 5,479 | 228 | Production rate based; 1 x Crane at all times | ||||||||||||||
| Integrated Toolcarrier (CAT 930K) |
Mtpa | 750,000 | 62,500 | 2,055 | 86 | Production rate based; 1 x Integrated Toolcarrier at all times | ||||||||||||||
| Light Vehicle |
Based on staff, shifts and underground crews | |||||||||||||||||||
| Personnel carrier (UTIMEC MF 328 -32 person) |
Based on shifts and underground crews | |||||||||||||||||||
| Box Hole Borer |
drill m | 91,476 | 250 | 251 | 10 | Based on m advance per day | ||||||||||||||
Table 16.12: Mine Equipment Operating Factors
| Fleet |
Availability (%) |
Use of Availability (%) |
Operator Efficiency (%) |
Effective Utllttion (%) |
Direct Operotlnc Hours (DOH) | Equipment | ||||||||||
| per month | per shift | (months) | (hours) | |||||||||||||
| Truck - 60t capacity (MT65) |
85% | 53% | 100% | 45% | 327 | 5.4 | 96.0 | 31,398 | ||||||||
| Developmen Loader - 18t (ST18) |
82% | 55% | 100% | 45% | 327 | 5.4 | 96.0 | 31,433 | ||||||||
| Production loader 18t (STI8) |
82% | 73% | 100% | 60% | 435 | 7.2 | 96.0 | 41,720 | ||||||||
| Rockfill Loader- 18t (ST18) |
82% | 55% | 100% | 45% | 327 | 5.4 | 96.0 | 31,433 | ||||||||
| TBM |
85% | 53% | 100% | 45% | 327 | 5.4 | 1.80.0 | 58,911 | ||||||||
| Cover Drilling Jumbo - E2C |
80% | 50% | 100% | 40% | 290 | 4.8 | 96.0 | 27,878 | ||||||||
| Twin Boom Jumbo - E2C |
83% | 65% | 100% | 54% | 392 | 6.5 | 96.0 | 37,601 | ||||||||
| Bolting Jumbo - M2D |
83% | 65% | 100% | 54% | 392 | 6.5 | 96.0 | 37,601 | ||||||||
| Longho!e Drill - Bulk (Simba E7C) |
85% | 49% | 100% | 42% | 302 | 5.0 | 96.0 | 29,028 | ||||||||
| longhole Drill - Narrow (Simba E7C) |
85% | 49% | 100% | 42% | 302 | 5.0 | 96.0 | 29,028 | ||||||||
| Longhole Drill - Sludge Drilling |
85% | 49% | 100% | 42% | 302 | 5.0 | 96.0 | 29,028 | ||||||||
| Chargeup wagon (CHARMEC LC 605 DV) DEV |
83% | 50% | 100% | 42% | 301 | 5.0 | 96.0 | 28,924 | ||||||||
| Chargeup wagon (CHARMEC LC 605 DV) PRO |
83% | 50% | 100% | 42% | 301 | 5.0 | 96.0 | 28,924 | ||||||||
| Shotcrete machine (SPRAYMEC 5100 VC) |
80% | 50% | 100% | 40% | 290 | 4.8 | 96.0 | 27,878. | ||||||||
| Cement Carrier (UTIMEC LF 600 AGITATOR) |
80% | 50% | 100% | 40% | 290 | 4.8 | 96.0 | 27,878 | ||||||||
| Cablebolter - Cabletec M |
82% | 55% | 100% | 45% | 327 | 5.4 | 96.0 | 31.4.33 | ||||||||
| ITH Rig - Diamec Smart 6 |
85% | 49% | 100% | 42% | 302 | 5.0 | 120.0 | 36,285 | ||||||||
| Raisebore (Robbins 123RH) |
80% | 5O% | 100% | 40% | 290 | 4.8 | 120.0 | 34,848 | ||||||||
| Alimak Raise Climber |
80% | 50% | 100% | 40% | 290 | 4.8 | 120.0 | 34,848 | ||||||||
| Mobile Compressor (275 HP) |
80% | 30% | 100% | 24% | 174 | 2.9 | 96.0 | 16,727 | ||||||||
| Secondary Breakage Drill (S89) |
80% | 30% | 100% | 24% | 174 | 2.9 | 96.0 | 16,727 | ||||||||
| Road Roller/Compactor (CAT CSS33E) |
82% | 55% | 100% | 45% | 327 | 5.4 | 96.0 | 31.433 | ||||||||
| Cleanup Bobcat (CAT 226B) |
80% | 5O% | 100% | 40% | 290 | 4.8 | 96.0 | 27,878 | ||||||||
| Grade Control/Probe Drill (Diamec Smart 8) |
80% | 50% | 100% | 40% | 290 | 4.8 | 120.0 | 34,848 | ||||||||
| Grader (CAT 12K) |
82% | 55% | 100% | 45% | 327 | 5.4 | 96.0 | 31,433 | ||||||||
| Service (Fuel) Truck (UTIMEC MF 350) |
80% | 5O% | 100% | 40% | 290 | 4.8 | 96.0 | 27,878 | ||||||||
| Lube truck (UTIMEC MF 350) |
80% | 5O% | 100% | 40% | 290 | 4.8 | 96.0 | 27,878 | ||||||||
| Scissor Lift (UTILIFT MF 540) |
80% | 30% | 100% | 24% | 174 | 2.9 | 96.0 | 16,727 | ||||||||
| Crane truck (UTIMEC Mf 100 MATERIAl) |
80% | 30% | 100% | 24% | 174 | 2.9 | 120.0 | 20,909 | ||||||||
| Integrated Toolcarrier (CAT 930K) |
80% | 50% | 100% | 40% | 290 | 4.8 | 96.0 | 27,678 | ||||||||
| Light Vehicle |
80% | 20% | 100% | 16% | !16 | 1.9 | 96.0 | 11,151 | ||||||||
| Personnel Carrier (UTIMEC MF 328 -32 person) |
80% | 30% | 100% | 24% | 174 | 2.9 | 96.0 | 16,727 | ||||||||
| Box Hole Borer |
85% | 60% | 100% | 51% | 370 | 6.1 | 120.0 | 44,431 | ||||||||
| Effective Date January 1, 2021 | Aris Gold | |||
| Page 248 of 384 |
| SRK Consulting | Soto Norte NI 43-101 – Feasibility Study |
Table 16.13: Other Mine Capital Items Operating Factors
| Fleet |
|
Availability (%) |
|
|
use
of |
|
|
Operator |
|
Effective Utilisation (%) |
Direct Operating Hours (DOH) | Equipment | ||||||||||
| per month | per shift | (months) | (hours) | |||||||||||||||||||
| Pottable Jaw Crusher (81x122cm) |
92% | 75% | 100% | 69% | 501 | 8 .3 | 60 | 30.056 | ||||||||||||||
| Permanent Jaw Crusher (122x160cm) |
92% | 75% | 100% | 69% | 501 | 8.3 | 180 | 90,169 | ||||||||||||||
| Rock Breaker – Boom (7.0m) |
92% | 30% | 100% | 28% | 200 | 3.3 | 60 | 12.023 | ||||||||||||||
| Rode Breaker· Hammer (277 kg-m) |
92% | 30% | 100% | 28% | 200 | 3.3 | 60 | 12,023 | ||||||||||||||
| OverheadTrolley Crane (9.1m) |
95% | 10% | 100% | 10% | 69 | 1.1 | 180 | 12.415 | ||||||||||||||
| OverheadTrolley Hoist (45t) |
95% | 10% | 100% | 10% | 69 | 1.1 | 180 | 12.415 | ||||||||||||||
| Vibrating Apron feeder (60’”) |
92% | 52% | 100% | 48% | 347 | 5.7 | 180 | 62,517 | ||||||||||||||
| Belt feeder (48“) |
92% | 52% | 100% | 48% | 347 | 5.7 | 180 | 62,517 | ||||||||||||||
| Conveyor Magnet |
92% | 52% | 100% | 48% | 347 | 5.7 | 180 | 62,517 | ||||||||||||||
| Ulldefground Conveyor—Phase 2 |
92% | 52% | 100% | 48% | 347 | 5.7 | 180 | 62,517 | ||||||||||||||
| Underground Conveyor—Phase 3 |
92% | 52% | 100% | 48% | 347 | 5.7 | 180 | 62,517 | ||||||||||||||
| SP-30-34 |
95% | 10% | 100% | 10% | 69 | 1.1 | 120 | 8,276 | ||||||||||||||
| Flygt BIBO |
95% | 22% | 100% | 21% | 152 | 2.5 | 60 | 9,104 | ||||||||||||||
| Challenge WTX3 |
95% | 32% | 100% | 30% | 221 | 3.6 | 60 | 13,242 | ||||||||||||||
| Challenge WT 106 |
95% | 11% | 100% | 10% | 76 | 1.3 | 120 | 9,104 | ||||||||||||||
| Challenge WT109 |
95% | 9% | 100% | 9% | 62 | 1.0 | 120 | 7,449 | ||||||||||||||
| Challenge W114 |
95% | 9% | 100% | 9% | 62 | 1.0 | 120 | 7,449 | ||||||||||||||
| Flygt 8kW |
95% | 23% | 100% | 22% | 159 | 2.6 | 60 | 9,518 | ||||||||||||||
| Ventilation Fans- Primary_PA |
95% | 100% | 100% | 95% | 690 | 11.4 | 180 | 124,146 | ||||||||||||||
| Ventilation Fans- Primary_EC |
95% | 100% | 100% | 95% | 690 | 11.4 | 180 | 124,146 | ||||||||||||||
| Ventilation Fans- Primary_EB |
95% | 100% | 100% | 95% | 690 | 11.4 | 180 | 124,146 | ||||||||||||||
| Ventilation Fans- Primary_LB |
95% | 100% | 100% | 95% | 690 | 11.4 | 180 | 124,146 | ||||||||||||||
| Ventilation Fans - Secondary_110kW |
90% | 80% | 100% | 72% | 523 | 8.6 | 60 | 31,363 | ||||||||||||||
| Ventilation Fans - Secondary_150kW |
90% | 80% | 100% | 72% | 523 | 8.6 | 60 | 31, 363 | ||||||||||||||
| Ventilation Fans - Secondary_224kW |
90% | 80% | 100% | 72% | 523 | 8.6 | 60 | 31,363 | ||||||||||||||
| Ventilation Fans - Secondary_55kW |
90% | 80% | 100% | 72% | 523 | 8.6 | 60 | 31,363 | ||||||||||||||
| Prressure Grouting Equipment |
90% | 30% | 100% | 27% | 196 | 3.2 | 60 | 11.761 | ||||||||||||||
| 16.8.3 | Heavy Haulage (TKM) Assessment |
The trucking requirements (65 t capacity) have been assessed based on estimates of the haul distances (mid-point of each 100 m elevation) for each materials handling phase by location and material type, which are provided in Table 16.14 to Table 16.16.
Table 16.17 shows the truck productivity parameters used over the LoM, based on discussions with Original Equipment Manufacturers (“OEM”) and Contract groups.
Table 16.14: Haulage Distances- Phase 1
| Waste Haulage | Ore Haulage | |||||||||||||
|
Elevation |
Emboque | La Bodega | Emboque | La Bodega | ||||||||||
|
From |
To | (km) | (km) | (km) | (km) | |||||||||
| 1700 | 1800 | 7.34 | 8.17 | 7.34 | 8.17 | |||||||||
| 1800 | 1900 | 6.6 | 7.44 | 6.6 | 7.44 | |||||||||
| 1900 | 2000 | 5.87 | 6.7 | 5.87 | 6.7 | |||||||||
| 2000 | 2100 | 5.14 | 5.97 | 5.14 | 5.97 | |||||||||
| 2100 | 2200 | 4.4 | 5.24 | 4.4 | 5.24 | |||||||||
| 2200 | 2300 | 3.67 | 4.5 | 3.67 | 4.5 | |||||||||
| 2300 | 2400 | 2.94 | 3.77 | 2.94 | 3.77 | |||||||||
| 2400 | 2500 | 2.2 | 3.04 | 2.2 | 3.04 | |||||||||
| 2500 | 2600 | 1.47 | 2.3 | 1.47 | 2.3 | |||||||||
| 2600 |
2700 | 0.74 | 1.57 | 0.74 | 1.57 | |||||||||
| 2700 | 2800 | - | 2.3 | - | 2.3 | |||||||||
| 2800 | 2900 | - | 3.04 | - | 3.04 | |||||||||
Table 16.15: Haulage Distances- Phase 2
|
Elevation |
Waste Haulage | Ore Haulage | ||||||||||||
| Emboque | La Bodega | Emboque | La Bodega | |||||||||||
| From | To | (km) | (km) | (km) | (km) | |||||||||
| 1700 | 1800 | 7.37 | 8.21 | 7 .37 | 8.21 | |||||||||
| 1800 | 1900 | 6.64 | 7.47 | 6.64 | 7.47 | |||||||||
| 1900 | 2000 | 5.91 | 6.74 | 5.91 | 6.74 | |||||||||
| 2000 | 2100 | 5.17 | 6.01 | 5.17 | 6.01 | |||||||||
| 2100 | 2200 | 4.44 | 5.27 | 4.44 | 5.27 | |||||||||
| 2200 | 2300 | 3.71 | 4.54 | 3.71 | 4.54 | |||||||||
| 2300 | 2400 | 2.97 | 3.81 | 2.97 | 3.81 | |||||||||
| 2400 | 2500 | 2.24 | 3.07 | 2.24 | 3.07 | |||||||||
| 2500 | 2600 | 1.51 | 2.34 | 1.51 | 2,34 | |||||||||
| 2600 | 2700 | 1.51 | 2.34 | 1.51 | 2.34 | |||||||||
| 2700 | 2800 | 2.24 | 5.27 | 2.24 | 5.27 | |||||||||
| 2800 | 2900 | 2.97 | 6.01 | 2.97 | 6.01 | |||||||||
| Effective Date January 1, 2021 | Aris Gold | |||
| Page 249 of 384 |
| SRK Consulting | Soto Norte NI 43-101 – Feasibility Study |
Table 16.16: Phase 3 – Haulage Distances
| Elevation | Waste Haulage | Ore Haulage | ||||||||||
| Emboque | La Bodega | Emboque | La Bodega | |||||||||
| From | To | (km) | (km) | (km) | (km) | |||||||
| 1700 | 1800 | 6.53 | 6.18 | 5.54 | 6.38 | |||||||
| 1800 | 1900 | 5.79 | 5.44 | 4.81 | 5.64 | |||||||
| 1900 | 2000 | 5.06 | 4.71 | 4.08 | 4.91 | |||||||
| 2000 | 2100 | 4.33 | 3.98 | 3.34 | 4.18 | |||||||
| 2100 | 2200 | 3.59 | 3.24 | 2.61 | 3.44 | |||||||
| 2200 | 2300 | 2.86 | 2.51 | 1.88 | 1.98 | |||||||
| 2300 | 2400 | 2.13 | 1.78 | 1.39 | 1.98 | |||||||
| 2400 | 2500 | 2.13 | 1.78 | 1.39 | 1.98 | |||||||
| 2500 | 2600 | 2.86 | 2.51 | 1.39 | 1.98 | |||||||
| 2600 | 2700 | 3.59 | 3.24 | 1.39 | 2.71 | |||||||
| 2700 | 2800 | 4.33 | 3.98 | 1.39 | 3.44 | |||||||
| 2800 | 2900 | 5.06 | 4.71 | 1.39 | 4.18 | |||||||
Table 16.17: Truck Productivity Parameters
| Parameter | Units | Mine Waste | Mine Ore | |||||
|
|
Speed Up Ramp |
km/hr | 8.2 | 8.2 | ||||
| Speed Down Ramp |
km/hr | 11 .9 | 11.9 | |||||
| Loading Time 7 m3 LHD |
hr | 0.25 | 0.25 | |||||
| Dumping Time |
hr | 0.05 | 0.05 | |||||
|
Capacity@ 90% Tray Fill |
m3 | 30.15 | 30.15 | |||||
| SG (loose) |
t/m3 | 1.49 | 1.55 | |||||
| Tonnage Capacity- Rated |
t | 65 | 65 | |||||
| Tonnaqe Capacity-Calculated |
t | 44.9 | 46.7 | |||||
| Trucks Hours per Month |
hr/month | 327 | 327 |
| 16.9 | Life of Mine Planning |
| 16.9.1 | Scheduling Methodology |
SRK used the Deswik mine planning software to sequence and schedule the mine design development and stopes from the optimisation process over several iterations using the base date of Notice to Proceed (NTP) as Month 01. This approach has been taken to reflect cash flows required prior to mining and indicate the valuation for the date that the investment decision will be made by the investor.
The schedule distinguishes between equipment productivities for mining activities in narrow and bulk stopes for all mining methods considered and targets the following:
| ● | Ramp up to a full sustainable 2.6 Mtpa production rate (determined from earlier schedule runs). |
| ● | Higher gold grades early in the schedule. |
| ● | Consistent sulphur grade which ultimately determines the concentrate mass pull. |
| ● | Keep the zinc grade below 600 ppm (or 0.06%) or maintain a copper/zinc ratio at 3:1 or higher. |
| 16.9.2 | Development and Mining Sequence |
The development schedule priorities are summarised as:
| ● | Priority 1: TBM tunnel from Padilla and adit/decline from El Cuatro and Emboque through to connection including all associated stockpiles, cross cuts, passing bays, and mobile crusher infrastructure. |
| ● | Priority 2: Primary infrastructure, including pump station, main ventilation raises, crusher chambers, and associated infrastructure. |
| ● | Priority 3: Other decline accesses and main connecting tunnels between mining zones as well as |
| Effective Date January 1, 2021 | Aris Gold | |||
| Page 250 of 384 |
| SRK Consulting | Soto Norte NI 43-101 – Feasibility Study |
underground workshop, magazines, and associated infrastructure.
| ● | Priority 4: Level development including sumps, ore/waste passes, footwall drives, cross cuts, and associated stockpiles. |
| 16.9.3 | Stope Schedule |
There were a number of aspects that were considered in the stope scheduling approach which are described as follows:
| ● | Stope Panels: Stopes were grouped into mining panels to be mined together. Panels are separated by: |
| ○ | Physical distance. |
| ○ | Change in mining direction, at a central access. |
| ● | Backfilling: All stopes have a mined volume and a filled volume. The filled volume includes both the stope volume and the development volume excavated through it considering: |
| ○ | Bulk stopes use the fill volume as it is. |
| ○ | Narrow stopes include a calculation based on the average width of the stope to consider the additional fill volume required to fill the bottom sill that is wider than the stope. |
| ○ | TRPs with slots for individual stopes will be utilised to detach stope production from backfill activities and remove the requirement to rehandle waste to create a free face (void) for subsequent production blasts. |
The final stope schedule is dependent on the derived stoping activities as outlined in Section 16.6.
Longitudinal stope panels are mined on retreat back to the stope access. Stopes are constrained vertically by logistical requirements of drilling, blasting, mucking and backfilling.
Drilling must wait for all backfilling below and mucking of stopes above to complete as both activities will require haulage equipment to move over the drill collars.
| 16.10 | Schedule Results |
The mine schedule physicals and key performance indicator (“KPI”) breakdown are presented in tables as follows:
| ● | Ore tonnage, grade and resource classification (Table 16.18) |
| ● | Material movement and backfill (Table 16.19) |
| ● | Lateral and vertical development and infrastructure excavation (Table 16.20) |
| ● | Production drilling, grade control and tkm (Table 16.21) |
| ● | Ground support rates (Table 16.22) for each development type and geotechnical ground classification used to estimate the ground support requirements (Table 16.23) |
| ● | Drilling and grouting for development and grout curtains (Table 16.24). |
Figure 16.42 shows the annual combined ore development and production schedule which shows the
| Effective Date January 1, 2021 | Aris Gold | |||
| Page 251 of 384 |
| SRK Consulting | Soto Norte NI 43-101 – Feasibility Study |
contribution of both narrow and wide stopes achieving a maximum sustainable production rate of 2.6 Mtpa over a 7-year period. The ramp up to full production is five years (from Year 01), with two years of initial ore development prior to the process facilities being operational in Month 41. The schedule shows a gradual increase in the gold grade over the mine life, averaging 6.22 g/t Au.
Figure 16.43 shows the total annual production tonnage with the gold, silver, copper and sulphur grades. The copper grade remains low and consistent over the LoM, while the silver grades generally decreases. The sulphur grade is relatively consistent over the mine life.
The annual production by mineral resource classification is shown in Figure 16.44 which comprises the following total tonnage breakdown over the LoM:
| ● | No Measured Resources |
| ● | Indicated Inventory: 24.6 Mt (or 99.3% of total production tonnage) |
| ● | Inferred Inventory: 0.15 Mt (or 0.7% of total ore tonnage) |
| ● | No metal grades were attributable in the Inferred tonnes in the schedule. |
Figure 16.45 shows the split of annual underground development for TBM and jumbo equipment. The schedule includes one TBM until Month 22. Jumbo development reaches a peak of 23 km per annum (SRK notes that comparable development rates have been reported at the Continental Gold Buriticá mine in Colombia) over two years (Year 04 and 05) until the initial access and RoM development is in place. It then stabilises at around 17 km per annum until Year 09. Only minor development is required to maintain production for the remainder of the mine life.
Figure 16.46 shows the annual material movement including ore, development waste and underground quarry waste required to sustain backfill activities in the mine. The total material movement reaches approximately 3.9 Mt in Year 06 (including quarry waste) which is mostly maintained over the mine life. SRK notes that during mining operations some unclassified material will be excavated as planned dilution (zero grade) where they fall inside economic stopes.
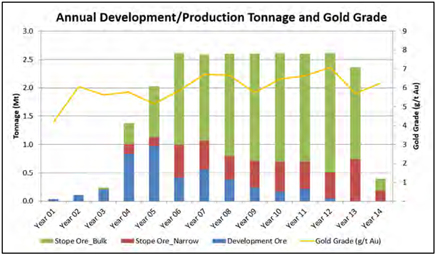
Figure 16.42: Annual Development/Production Tonnage and Gold Grade
| Effective Date January 1, 2021 | Aris Gold | |||
| Page 252 of 384 |
| SRK Consulting | Soto Norte NI 43-101 – Feasibility Study |
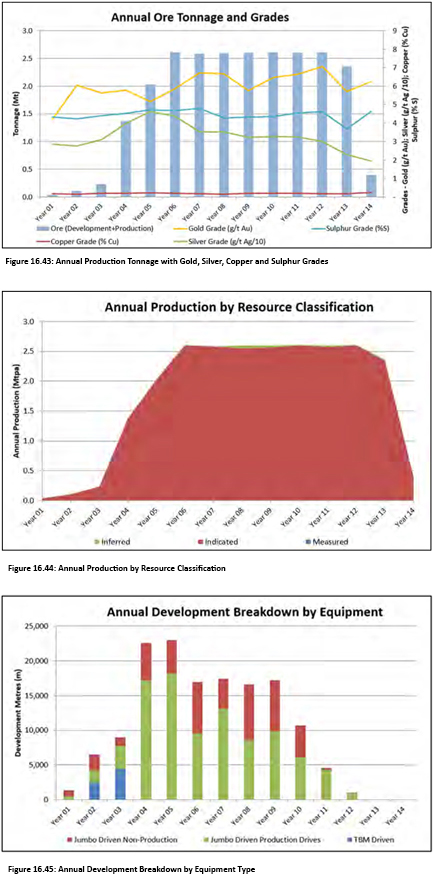
| Effective Date January 1, 2021 | Aris Gold | |||
| Page 253 of 384 |
| SRK Consulting | Soto Norte NI 43-101 – Feasibility Study |
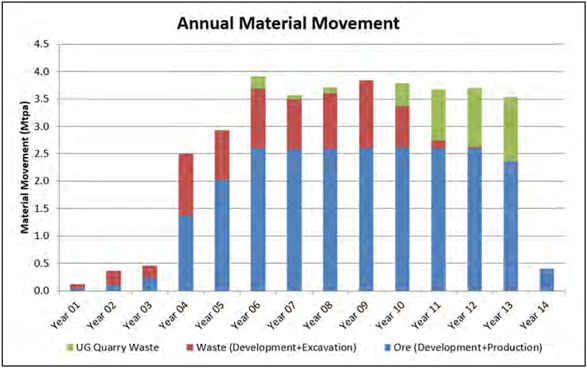
Figure 16.46: Annual Material Movement
| Effective Date January 1, 2021 | Aris Gold | |||
| Page 254 of 384 |
| SRK Consulting | Soto Norte NI 43-101 – Feasibility Study |
Table 16.18: Ore Tonnage, Grade and Resource Classification Schedule
| Description |
Units | Total | Year 01 | Year 02 | Year 03 | Year 04 | Year 05 | Year 06 | Year 07 | Year 08 | Year 09 | Year 10 | Year 11 | Year 12 | Year 13 | Year 14 | ||||||||||||||||
|
Ore Production Profile | ||||||||||||||||||||||||||||||||
| Stope Tonnes |
Mt | 20.58 | – | – | 0.04 | 0.54 | 1.05 | 2.19 | 2.03 | 2.21 | 2.36 | 2.44 | 2.39 | 2.56 | 2.36 | 0.40 | ||||||||||||||||
| Development Tonnes |
Mt | 4.19 | 0.03 | 0.11 | 0.20 | 0.83 | 0.98 | 0.42 | 0.56 | 0.38 | 0.24 | 0.17 | 0.21 | 0.05 | – | – | ||||||||||||||||
| Total Ore Tonnes |
Mt | 24.77 | 0.03 | 0.11 | 0.24 | 1.37 | 2.03 | 2.61 | 2.59 | 2.60 | 2.60 | 2.61 | 2.60 | 2.61 | 2.36 | 0.40 | ||||||||||||||||
|
Grade | ||||||||||||||||||||||||||||||||
| Au |
g/t | 6.22 | 4.19 | 6.06 | 5.62 | 5.77 | 5.16 | 5.85 | 6.71 | 6.65 | 5.74 | 6.46 | 6.64 | 7.07 | 5.70 | 6.24 | ||||||||||||||||
| Ag |
g/t | 34.4 | 28.7 | 27.7 | 31.2 | 39.8 | 46.0 | 43.7 | 35.4 | 35.2 | 32.4 | 32.8 | 32.5 | 30.1 | 23.0 | 19.5 | ||||||||||||||||
| Cu |
% | 0.19 | 0.18 | 0.15 | 0.21 | 0.20 | 0.23 | 0.19 | 0.18 | 0.16 | 0.20 | 0.19 | 0.19 | 0.18 | 0.16 | 0.24 | ||||||||||||||||
| Contained Metal | ||||||||||||||||||||||||||||||||
| Au |
koz | 4,950 | 4.7 | 21.0 | 43.0 | 254.8 | 336.3 | 491.2 | 557.8 | 556.0 | 480.4 | 542.5 | 555.7 | 593.6 | 432.9 | 80.1 | ||||||||||||||||
| Ag |
koz | 27,386 | 32 | 96 | 239 | 1,757 | 3,003 | 3,663 | 2,939 | 2,944 | 2,712 | 2,754 | 2,720 | 2,529 | 1,750 | 250 | ||||||||||||||||
| Cu |
klb | 102,868 | 137 | 348 | 1,080 | 6,188 | 10,309 | 11,161 | 10,326 | 9,081 | 11,755 | 10,744 | 10,944 | 10,244 | 8,449 | 2,102 | ||||||||||||||||
|
Ore Production Profile: by Mineral Resource Classification
| ||||||||||||||||||||||||||||||||
|
Classification |
% Total Tonnes | Total (Mt) | Year 01 | Year 02 | Year 03 | Year 04 | Year 05 | Year 06 | Year 07 | Year 08 | Year 09 | Year 10 | Year 11 | Year 12 | Year 13 | Year 14 | ||||||||||||||||
| Measured (Mt) |
0.0 | – | – | – | – | – | – | – | – | – | – | – | – | – | – | – | ||||||||||||||||
| Indicated (Mt) |
99.3 | 24.59 | 0.03 | 0.11 | 0.24 | 1.37 | 2.03 | 2.60 | 2.58 | 2.55 | 2.57 | 2.60 | 2.58 | 2.60 | 2.33 | 0.40 | ||||||||||||||||
| Inferred (Mt) |
0.7 | 0.17 | – | 0.00 | – | 0.00 | 0.00 | 0.01 | 0.01 | 0.05 | 0.03 | 0.01 | 0.02 | 0.01 | 0.03 | 0.00 | ||||||||||||||||
|
Total |
100 | 24.77 | 0.03 | 0.11 | 0.24 | 1.37 | 2.03 | 2.61 | 2.59 | 2.60 | 2.60 | 2.61 | 2.60 | 2.61 | 2.36 | 0.40 | ||||||||||||||||
Table 16.19: Material Movement and Backfill Schedule
| SCHEDULE SUMMARY |
Units | Total | Year 01 |
Year 02 |
Year 03 |
Year 04 |
Year 05 |
Year 06 | Year 07 |
Year 08 | Year 09 | Year 10 |
Year 11 |
Year 12 | Year 13 | Year 14 | ||||||||||||||||
|
MATERIAL MOVEMENT |
||||||||||||||||||||||||||||||||
|
Waste Movement (Underground) |
||||||||||||||||||||||||||||||||
| TBM Development |
Mt | 1.03 | 0.02 | 0.33 | 0.60 | 0.06 | 0.02 | – | – | – | – | – | – | – | – | – | ||||||||||||||||
| Lateral Development |
Mt | 7.26 | 0.08 | 0.24 | 0.18 | 1.01 | 0.84 | 0.98 | 0.86 | 0.97 | 1.19 | 0.73 | 0.14 | 0.02 | – | – | ||||||||||||||||
| Vertical Development |
Mt | 0.36 | 0.00 | 0.02 | 0.03 | 0.07 | 0.03 | 0.05 | 0.06 | 0.03 | 0.05 | 0.03 | 0.00 | – | – | – | ||||||||||||||||
| Excavation |
Mt | 0.13 | 0.01 | – | 0.01 | 0.04 | 0.02 | 0.05 | – | – | – | – | – | – | – | – | ||||||||||||||||
| Quarry Tonnes |
Mt | 4.02 | – | – | – | – | 0.01 | 0.23 | 0.07 | 0.11 | – | 0.41 | 0.94 | 1.07 | 1.17 | – | ||||||||||||||||
| Total Waste Movement |
Mt | 12.80 | 0.10 | 0.58 | 0.82 | 1.19 | 0.93 | 1.31 | 0.99 | 1.12 | 1.24 | 1.17 | 1.08 | 1.09 | 1.17 | – | ||||||||||||||||
| Ore Movement |
||||||||||||||||||||||||||||||||
| Development Ore |
Mt | 4.19 | 0.03 | 0.11 | 0.20 | 0.83 | 0.98 | 0.42 | 0.56 | 0.38 | 0.24 | 0.17 | 0.21 | 0.05 | – | – | ||||||||||||||||
| Narrow Stope Ore |
Mt | 4.69 | – | – | 0.01 | 0.17 | 0.15 | 0.58 | 0.50 | 0.42 | 0.47 | 0.52 | 0.48 | 0.45 | 0.74 | 0.19 | ||||||||||||||||
| Bulk Stope Ore |
Mt | 15.88 | – | – | 0.03 | 0.37 | 0.90 | 1.61 | 1.52 | 1.80 | 1.89 | 1.92 | 1.91 | 2.10 | 1.62 | 0.21 | ||||||||||||||||
| Total Stope Production |
Mt | 20.58 | – | – | 0.04 | 0.54 | 1.05 | 2.19 | 2.03 | 2.21 | 2.36 | 2.44 | 2.39 | 2.56 | 2.36 | 0.40 | ||||||||||||||||
|
Total Ore (Development + Production) |
Mt | 24.77 | 0.03 | 0.11 | 0.24 | 1.37 | 2.03 | 2.61 | 2.59 | 2.60 | 2.60 | 2.61 | 2.60 | 2.61 | 2.36 | 0.40 | ||||||||||||||||
|
Total Material Movement (Ore + Waste) |
Mt | 37.57 | 0.14 | 0.69 | 1.06 | 2.56 | 2.95 | 3.92 | 3.58 | 3.72 | 3.84 | 3.79 | 3.68 | 3.70 | 3.54 | 0.40 |
| Effective Date January 1, 2021 | Aris Gold | |||
| Page 255 of 384 |
| SRK Consulting | Soto Norte NI 43-101 – Feasibility Study |
| SCHEDULE SUMMARY |
Units | Total | Year 01 |
Year 02 |
Year 03 |
Year 04 |
Year 05 |
Year 06 | Year 07 |
Year 08 | Year 09 | Year 10 |
Year 11 |
Year 12 | Year 13 | Year 14 | ||||||||||||||||
|
BACKFILL SCHEDULE |
||||||||||||||||||||||||||||||||
| Cemented Rock Fill |
M.m3 | 1.49 | – | – | 0.00 | 0.07 | 0.08 | 0.21 | 0.13 | 0.19 | 0.28 | 0.10 | 0.10 | 0.16 | 0.15 | 0.03 | ||||||||||||||||
| Waste Rock Fill |
M.m3 | 5.11 | – | – | 0.01 | 0.13 | 0.27 | 0.55 | 0.47 | 0.51 | 0.50 | 0.62 | 0.62 | 0.59 | 0.70 | 0.14 | ||||||||||||||||
| Total Back Fill |
M.m3 | 6.59 | – | – | 0.01 | 0.20 | 0.35 | 0.76 | 0.60 | 0.70 | 0.78 | 0.72 | 0.72 | 0.75 | 0.84 | 0.17 | ||||||||||||||||
| Cemented Rock Fill |
Mt | 2.22 | – | – | 0.01 | 0.11 | 0.12 | 0.32 | 0.19 | 0.28 | 0.41 | 0.14 | 0.15 | 0.24 | 0.22 | 0.04 | ||||||||||||||||
| Waste Rock Fill |
Mt | 7.61 | – | – | 0.02 | 0.19 | 0.40 | 0.82 | 0.70 | 0.76 | 0.75 | 0.93 | 0.93 | 0.87 | 1.04 | 0.21 | ||||||||||||||||
| Total Back Fill |
Mt | 9.83 | – | – | 0.02 | 0.30 | 0.52 | 1.14 | 0.90 | 1.04 | 1.16 | 1.07 | 1.07 | 1.11 | 1.26 | 0.25 | ||||||||||||||||
| Cement |
t | 110,960 | – | – | 336 | 5,413 | 5,792 | 15,968 | 9,747 | 13,802 | 20,613 | 7,202 | 7,310 | 11,860 | 10,844 | 2,074 |
Table 16.20: Lateral and Vertical Development and Infrastructure Excavation Schedule
|
Schedule Summary |
Units | Total | Year 01 | Year 02 | Year 03 | Year 04 | Year 05 | Year 06 | Year 07 | Year 08 | Year 09 | Year 10 | Year 11 | Year 12 | Year 13 | Year 14 | ||||||||||||||||
|
TBM Tunnel |
m | 6,878 | – | 2,437 | 4,442 | – | – | – | – | – | – | – | – | – | – | – | ||||||||||||||||
|
Jumbo Access Tunnels |
m | 42 | 42 | – | – | – | – | – | – | – | – | – | – | – | – | – | ||||||||||||||||
|
Jumbo Launch Chamber |
m | 29 | 29 | – | – | – | – | – | – | – | – | – | – | – | – | – | ||||||||||||||||
|
Jumbo Cross Cuts, Vent Access, Sumps |
m | 1,453 | 20 | 108 | 222 | 809 | 294 | – | – | – | – | – | – | – | – | – | ||||||||||||||||
|
Total Jumbo Development |
m | 1,524 | 91 | 108 | 222 | 809 | 294 | – | – | – | – | – | – | – | – | – | ||||||||||||||||
|
Lateral Development (excluding TBM tunnel) | ||||||||||||||||||||||||||||||||
|
Declines Only |
m | 9,552 | 244 | 614 | 365 | 1,024 | 635 | 1,111 | 807 | 1,982 | 1,745 | 1,026 | – | – | – | – | ||||||||||||||||
|
Auxiliary Level Waste Development |
m | 36,571 | 556 | 1,567 | 815 | 4,196 | 4,131 | 6,340 | 3,436 | 5,931 | 5,607 | 3,555 | 350 | 87 | – | – | ||||||||||||||||
|
Ore Production Development |
m | 86,702 | 495 | 1,743 | 3,038 | 14,728 | 17,736 | 9,450 | 13,070 | 8,644 | 8,704 | 3,979 | 4,206 | 911 | – | – | ||||||||||||||||
|
Waste Development |
m | 5,572 | – | 38 | 70 | 1,810 | 174 | 58 | 99 | 22 | 1,142 | 2,160 | – | – | – | – | ||||||||||||||||
|
Total Development (excluding TBM tunnel) |
m | 138,398 | 1,295 | 3,962 | 4,288 | 21,757 | 22,675 | 16,959 | 17,411 | 16,579 | 17,198 | 10,719 | 4,556 | 998 | – | – | ||||||||||||||||
|
Total Lateral Development |
m | 146,800 | 1,386 | 6,507 | 8,951 | 22,566 | 22,969 | 16,959 | 17,411 | 16,579 | 17,198 | 10,719 | 4,556 | 998 | – | – | ||||||||||||||||
|
Vertical Development | ||||||||||||||||||||||||||||||||
|
Fresh Air Raise 6m |
m | – | – | – | – | – | – | – | – | – | – | – | – | – | – | – | ||||||||||||||||
|
Fresh Air Raise 5m |
m | 1,812 | – | 75 | 262 | 250 | 434 | – | 545 | 155 | 91 | – | – | – | – | – | ||||||||||||||||
|
Fresh Air Drop Raise |
m | 245 | – | – | – | – | – | 54 | – | 78 | 113 | – | – | – | – | – | ||||||||||||||||
|
Escapeway Raise |
m | 248 | – | – | – | – | – | 135 | 55 | 57 | – | – | – | – | – | – | ||||||||||||||||
|
Escapeway Drop Raise |
m | – | – | – | – | – | – | – | – | – | – | – | – | – | – | – | ||||||||||||||||
|
Return Air Raise 6 m |
m | 969 | – | 151 | – | 230 | – | 310 | 278 | – | – | – | – | – | – | – | ||||||||||||||||
|
Return Air Raise 4 m |
m | – | – | – | – | – | – | – | – | – | – | – | – | – | – | – | ||||||||||||||||
|
Return Air Drop Raise |
m | 1,190 | 20 | 39 | 53 | 81 | 57 | 162 | 81 | 245 | 367 | 85 | – | – | – | – | ||||||||||||||||
|
Waste Pass |
m | 926 | – | – | 134 | 136 | – | – | – | – | – | 586 | 70 | – | – | – | ||||||||||||||||
|
Ore Pass |
m | 1,176 | – | – | 118 | 636 | 43 | 145 | – | 97 | 136 | – | – | – | – | – | ||||||||||||||||
|
Finger Raise |
m | 336 | – | – | – | 28 | 28 | 84 | 28 | – | 168 | – | – | – | – | – | ||||||||||||||||
|
Total Vertical Development |
m | 6,902 | 20 | 266 | 567 | 1,362 | 562 | 889 | 988 | 633 | 875 | 671 | 70 | – | – | – | ||||||||||||||||
|
Infrastructure Excavations |
||||||||||||||||||||||||||||||||
| Effective Date January 1, 2021 | Aris Gold | |||
| Page 256 of 384 |
| SRK Consulting | Soto Norte NI 43-101 – Feasibility Study |
| Schedule Summary | Units | Total | Year 01 | Year 02 | Year 03 | Year 04 | Year 05 | Year 06 | Year 07 | Year 08 | Year 09 | Year 10 | Year 11 | Year 12 | Year 13 | Year 14 | ||||||||||||||||||
| Crusher Chamber |
|
m |
3 |
- | - | - | - | - | - | - | - | - | - | - | - | - | - | - | ||||||||||||||||
| TBM Launch Chamber |
|
m |
3 |
2,875 | 2,875 | - | - | - | - | - | - | - | - | - | - | - | - | - | ||||||||||||||||
| 6 m by 8 m Excavations |
|
m |
3 |
13,840 | - | - | 5,278 | 6,972 | - | 1,590 | - | - | - | - | - | - | - | - | ||||||||||||||||
| 8 m by 10 m Excavations |
|
m |
3 |
15,390 | - | - | - | - | 1,715 | 13,675 | - | - | - | - | - | - | - | - | ||||||||||||||||
| 10 m by 10 m Excavations |
|
m |
3 |
17,687 | - | - | - | 8,438 | 7,055 | 2,195 | - | - | - | - | - | - | - | - | ||||||||||||||||
|
Total Infrastructure Excavation |
|
m |
3 |
49,793 | 2,875 | - | 5,278 | 15,410 | 8,770 | 17,459 | - | - | - | - | - | - | - | - | ||||||||||||||||
Table 16.21: Production Drilling, Grade Control and tkm Schedule
| Schedule Summary |
Units | Total | Year 01 | Year 02 | Year 03 | Year 04 | Year 05 | Year 06 | Year 07 | Year 08 | Year 09 | Year 10 | Year 11 | Year 12 | Year 13 | Year 14 | ||||||||||||||||
| PRODUCTION DRILLING |
||||||||||||||||||||||||||||||||
| - | 870 | 7,824 | 63,119 | 59,299 | 174,072 | 155,612 | 139,404 | 136,632 | 175,128 | 145,564 | 147,790 | 203,816 | 49,938 | |||||||||||||||||||
| Narrow Stoping LH |
m | 1,459,068 | ||||||||||||||||||||||||||||||
| - | - | 18,205 | 95,888 | 154,182 | 275,710 | 284,495 | 335,947 | 358,841 | 331,716 | 350,718 | 378,333 | 277,093 | 33,950 | |||||||||||||||||||
| Bulk Stoping LH |
m | 2,895,079 | ||||||||||||||||||||||||||||||
| - | 870 | 26,029 | 159,007 | 213,480 | 449,782 | 440,108 | 475,351 | 495,473 | 506,844 | 496,282 | 526,124 | 480,909 | 83,888 | |||||||||||||||||||
| Total Production Drilling |
m | 4,354,147 | ||||||||||||||||||||||||||||||
| Box Hole Slots- Stoping |
m | 35,968 | - | - | 64 | 944 | 1,428 | 3,940 | 3,634 | 3,532 | 3,647 | 4,195 | 4,144 | 4,463 | 4,960 | 1,020 | ||||||||||||||||
| Box Hole Slots Ventilation |
m | 1,770 | 20 | 39 | 53 | 109 | 85 | 300 | 109 | 323 | 647 | 85 | - | - | - | - | ||||||||||||||||
| Box Hole Slots total |
m | 37,738 | 20 | 39 | 117 | 1,053 | 1,513 | 4,239 | 3,743 | 3,855 | 4,294 | 4,280 | 4,144 | 4,463 | 4,960 | 1,020 | ||||||||||||||||
|
GRADE CONTROL DRILLING |
||||||||||||||||||||||||||||||||
| Grade Control - Sludge |
m | 333,960 | - | - | 644 | 9,090 | 13,414 | 36,856 | 34,345 | 32,999 | 34,474 | 39,099 | 38,293 | 40,373 | 44,821 | 9,553 | ||||||||||||||||
| Grade Control - Diamond |
m | 118,038 | - | - | 1,042 | 29,930 | 29,930 | 11,338 | 14,960 | 4,866 | 18,570 | 7,402 | - | - | - | - | ||||||||||||||||
| TKM BREAKDOWN |
||||||||||||||||||||||||||||||||
| TKMs_Mine Ore |
M.tkm | 39.50 | 0.03 | 0.11 | 0.29 | 2.18 | 3.11 | 3.70 | 3.78 | 3.89 | 4.05 | 4.27 | 4.53 | 4.32 | 4.50 | 0.74 | ||||||||||||||||
| TKMs_Mine Waste |
M.tkm | 33.47 | 0.07 | 0.23 | 0.41 | 2.30 | 2.24 | 3.99 | 3.21 | 3.45 | 4.07 | 4.02 | 2.87 | 3.30 | 3.32 | - | ||||||||||||||||
| TKMs_Total |
M.tkm | 72.97 | 0.10 | 0.34 | 0.69 | 4.48 | 5.35 | 7.69 | 6.99 | 7.34 | 8.12 | 8.29 | 7.40 | 7.62 | 7.82 | 0.74 | ||||||||||||||||
| Average Haul_Mine Ore |
km | 1.6 | 0.8 | 1.0 | 1.2 | 1.6 | 1.6 | 1.4 | 1.5 | 1.5 | 1.6 | 1.6 | 1.7 | 1.7 | 1.9 | 1.8 | ||||||||||||||||
| Average Haul_Mine Waste |
km | 2.6 | 0.8 | 0.6 | 1.8 | 1.9 | 2.2 | 2.7 | 2.9 | 2.7 | 2.9 | 3.0 | 2.3 | 2.6 | 2.4 | |||||||||||||||||
Table 16.22: Development Profiles and Ground Support by Geotechnical Classification
| Development Profiles | Width | Height | Area | Ring Beam | Lattice Girder | Spiling Bars | Shotcrete | Mesh | Bolts | Cablebolt | ||||||||||||
| mW | mH | m2 | Ring Beam/m dev | Girder/m dev | bolts/m dev | Thick (m) | m³/ m dev | m2/ m dev | bolts/m dev | cable m/m dev | ||||||||||||
| TBM Tunnel: Truck Access GSS 1 (8 m Ø) |
8.0 | 8.0 | 50.3 | 22.63 | 3.50 | |||||||||||||||||
| TBM Tunnel: Truck Access GSS 2 (8 m Ø) |
8.0 | 8.0 | 50.3 | 0.05 | 1.26 | 22.63 | 5.00 | |||||||||||||||
| TBM Tunnel: Truck Access GSS 3 (8 m Ø) |
8.0 | 8.0 | 50.3 | 0.10 | 2.51 | 22.63 | 6.67 | |||||||||||||||
| TBM Tunnel: Truck Access GSS 4 (8 m Ø) |
8.0 | 8.0 | 50.3 | 1.00 | 0.20 | 5.02 | 22.63 | 13.00 | ||||||||||||||
| TBM Tunnel: Conveyor (8 m Ø) |
8.0 | 8.0 | 50.3 | 0.07 | 1.72 | 5.88 | ||||||||||||||||
| Lateral: Jumbo - Declines GSS 1 |
5.5 | 5.5 | 30.25 | 0.67 | 21.33 | 0.15 | 2.79 | 0.3 | ||||||||||||||
| Lateral: Jumbo - Declines GSS 2 |
5.5 | 5.5 | 30.25 | 0.10 | 1.86 | 6.92 | 0.3 | |||||||||||||||
| Effective Date January 1, 2021 | Aris Gold | |||
| Page 257 of 384 |
| SRK Consulting | Soto Norte NI 43-101 – Feasibility Study |
| Development Profiles | Width | Height | Area | Ring Beam | Lattice Girder | Spiling Bars | Shotcrete | Mesh | Bolts | Cablebolt | ||||||||||||||||||||||||||||||||||
| mW | mH | m2 | Ring Beam/m dev | Girder/m dev | bolts/m dev | Thick (m) | m³/ m dev | m2/ m dev | bolts/m dev | cable m/m dev | ||||||||||||||||||||||||||||||||||
| Lateral: Jumbo - Declines GSS 3 |
5.5 | 5.5 | 30.25 | 0.07 | 1.30 | 5.33 | 0.3 | |||||||||||||||||||||||||||||||||||||
| Lateral: Jumbo - Declines GSS 4 |
5.5 | 5.5 | 30.25 | 0.05 | 0.93 | 3.89 | 0.3 | |||||||||||||||||||||||||||||||||||||
| Lateral: Jumbo - Declines GSS 5 |
5.5 | 5.5 | 30.25 | 0.05 | 0.93 | 3.89 | 0.3 | |||||||||||||||||||||||||||||||||||||
| Lateral: Jumbo - Declines GSS 6 |
5.5 | 5.5 | 30.25 | 0.05 | 0.93 | 3.89 | 0.3 | |||||||||||||||||||||||||||||||||||||
| Lateral: Jumbo - Auxiliary Level Waste GSS1 |
5.5 | 5.5 | 30.25 | 0.67 | 21.33 | 0.15 | 2.79 | 0.3 | ||||||||||||||||||||||||||||||||||||
| Lateral: Jumbo - Auxiliary Level Waste GSS2 |
5.5 | 5.5 | 30.25 | 0.10 | 1.86 | 6.92 | 0.3 | |||||||||||||||||||||||||||||||||||||
| Lateral: Jumbo - Auxiliary Level Waste GSS3 |
5.5 | 5.5 | 30.25 | 0.07 | 1.30 | 5.33 | 0.3 | |||||||||||||||||||||||||||||||||||||
| Lateral: Jumbo - Auxiliary Level Waste GSS4 |
5.5 | 5.5 | 30.25 | 0.05 | 0.93 | 3.89 | 0.3 | |||||||||||||||||||||||||||||||||||||
| Lateral: Jumbo - Auxiliary Level Waste GSS5 |
5.5 | 5.5 | 30.25 | 0.05 | 0.93 | 3.89 | 0.3 | |||||||||||||||||||||||||||||||||||||
| Lateral: Jumbo - Auxiliary Level Waste GSS6 |
5.5 | 5.5 | 30.25 | 0.05 | 0.93 | 3.89 | 0.3 | |||||||||||||||||||||||||||||||||||||
| Lateral: Jumbo - Ore Production Drive GSS1 |
5.0 | 5.5 | 27.5 | 10.0 | 12.00 | 17.0 | ||||||||||||||||||||||||||||||||||||||
| Lateral: Jumbo - Ore Production Drive GSS2 |
5.0 | 5.5 | 27.5 | 10.0 | 6.92 | 17.0 | ||||||||||||||||||||||||||||||||||||||
| Lateral: Jumbo - Ore Production Drive GSS3 |
5.0 | 5.5 | 27.5 | 10.0 | 5.33 | 17.0 | ||||||||||||||||||||||||||||||||||||||
| Lateral: Jumbo - Ore Production Drive GSS4 |
5.0 | 5.5 | 27.5 | 10.0 | 3.89 | 17.0 | ||||||||||||||||||||||||||||||||||||||
| Lateral: Jumbo - Ore Production Drive GSS5 |
5.0 | 5.5 | 27.5 | 10.0 | 3.89 | 17.0 | ||||||||||||||||||||||||||||||||||||||
| Lateral: Jumbo - Ore Production Drive GSS6 |
5.0 | 5.5 | 27.5 | 10.0 | 3.89 | 17.0 | ||||||||||||||||||||||||||||||||||||||
| Lateral: Jumbo - Waste Production Drive GSS1 |
5.0 | 5.5 | 27.5 | 10.0 | 12.00 | 17.0 | ||||||||||||||||||||||||||||||||||||||
| Lateral: Jumbo - Waste Production Drive GSS2 |
5.0 | 5.5 | 27.5 | 10.0 | 6.92 | 17.0 | ||||||||||||||||||||||||||||||||||||||
| Lateral: Jumbo - Waste Production Drive GSS3 |
5.0 | 5.5 | 27.5 | 10.0 | 5.33 | 17.0 | ||||||||||||||||||||||||||||||||||||||
| Lateral: Jumbo - Waste Production Drive GSS4 |
5.0 | 5.5 | 27.5 | 10.0 | 3.89 | 17.0 | ||||||||||||||||||||||||||||||||||||||
| Lateral: Jumbo - Waste Production Drive GSS5 |
5.0 | 5.5 | 27.5 | 10.0 | 3.89 | 17.0 | ||||||||||||||||||||||||||||||||||||||
| Lateral: Jumbo - Waste Production Drive GSS6 |
5.0 | 5.5 | 27.5 | 10.0 | 3.89 | 17.0 | ||||||||||||||||||||||||||||||||||||||
| Crusher Chamber |
10.0 | 10.0 | 100.0 | 0.08 | 2.30 | 7.06 | 8.0 | |||||||||||||||||||||||||||||||||||||
| TBM Launch Chamber |
10.0 | 10.0 | 100.0 | 0.08 | 2.30 | 7.06 | 8.0 | |||||||||||||||||||||||||||||||||||||
| 6m by 8m Excavations |
6.0 | 8.0 | 48.0 | 0.08 | 1.84 | 5.88 | 2.4 | |||||||||||||||||||||||||||||||||||||
| 8m by 10m Excavations |
8.0 | 10.0 | 80.0 | 0.08 | 2.30 | 7.06 | 8.0 | |||||||||||||||||||||||||||||||||||||
| 10m by 10m Excavations |
10.0 | 10.0 | 100.0 | 0.08 | 2.30 | 7.06 | 8.0 | |||||||||||||||||||||||||||||||||||||
| Diameter (Ø) | Area | |||||||||||||||||||||||||||||||||||||||||||
| m | m2 | |||||||||||||||||||||||||||||||||||||||||||
| Fresh Air Raise 6m |
6.0 | 28.3 | ||||||||||||||||||||||||||||||||||||||||||
| Fresh Air Raise 5m |
5.0 | 19.6 | ||||||||||||||||||||||||||||||||||||||||||
| Fresh Air Drop Raise |
5.0 | 5.0 | 25.0 | |||||||||||||||||||||||||||||||||||||||||
| Escapeway Raise |
3.0 | 7.1 | 0.05 | 0.86 | 3.90 | |||||||||||||||||||||||||||||||||||||||
| Escapeway Drop Raise |
4.0 | 4.0 | 16.0 | 0.05 | 0.86 | 3.90 | ||||||||||||||||||||||||||||||||||||||
| Return Air Raise 6m |
6.0 | 28.3 | ||||||||||||||||||||||||||||||||||||||||||
| Return Air Raise 4m |
4.0 | 12.6 | ||||||||||||||||||||||||||||||||||||||||||
| Return Air Drop Raise |
5.0 | 5.0 | 25.0 | |||||||||||||||||||||||||||||||||||||||||
| Effective Date January 1, 2021 | Aris Gold | |||
| Page 258 of 384 |
| SRK Consulting | Soto Norte NI 43-101– Feasibility Study |
| Development Profiles | Width | Height | Area | Ring Beam | Lattice Girder | Spiling Bars | Shotcrete | Mesh | Bolts | Cablebolt | ||||||||||||
| mW | mH | m2 | Ring Beam/m dev | Girder/m dev | bolts/m dev | Thick (m) | m³/ m dev | m2/ m dev | bolts/m dev | cable m/m dev | ||||||||||||
| Waste Pass |
4.5 | 4.5 | 20.25 | 0.08 | 1.30 | 5.33 | ||||||||||||||||
| Orepass |
4.5 | 4.5 | 20.25 | 0.08 | 1.30 | 5.33 | ||||||||||||||||
| Finger Raise |
4.5 | 4.5 | 20.25 | |||||||||||||||||||
Table 16.23: Ground Support Schedule
|
Schedule Summary |
Units | Total | Year 01 | Year 02 | Year 03 |
Year 04 |
Year 05 |
Year 06 | Year 07 | Year 08 | Year 09 | Year 10 | Year 11 | Year 12 | Year 13 | Year 14 | ||||||||||||||||
|
GROUND SUPPORT TOTALS
| ||||||||||||||||||||||||||||||||
| Spiling Bar 3 m |
each | 50,960 | - | 22,566 | 26,730 | 866 | - | - | - | - | 256 | - | 542 | - | - | - | ||||||||||||||||
|
Cablebolt Metres |
m | 1,496,677 | 1,085 | 1,731 | 9,003 | 58,460 | 74,033 | 158,883 | 150,817 | 151,266 | 150,481 | 175,973 | 170,883 | 182,231 | 174,783 | 37,049 | ||||||||||||||||
| Lattice Girders |
each | 957 | - | 410 | 495 | 27 | - | - | - | - | 8 | - | 17 | - | - | - | ||||||||||||||||
|
Resin Bolts 2.4 m |
each | 280,758 | 4,486 | 23,059 | 31,299 | 39,800 | 24,907 | 34,639 | 21,915 | 33,526 | 35,305 | 29,442 | 1,960 | 419 | - | - | ||||||||||||||||
|
Shotcrete Volume |
m3 | 170,720 | 1,692 | 12,061 | 16,915 | 25,429 | 24,138 | 17,865 | 18,601 | 16,883 | 18,712 | 11,825 | 5,509 | 1,091 | - | - | ||||||||||||||||
|
Split Sets 2.4 m |
each | 387,572 | 2,356 | 8,194 | 13,852 | 65,804 | 78,450 | 39,273 | 56,919 | 36,996 | 40,831 | 19,282 | 21,296 | 4,318 | - | - | ||||||||||||||||
|
GROUND SUPPORT by Activity Type
| ||||||||||||||||||||||||||||||||
|
Non-production development 5.5 x 5.5 m
| ||||||||||||||||||||||||||||||||
| Spiling Bar 3 m |
each | 2,340 | - | - | 676 | 866 | - | - | - | - | 256 | - | 542 | - | - | - | ||||||||||||||||
| Cablebolt Metres |
m | 15,525 | 244 | 694 | 428 | 2,340 | 1,564 | 2,143 | 1,286 | 2,254 | 2,428 | 2,013 | 105 | 26 | - | - | ||||||||||||||||
| Lattice Girders |
each | 73 | - | - | 21 | 27 | - | - | - | - | 8 | - | 17 | - | - | - | ||||||||||||||||
| Resin Bolts 2.4 m |
each | 211,985 | 3,953 | 9,668 | 5,975 | 32,274 | 21,933 | 29,083 | 17,342 | 30,457 | 32,679 | 26,571 | 1,632 | 419 | - | - | ||||||||||||||||
| Shotcrete Volume |
m | 51,372 | 969 | 2,340 | 1,539 | 7,926 | 5,328 | 6,981 | 4,157 | 7,308 | 7,877 | 6,365 | 478 | 104 | - | - | ||||||||||||||||
| Split Sets 2.4 m |
each | - | - | - | - | - | - | - | - | - | - | - | - | - | - | - | ||||||||||||||||
|
Non-production development 5.0 x 5.0 m
| ||||||||||||||||||||||||||||||||
| Spiling Bar 3m |
each | - | - | - | - | - | - | - | - | - | - | - | - | - | - | - | ||||||||||||||||
| Cablebolt Metres |
m | 419 | 2 | 5 | 13 | 11 | 6 | 110 | 16 | 126 | 120 | 9 | - | - | - | - | ||||||||||||||||
| Lattice Girders |
each | - | - | - | - | - | - | - | - | - | - | - | - | - | - | - | ||||||||||||||||
| Resin Bolts 2.4 m |
each | 5,524 | 42 | 60 | 169 | 149 | 82 | 1,421 | 212 | 1,716 | 1,557 | 117 | - | - | - | - | ||||||||||||||||
| Shotcrete Volume |
m | 1,230 | 9 | 13 | 37 | 33 | 18 | 316 | 47 | 383 | 346 | 26 | - | - | - | - | ||||||||||||||||
| Split Sets 2.4 m |
each | - | - | - | - | - | - | - | - | - | - | - | - | - | - | - | ||||||||||||||||
|
Production/Ore development 5.0 x 5.0 m
| ||||||||||||||||||||||||||||||||
| Spiling Bar 3 m |
each | - | - | - | - | - | - | - | - | - | - | - | - | - | - | - | ||||||||||||||||
| Cablebolt Metres |
m | 26,011 | 148 | 523 | 911 | 4,418 | 5,321 | 2,835 | 3,921 | 2,593 | 2,611 | 1,194 | 1,262 | 273 | - | - | ||||||||||||||||
| Lattice Girders |
each | - | - | - | - | - | - | - | - | - | - | - | - | - | - | - | ||||||||||||||||
| Resin Bolts 2.4 m |
each | - | - | - | - | - | - | - | - | - | - | - | - | - | - | - | ||||||||||||||||
| Shotcrete Volume |
m | 87,775 | 531 | 1,872 | 3,151 | 14,895 | 17,723 | 8,792 | 12,855 | 8,326 | 9,300 | 4,420 | 4,923 | 987 | - | - | ||||||||||||||||
| Split Sets 2.4 m |
each | 387,572 | 2,356 | 8,194 | 13,852 | 65,804 | 78,450 | 39,273 | 56,919 | 36,996 | 40,831 | 19,282 | 21,296 | 4,318 | - | - | ||||||||||||||||
| TBM Development ø 8.0 m
|
||||||||||||||||||||||||||||||||
| Spiling Bar 3 m |
each | - | - | - | - | - | - | - | - | - | - | - | - | - | - | - | ||||||||||||||||
| Effective Date January 1, 2021 | Aris Gold | |||
| Page 259 of 384 |
| SRK Consulting | Soto Norte NI 43-101– Feasibility Study |
|
Schedule Summary |
Units | Total | Year 01 | Year 02 | Year 03 | Year 04 | Year 05 | Year 06 | Year 07 | Year 08 | Year 09 | Year 10 | Year 11 | Year 12 | Year 13 | Year 14 | ||||||||||||||||
| Cablebolt Metres |
m | - | - | - | - | - | - | - | - | - | - | - | - | - | - | - | ||||||||||||||||
| Lattice Girders |
each | - | - | - | - | - | - | - | - | - | - | - | - | - | - | - | ||||||||||||||||
| Resin Bolts 2.4 m |
each | 30,910 | - | 13,252 | 17,658 | - | - | - | - | - | - | - | - | - | - | - | ||||||||||||||||
| Shotcrete Volume |
m | 5,355 | - | 3,587 | 1,768 | - | - | - | - | - | - | - | - | - | - | - | ||||||||||||||||
| Split Sets 2.4 m |
each | - | - | - | - | - | - | - | - | - | - | - | - | - | - | - | ||||||||||||||||
| TBM Access Drives
|
||||||||||||||||||||||||||||||||
| Spiling Bar 3m |
each | 774 | - | - | 164 | 610 | - | - | - | - | - | - | - | - | - | - | ||||||||||||||||
| Cablebolt Metres |
m | 1,126 | 696 | 33 | 66 | 243 | 88 | - | - | - | - | - | - | - | - | - | ||||||||||||||||
| Lattice Girders |
each | 24 | - | - | 5 | 19 | - | - | - | - | - | - | - | - | - | - | ||||||||||||||||
| Resin Bolts 2.4m |
each | 7,814 | 571 | 667 | 959 | 3,584 | 2,033 | - | - | - | - | - | - | - | - | - | ||||||||||||||||
| Shotcrete Volume |
m | 2,129 | 175 | 176 | 258 | 973 | 546 | - | - | - | - | - | - | - | - | - | ||||||||||||||||
| Split Sets 2.4m |
each | - | - | - | - | - | - | - | - | - | - | - | - | - | - | - | ||||||||||||||||
| Excavations and Vertical Development
|
||||||||||||||||||||||||||||||||
| Spiling Bar 3m |
each | - | - | - | - | - | - | - | - | - | - | - | - | - | - | - | ||||||||||||||||
| Cablebolt Metres |
m | 9,552 | 690 | - | - | 2,025 | 2,208 | 4,629 | - | - | - | - | - | - | - | - | ||||||||||||||||
| Lattice Girders |
each | - | - | - | - | - | - | - | - | - | - | - | - | - | - | - | ||||||||||||||||
| Resin Bolts 2.4 m |
each | 28,618 | 244 | 1,247 | 2,856 | 7,378 | 2,892 | 4,135 | 4,361 | 1,352 | 1,069 | 2,754 | 329 | - | - | - | ||||||||||||||||
| Shotcrete Volume |
m | 11,726 | 111 | 446 | 1,032 | 2,575 | 1,069 | 1,776 | 1,541 | 866 | 1,189 | 1,014 | 107 | - | - | - | ||||||||||||||||
| Split Sets 2.4 m |
each | - | - | - | - | - | - | - | - | - | - | - | - | - | - | - | ||||||||||||||||
| Cable Bolt Metres |
||||||||||||||||||||||||||||||||
| Narrow Longitudinal Stopes |
m | 682,890 | - | 510 | 3,570 | 29,265 | 28,875 | 80,052 | 70,688 | 67,593 | 63,699 | 86,697 | 69,384 | 67,021 | 91,915 | 23,619 | ||||||||||||||||
| Bulk Longitudinal Stopes |
m | 736,440 | - | - | 4,080 | 20,400 | 34,700 | 68,434 | 74,225 | 78,699 | 81,622 | 81,300 | 92,885 | 104,477 | 82,188 | 13,430 | ||||||||||||||||
Table 16.24: Drilling and Grouting Schedule for Development and Grout Curtains
| Schedule Summary |
Units | Total | Year 01 | Year 02 | Year 03 | Year 04 | Year 05 | Year 06 | Year 07 | Year 08 | Year 09 | Year 10 | Year 11 | Year 12 | Year 13 | Year 14 | ||||||||||||||||
|
GROUTING DEVELOPMENT LENGTHS
| ||||||||||||||||||||||||||||||||
| Probe Hole Coverage
|
||||||||||||||||||||||||||||||||
| El Cuatro Decline Development |
m | - | - | - | - | - | - | - | - | - | - | - | - | - | - | - | ||||||||||||||||
| Emboque Decline Development |
m | 4,751 | 244 | 614 | 269 | 1,024 | 635 | 887 | 783 | 297 | - | - | - | - | - | - | ||||||||||||||||
| La Bodega Decline Development |
m | 4,801 | - | - | 96 | - | - | 224 | 24 | 1,685 | 1,745 | 1,026 | - | - | - | - | ||||||||||||||||
| Cover Drilling & Grouting
|
||||||||||||||||||||||||||||||||
| TBM Tunnel |
m | 1,240 | - | - | 1,240 | - | - | - | - | - | - | - | - | - | - | - | ||||||||||||||||
| Development Intersecting Faults |
m | 1,512 | 36 | 149 | 151 | 262 | 193 | 332 | 275 | 36 | 42 | 36 | - | - | - | - | ||||||||||||||||
| Development Beyond LB Grout Curtain |
m | - | - | - | - | - | - | - | - | - | - | - | - | - | - | - | ||||||||||||||||
| Grout Curtain for La Bodega
|
||||||||||||||||||||||||||||||||
| North Development |
m | 2,386 | - | - | - | - | - | 10 | 108 | 605 | 1,397 | 266 | - | - | - | - | ||||||||||||||||
| South Development |
m | 3,294 | - | - | - | - | - | 10 | 193 | 1,048 | 1,777 | 266 | - | - | - | - | ||||||||||||||||
| Effective Date January 1, 2021 | Aris Gold | |||
| Page 260 of 384 |
| SRK Consulting | Soto Norte NI 43-101– Feasibility Study |
| Schedule Summary | Units | Total | Year 01 |
Year 02 |
Year 03 |
Year 04 |
Year 05 |
Year 06 |
Year 07 |
Year 08 |
Year 09 |
Year 10 |
Year 11 |
Year 12 |
Year 13 |
Year 14 | ||||||||||||||||
|
Development Total |
m | 5,680 | - | - | - | - | - | 20 | 301 | 1,653 | 3,175 | 532 | - | - | - | - | ||||||||||||||||
|
Grout Curtain under La Baja River |
||||||||||||||||||||||||||||||||
|
Upstream Development (East of Curtain) |
m | 4,384 | - | 263 | - | 1,459 | 628 | 135 | 58 | 530 | 469 | 828 | 14 | - | - | - | ||||||||||||||||
|
Downstream Development (West of Curtain) |
m | - | - | - | - | - | - | - | - | - | - | - | - | - | - | - | ||||||||||||||||
|
DRILLING METRES |
||||||||||||||||||||||||||||||||
|
Grout Curtain Drilling Extension |
m | 108,317 | - | - | - | - | - | 295 | 5,785 | 33,212 | 64,333 | 4,692 | - | - | - | - | ||||||||||||||||
|
Grout Curtain Drilling Vertical |
m | 156,515 | - | 8,753 | - | 48,632 | 20,929 | 4,511 | 1,942 | 17,665 | 21,134 | 32,471 | 478 | - | - | - | ||||||||||||||||
|
Grout Curtain River Drilling Vertical |
m | 268,582 | - | 8,753 | - | 48,632 | 20,929 | 4,806 | 7,876 | 52,077 | 87,417 | 37,613 | 478 | - | - | - | ||||||||||||||||
|
Grout for RockFill Drilling |
m | 196,110 | 1,071 | 7,898 | 26,262 | 29,922 | 14,568 | 9,947 | 10,136 | 30,109 | 43,244 | 22,721 | 232 | - | - | - | ||||||||||||||||
|
Grout Curtain Total Drilling |
m | 729,525 | 1,071 | 25,404 | 26,262 | 127,18 7 |
56,426 | 19,560 | 25,738 | 133,06 4 |
216,12 8 |
97,497 | 1,188 | |||||||||||||||||||
|
Grout EC Decline Cover and Probe Drilling Pre-Grout |
m | 9,502 | 488 | 1,227 | 537 | 2,047 | 1,269 | 1,773 | 1,565 | 595 | - | - | - | - | - | - | ||||||||||||||||
|
Grout EB Decline Cover and Probe Drilling Pre-Grout |
m | 9,601 | - | - | 193 | - | - | 448 | 48 | 3,370 | 3,490 | 2,051 | - | - | - | - | ||||||||||||||||
|
Grout LB Decline Cover and Probe Drilling Pre-Grout |
m | 53,360 | - | - | - | - | - | 159 | 3,124 | 16,976 | 28,795 | 4,305 | - | - | - | - | ||||||||||||||||
|
Grout Curtain Cover Drilling Pre-Grout |
m | 76,066 | - | 4,254 | - | 23,635 | 10,172 | 2,192 | 944 | 8,585 | 10,271 | 15,781 | 232 | - | - | - | ||||||||||||||||
|
Grout River Cover Drilling Pre-Grout |
m | 10,042 | - | - | 10,042 | - | - | - | - | - | - | - | - | - | - | - | ||||||||||||||||
|
Grout TBM Cover Drilling Post-Grout |
m | 13,042 | - | - | 13,042 | - | - | - | - | - | - | - | - | - | - | - | ||||||||||||||||
|
Grout TBM Cover Drilling Pre-Grout |
m | 24,497 | 583 | 2,416 | 2,449 | 4,240 | 3,127 | 5,374 | 4,454 | 583 | 687 | 583 | - | - | - | - | ||||||||||||||||
|
Grout Faults Cover Drilling Pre-Grout |
m | - | - | - | - | - | - | - | - | - | - | - | - | - | - | - | ||||||||||||||||
|
Grout Beyond Curtain Cover Drilling Pre-Grout |
m | 30,825 | - | - | - | 530 | 1,000 | 3,021 | 3,981 | 2,832 | 3,150 | 3,929 | 3,411 | 4,881 | 3,594 | 495 | ||||||||||||||||
|
Grout Cover Total Drilling |
m | 226,935 | 1,071 | 7,898 | 26,262 | 30,452 | 15,568 | 12,969 | 14,117 | 32,941 | 46,394 | 26,650 | 3,643 | 4,881 | 3,594 | 495 | ||||||||||||||||
|
GROUT TONNES |
||||||||||||||||||||||||||||||||
|
Grout Curtain Total |
t | 2,426 | - | 136 | - | 754 | 324 | 70 | 30 | 274 | 328 | 503 | 7 | - | - | - | ||||||||||||||||
|
Grout River Curtain Total |
t | 4,163 | - | 136 | - | 754 | 324 | 74 | 122 | 807 | 1,355 | 583 | 7 | - | - | - | ||||||||||||||||
|
Grout for RockFill |
t | 37,303 | 55 | 763 | 3,251 | 3,643 | 2,082 | 2,335 | 2,944 | 4,703 | 6,691 | 4,521 | 1,761 | 2,478 | 1,825 | 251 | ||||||||||||||||
|
Grout Curtain, River and Rockfill Total Tonnes |
t | 43,893 | 55 | 1,034 | 3,251 | 5,151 | 2,731 | 2,479 | 3,097 | 5,784 | 8,374 | 5,607 | 1,776 | 2,478 | 1,825 | 251 | ||||||||||||||||
|
Grout Faults Cover Drilling Pre-Grout |
t | - | - | - | - | - | - | - | - | - | - | - | - | - | - | - | ||||||||||||||||
|
Grout Beyond Curtain Cover Drilling Pre-Grout |
t | 15,649 | - | - | - | 269 | 508 | 1,534 | 2,021 | 1,438 | 1,599 | 1,994 | 1,732 | 2,478 | 1,825 | 251 | ||||||||||||||||
|
Grout Curtain Cover Pre-Grout |
t | 7,151 | - | 400 | - | 2,222 | 956 | 206 | 89 | 807 | 966 | 1,484 | 22 | - | - | - | ||||||||||||||||
|
Grout River Cover Pre-Grout |
t | 1,888 | - | - | 1,888 | - | - | - | - | - | - | - | - | - | - | - | ||||||||||||||||
|
Grout TBM Cover Post-Grout |
t | 1,133 | - | - | 1,133 | - | - | - | - | - | - | - | - | - | - | - | ||||||||||||||||
|
Grout TBM Cover Pre-Grout |
t | 2,303 | 55 | 227 | 230 | 399 | 294 | 505 | 419 | 55 | 65 | 55 | - | - | - | - | ||||||||||||||||
|
Grout Cover Total Tonnes |
t | 28,124 | 55 | 627 | 3,251 | 2,890 | 1,758 | 2,245 | 2,529 | 2,300 | 2,629 | 3,533 | 1,753 | 2,478 | 1,825 | 251 | ||||||||||||||||
|
GROUT TOTAL TONNES |
t | 72,016 | 110 | 1,661 | 6,502 | 8,040 | 4,489 | 4,724 | 5,625 | 8,084 | 11,003 | 9,140 | 3,529 | 4,956 | 3,649 | 503 | ||||||||||||||||
| Effective Date January 1, 2021 | Aris Gold | |||
| Page 261 of 384 |
| SRK Consulting | Soto Norte NI 43-101 – Feasibility Study |
| 16.10.1 | Equipment Estimates |
The LoM estimates for development equipment is provided in Figure 16.47 which shows a requirement for one electric powered TBM for the tunnel access from Padilla (completed in Month 33) and up to seven jumbos for development (not including ground support) and cover drilling activities. From Year 11 the requirement for jumbos reduces significantly as the mine approaches full development.
Figure 16.48 shows the annual production drill metres for all stope types, which increases towards the later stages of the mine life when a greater portion of narrow stopes are mined. The longhole drills increase from four to seven over the main production years as the portion of narrow stopes increase to achieve the target production rate. A single boxhole borer is planned for stope production slots in the early stages of mining, increasing to two over the LoM as the number of slots increase. There is requirement for up to two Alimak raisedrill setups over the LoM.
Figure 16.49 shows the primary load and haul equipment over the LoM. Generally, between 15 and 17 x 65 t trucks and 10 to 12 x 18 t loaders are required for materials handling (including backfill) during steady production.
Figure 16.50 shows the main support equipment requirements over the LoM.
Table 16.25 provides a summary of the main mining equipment for development and production over the LOM with the initial purchase and replacement schedule provided in Table 16.26.
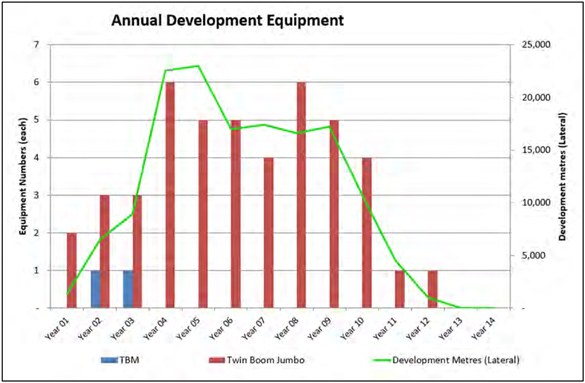
Figure 16.47: Annual Development Equipment Requirements
| Effective Date January 1, 2021 | Aris Gold | |||
| Page 262 of 384 |
| SRK Consulting | Soto Norte NI 43-101 – Feasibility Study |
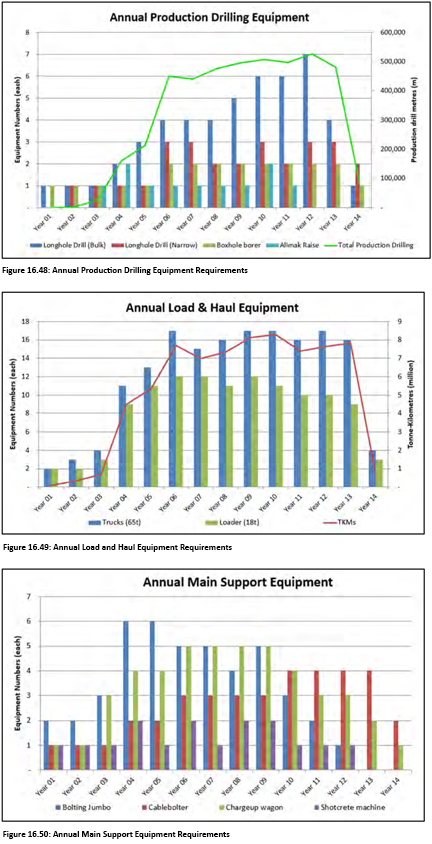
| 16.10.2 | Mine Personnel |
The professional staff (including management), workforce, and maintenance personnel for the underground mine is estimated based on the typical levels for this size of operation, operating 2 x 12-hour shifts, 24 hours
| Effective Date January 1, 2021 | Aris Gold | |||
| Page 263 of 384 |
| SRK Consulting | Soto Norte NI 43-101 – Feasibility Study |
per day, and 7 days per week. The maintenance, underground operator, and labour estimates are based on the annual equipment estimates. Equivalent salary and pay grades were based on investigations undertaken by Minesa.
The majority of underground positions are based on three rostered crews working a 2-shift, 6-day rotation. A majority of the management and staff work only day shift. The initial workforce will comprise of skilled mining contractors who will take a lead role in developing the mine for the initial years with mobile equipment to be covered by a MARC with the OEM for the initial five years of the mine life. Over this period, the mine will train up local operators who will develop into skilled operators as the mine makes the transition into a fully owner-operator site.
The skilled TBM tunnelling personnel (and management) will be covered by a separate contract directly with the OEM.
Figure 16.51 and Table 16.27 provides an annual estimate of the breakdown of mine personnel requirements for the underground operation over the LoMP.
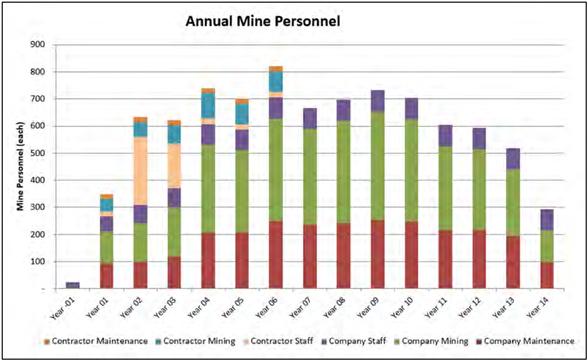
Figure 16.51: Annual Mine Personnel Estimate
| Effective Date January 1, 2021 | Aris Gold | |||
| Page 264 of 384 |
| SRK Consulting | Soto Norte NI 43-101 – Feasibility Study |
Table 16.25: Summary of main mining equipment for development and production
| Item |
Units | Year 01 | Year 02 | Year 03 | Year 04 | Year 05 | Year 06 | Year 07 | Year 08 | Year 09 | Year 10 | Year 11 | Year 12 | Year 13 | Year 14 | |||||||||||||||||
|
TBM |
each | - | 1 | 1 | - | - | - | - | - | - | - | - | - | - | - | |||||||||||||||||
|
Twin Boom Jumbo |
each | 2 | 3 | 3 | 6 | 5 | 5 | 4 | 6 | 5 | 4 | 1 | 1 | - | - | |||||||||||||||||
|
Bolting Jumbo |
each | 2 | 2 | 3 | 6 | 6 | 5 | 5 | 4 | 5 | 3 | 2 | 1 | - | - | |||||||||||||||||
|
Longhole Drill (Bulk) |
each | 1 | 1 | 1 | 2 | 3 | 3 | 4 | 4 | 4 | 5 | 5 | 5 | 5 | 4 | |||||||||||||||||
|
Longhole Drill (Narrow) |
each | - | - | 1 | 1 | 1 | 2 | 3 | 3 | 3 | 3 | 3 | 3 | 4 | 5 | |||||||||||||||||
|
Loader (18t) |
each | 2 | 2 | 3 | 9 | 11 | 12 | 12 | 11 | 12 | 11 | 10 | 10 | 9 | 3 | |||||||||||||||||
|
Trucks (65t) |
each | 2 | 3 | 4 | 11 | 13 | 17 | 15 | 16 | 17 | 17 | 16 | 17 | 16 | 4 | |||||||||||||||||
|
Cablebolter |
each | 1 | 1 | 1 | 2 | 2 | 3 | 3 | 3 | 3 | 4 | 4 | 4 | 4 | 2 | |||||||||||||||||
|
Chargeup wagon |
each | 1 | 1 | 3 | 4 | 4 | 5 | 5 | 5 | 5 | 4 | 3 | 3 | 2 | 1 | |||||||||||||||||
|
Shotcrete machine |
each | 1 | 1 | 1 | 2 | 1 | 2 | 1 | 2 | 2 | 1 | 1 | 1 | - | - | |||||||||||||||||
|
Cement Carrier |
each | 1 | 1 | 1 | 3 | 2 | 3 | 2 | 3 | 3 | 2 | 1 | 1 | - | - | |||||||||||||||||
|
Alimak Raise |
each | - | - | 1 | 2 | 1 | 1 | 1 | 1 | 1 | 2 | 1 | - | - | - | |||||||||||||||||
|
Boxhole borer |
each | 1 | 1 | 1 | 1 | 1 | 2 | 2 | 2 | 2 | 2 | 2 | 2 | 2 | 1 | |||||||||||||||||
Table 16.26: Initial purchase and replacement schedule of main mining equipment for development and production
| Item |
Units | Year 01 | Year 02 | Year 03 | Year 04 | Year 05 | Year 06 | Year 07 | Year 08 | Year 09 | Year 10 | Year 11 | Year 12 | Year 13 | Year 14 | |||||||||||||||||
|
Twin Boom Jumbo |
each | 2 | 1 | - | 3 | - | - | - | 1 | - | - | - | 1 | - | - | |||||||||||||||||
|
Bolting Jumbo |
each | 2 | - | 1 | 3 | - | - | - | - | 1 | - | - | - | - | - | |||||||||||||||||
|
Longhole Drill (Bulk) |
each | 1 | - | - | 1 | 1 | - | 1 | - | 1 | 1 | - | 1 | 1 | - | |||||||||||||||||
|
Longhole Drill (Narrow) |
each | - | - | 1 | - | - | 1 | 1 | - | - | - | 1 | - | 1 | - | |||||||||||||||||
|
Loader (18t) |
each | 2 | - | 1 | 6 | 2 | 2 | - | - | 1 | 1 | 2 | 2 | 2 | - | |||||||||||||||||
|
Trucks (65t) |
each | 2 | 1 | 1 | 7 | 2 | 4 | - | - | 2 | 1 | - | 8 | 1 | - | |||||||||||||||||
|
Cablebolter |
each | 1 | - | - | 1 | - | 1 | - | - | 1 | 1 | - | 1 | - | - | |||||||||||||||||
|
Chargeup wagon |
each | 1 | - | 2 | 1 | - | 1 | - | - | 1 | - | 1 | - | - | - | |||||||||||||||||
|
Shotcrete machine |
each | 1 | - | - | 1 | - | - | - | - | 1 | - | - | - | - | - | |||||||||||||||||
|
Cement Carrier |
each | 1 | - | - | 2 | - | - | - | - | 1 | - | - | - | - | - | |||||||||||||||||
|
Alimak Raise |
each | - | - | 1 | 1 | - | - | - | - | - | - | - | - | - | - | |||||||||||||||||
|
Boxhole borer |
each | 1 | - | - | - | - | 1 | - | - | - | - | 1 | - | - | - | |||||||||||||||||
Table 16.27: Summary of annual mine personnel requirements
| Item |
Units | Year 01 | Year 02 | Year 03 | Year 04 | Year 05 | Year 06 | Year 07 | Year 08 | Year 09 | Year 10 | Year 11 | Year 12 | Year 13 | Year 14 | |||||||||||||||||
| Company Staff |
each | 56 | 67 | 71 | 74 | 74 | 78 | 78 | 78 | 78 | 78 | 78 | 78 | 78 | 78 | |||||||||||||||||
| Company Mining |
each | 107 | 139 | 165 | 315 | 309 | 364 | 353 | 370 | 389 | 357 | 310 | 300 | 268 | 163 | |||||||||||||||||
| Company Maintenance |
each | 89 | 96 | 115 | 203 | 210 | 243 | 235 | 242 | 251 | 240 | 216 | 213 | 200 | 114 | |||||||||||||||||
| Contractor Staff |
each | 18 | 251 | 167 | 21 | 21 | 21 | - | - | - | - | - | - | - | - | |||||||||||||||||
| Contractor Mining |
each | 39 | 54 | 60 | 87 | 75 | 75 | - | - | - | - | - | - | - | - | |||||||||||||||||
| Contractor Maintenance |
each | 19 | 19 | 19 | 19 | 19 | 19 | - | - | - | - | - | - | - | - |
| Effective Date January 1, 2021 | Aris Gold | |||
| Page 265 of 384 |
| SRK Consulting | Soto Norte NI 43-101– Feasibility Study |
| 16.11 | Underground Mine Infrastructure |
| 16.11.1 | Introduction |
The location of the main underground infrastructure is shown below in Figure 16.52 (Maintenance Workshop, Fuel Bays, Explosive Magazines, Crib Room and Service Stores, Crusher Stations and Dewatering Infrastructure). Underground infrastructure is discussed in more detail in the following sections.
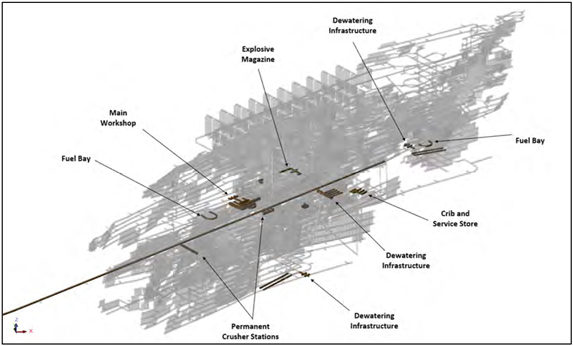
Figure 16.52: Oblique view of Underground Infrastructure
| 16.11.2 | Mine Electrical |
Initially, mine development commences at two geographically separate locations, namely Padilla and the mine deposit itself. The two sites are approximately 6 km apart in plan view, but accessible by road and the consideration of the likely overhead power line route means that these sites are considered isolated from each other, especially before the strategic upper drive connection is established between Padilla tunnel and Emboque declines.
The Padilla tunnel development will be supplied first using diesel engine generators through 34.5 kV step-up transformers, and then will switch to permanent 34.5 kV power from the Mill E-Room once available. The temporary 34.5 kV power will feed the initial mine deposit development and surface facilities until establishment of permanent power from the Padilla site is completed.
In addition to the surface E-Room described above, several 13.8 kV substations will be required to distribute 13.8 kV throughout the mine. The design has incorporated several different switchgear line-ups to minimize the effects of a ground fault or damaged equipment to the remainder of operations. A ring topology is being used via the upper and lower tunnels, which will allow for any individual substation to be supplied via two, or three different routes. This will ensure downtime is minimized for both the addition of infrastructure as well as any equipment damage or ground faults, which could otherwise shut down the entire mining operation for days at a time while troubleshooting takes place.
| Effective Date January 1, 2021 | Aris Gold | |||
| Page 266 of 384 |
| SRK Consulting | Soto Norte NI 43-101– Feasibility Study |
From the main 34.5 kV remote switchgear units, power will be stepped down to 13.8 kV from three E-rooms and distributed to the remainder of the mine to feed portable and permanent transformers and distributed for the use of Mining equipment and infrastructure.
Provided inputs when combined with the provided mining equipment data yielded an overall average mine load of approximately 18 MW, which drops to approximately 15 MW after the tunnel boring is completed.
| 16.11.3 | Mine Maintenance Workshop and Store |
A centrally located maintenance workshop will be located off the decline to service the mining areas. This maintenance workshop has been designed to facilitate break down and preventative maintenance programs. The maintenance workshop will be linked to the return airway with a regulator fitted on this return airway drive to direct the exhaust fumes in the event of a fire. The workshop and store will be fitted with a fire suppression system to automatically activate if smoke is detected. The main workshop will be located on the 2,445 m extraction level, west of the Emboque decline, with ready access from the access decline.
Fire doors at both access points to the workshop will be used to control ventilation during normal and emergency situations. The workshop will also be equipped with a fire suppression system. Up to nine large items of mobile equipment could be accommodated in the workshop at any one time. Any shortfalls will be handled by some breakdown maintenance being carried out in-the-field and some maintenance, such as light vehicles, being carried out on surface.
| 16.11.4 | Fuel Bays |
Fuel bays will be located off the decline of each mining zone (El Cuatro, Emboque and La Bodega) to service the mining areas. Each fuel bay has a fuel storage capacity of 7,000 L of diesel, 7,000 L of hydraulic oil and 1,000 L of rock drill oil. The fuel distribution will be linked to the return airway. A regulator will be fitted on this return airway drive to direct the exhaust fumes in the event of a fire. The fuel bay will be fitted with a fire suppression system to automatically activate if smoke is detected.
| 16.11.5 | Explosive Magazines |
A centrally located explosive magazine will be located off the decline to service the mining areas of Emboque and La Bodega. A second explosive magazine will be located off the decline to service the El Cuatro mining area. Magazines will be setup as per Colombian Explosives Regulations (based on the United States Regulations) and will be in a return airway drive. A small access door in a concrete wall will be present at the back of each magazine. This is to ensure the direct exhaust of fumes in the event of a fire, etc. Both magazines have been designed to facilitate ease of loading explosive wagons and carriers. The magazines have been designed to separately store detonators away from other explosives products. A fire suppression system will be installed to automatically activate if smoke is detected.
| 16.11.6 | Lunchrooms, Store and Offices |
Lunchroom facilities and offices are located in the Emboque zone at the 2,550 m level. These areas are located on the primary intake ventilation circuit and can be used as safe firing districts/fresh air bases. The crib room facilities will be constructed to ensure minimal downtime during the shift. The offices and stores will be used by shift supervisors for planning of oncoming shifts and storage of general mine consumables (vent bag, pipe, valves etc).
| 16.11.7 | Underground Water Supply |
| Effective Date January 1, 2021 | Aris Gold | |||
| Page 267 of 384 |
| SRK Consulting | Soto Norte NI 43-101– Feasibility Study |
The water for the mine construction stage will be sourced from the recycled water from the mine dewatering. The water will be pumped out of the mine, treated for pH and total suspended solids, and then either discharged to the environment according to operation permit standards or returned to water storage. For the Padilla side of the mining operations, water required during mine construction will be drawn from the Suratá River in accordance with the environmental license submission. At Emboque and Padilla sites, water storage tanks will be constructed to hold approximately 0.9 Ml at each location. The water storage capacity represents approximately 6 hours of operational water requirements for the mine.
An assessment of the mine water requirements was undertaken to determine the quantity of water required to support the mining operations phase of the Project. Table 16.28 provides a summary of the water usage estimate during operations.
Table 16.28: Mine Water Usage Requirements During Operational Period
| Origin | Time | Rate | Total Number per Day | Utilization | Total | |||||
| Mins | (I/s) | (%) | (m3/day) | |||||||
| Watering Down Blasted Muck |
20 | 5 | 14 | 100% | 84.0 | |||||
| Jumbo Development Drilling |
720 | 2.7 | 4 | 50% | 466.6 | |||||
| Bolting |
792 | 2.7 | 6 | 55% | 769.8 | |||||
| Shotcrete |
720 | 0.3 | 5 | 50% | 64.8 | |||||
| Cable bolting |
720 | 1.9 | 4 | 50% | 328.3 | |||||
| Production Drilling |
936 | 2.91 | 8 | 65% | 1,307.4 | |||||
| Box Hole Borer |
720 | 1.5 | 2 | 50% | 129.6 | |||||
| TBM |
720 | 12.5 | 0 | 50% | 0.0 | |||||
| Raise Borer |
432 | 1.5 | 2 | 30% | 77.8 | |||||
| ITH Machine Curtain Grouting |
936 | 2.7 | 1 | 65% | 151.6 | |||||
| Grouting Jumbo |
432 | 2.7 | 2 | 30% | 140.0 | |||||
| Diamond Drilling |
720 | 0.3 | 2 | 50% | 25.9 | |||||
| Water for Services (m3/day) | 3,545.8 | |||||||||
| I/s | 41.0 | |||||||||
| 16.11.8 | Mine Dewatering |
The mine dewatering infrastructure requirements and layout is summarised in Section 16.4.3.
| 16.12 | Mine Ventilation |
| 16.12.1 Introduction | |
The Soto Norte mine design is developed with two main spiral ramps that connect to surface and another with internal connections to the rest of the mine. Each spiral has turn-outs at each sill level. The spiral ramps are in mining zones Emboque, La Bodega as well as an adit access at El Cuatro and a single TBM access tunnel is planned from the surface process facilities located at Padilla to connect with the underground workings. The mine is planned with decline access with additional shafts for ventilation. Each mining zone has intake and exhaust connections to surface. Development and production material in the mine are to be moved with diesel loader (“LHD”) and truck haulage equipment. The TBM tunnel (Padilla) is to be equipped with a conveyor to haul material out of the mine, which ultimately reduces the amount of diesel usage
| Effective Date January 1, 2021 | Aris Gold | |||
| Page 268 of 384 |
| SRK Consulting | Soto Norte NI 43-101– Feasibility Study |
underground.
Each ramp has a drop raise system to be used primarily for exhausting air. Bored raises are also proposed parallel to the Emboque ramp. An exhausting drop raise system connects to the El Cuatro exhaust fan. Fans are to be located underground at each of the exhaust portals/shafts.
| 16.12.2 | Airflow Requirements |
Colombian regulation requires an airflow of 0.09 m3/kW of diesel motor power. The amount of equipment is expected to change through the mine life due to haulage cycle time and changes in production. The total minimum mine airflow is calculated using all the LHD (336 kW each) and haul trucks (567 kW each) at an assumed utilisation of 100%. This is to cover additional smaller equipment in the mine used with lower utilisation factors. A breakdown of the equipment, power and airflow requirements assuming 0.09 m3/s per kW is displayed in Figure 16.53. Additional airflow is needed to account for leakage.
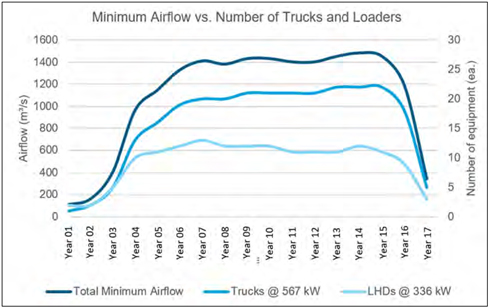
Figure 16.53: Annual Total Minimum Airflow Requirements
| 16.12.3 | TBM Ventilation System Design |
The mine design incorporates a single TBM tunnel that is to be used for access and material handling using a conveyor system. The airflow required at the TBM provided by the TBM manufacturer is approximately 1,750 m3/min (29.2 m3/s) per machine. This airflow quantity is primarily for the dilution of heat and dust generated by the electric powered TBM. Other diesel equipment is planned to be in use for development of crosscuts and raises and to bring supplies to the TBM during development.
There is already an allocation of 29.2 m3/s of airflow for the TBM that is not used for dilution of diesel and can be used for the allocation of a truck. A single truck has a minimum airflow requirement of 51 m3/s, which is higher than the allotment of air needed for the TBM. Therefore, the minimum recommended airflow for the TBM heading is 51 m3/s, however, this means that only one piece of diesel equipment should be operating in the TBM tunnel at any given time.
Based on the profile of the TBM tunnels and the largest piece of equipment, a duct diameter of up to 2 m could be used, however, the largest standard size of hardline duct is typically around 1.8 m. A profile drawing of the duct in the tunnel is shown in Figure 16.54.
| Effective Date January 1, 2021 | Aris Gold | |||
| Page 269 of 384 |
| SRK Consulting | Soto Norte NI 43-101– Feasibility Study |

Figure 16.54: Plan of Example TBM Auxiliary System Layout
| 16.12.4 | Modelling Summary |
Intake air from surface enters the mine through the Emboque ramp and three bored intake raises. The air from the portal flows down the ramp deep into the mine. Bored intake raises parallel each ramp, as needed, to supply additional fresh air to each mining area. This configuration provides partial flow-through ventilation. Where flow-through ventilation is not present, a portion of the air is pulled from the ramp via auxiliary ventilation into the sill levels to the working face. Most levels have a connection to the return raise to prevent reuse of air between levels. The return raise system consists of either drop raises or raise bores that parallel each of the ramps.
Each of the fixed facilities has direct connections to exhausting air systems to prevent any air from these areas from reaching the working levels or re-entering ramps.
It is proposed to use underground fan installations at each of the exhaust connections to the surface. Three fan installations are proposed. Exhaust fan installations are required at the El Cuatro portal, the bottom of the Emboque return shafts and Padilla TBM tunnel below the Emboque truck dump.
Leakage through stoppings and doors must also be accounted for in the total mine flow. Curtains are to be used on the upper level or open stopes. Slatted curtains are to also be used at entrances of ore passes to reduce flow and dust when ore passes are not full. A general layout of the airflow distribution is shown in Figure 16.55.
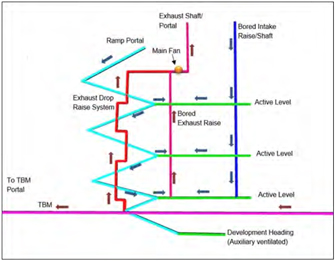
Figure 16.55: Long Section of General Ventilation Scheme
| 16.12.5 | Level Ventilation and Duct Design |
Two general level setups are applied in the mine design. Some levels will have dead-end headings throughout, requiring extensive auxiliary ventilation ducting. The second layout has partial flow-through
| Effective Date January 1, 2021 | Aris Gold | |||
| Page 270 of 384 |
| SRK Consulting | Soto Norte NI 43-101– Feasibility Study |
ventilation with both an intake and exhaust raise on the level.
For a dead-end ventilation level, air enters the level from the ramp. Airflow is drawn through the auxiliary ventilation system (duct line) to the face. The exhaust air courses back across the level toward the exhaust raise. There is a regulator on the exhaust raise that is sized for the level airflow plus some additional airflow to be drawn directly from the ramp/spiral to ventilate the loading of the haul truck (prior to ore pass development). This also keeps the exhaust air segregated from the ramp. An example layout of the auxiliary system on a dead-end level is provided in Figure 16.56.
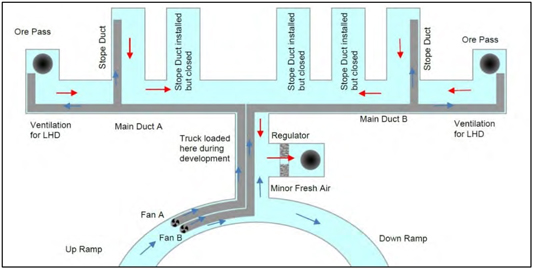
Figure 16.56: Plan of Example Dead-End Level Auxiliary Ventilation
The other configuration for a level is to have partial flow-through ventilation, where both an intake and an exhaust raise connect to the level. The intake airflow is regulated from the raise onto the level where it is drawn through one or more auxiliary ventilation systems (duct lines) to the face or stope. The exhaust regulator should be adjusted so that some air enters the level from the ramp. All air on the level should course to the exhaust raise where the air is drawn off the level. An example layout of an auxiliary ventilation system on a partial flow through level is provided in Figure 16.57.
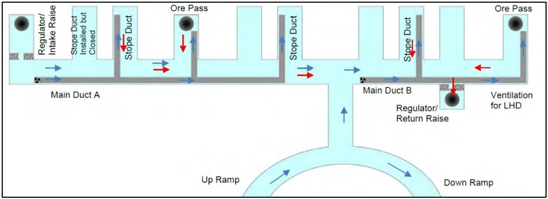
Figure 16.57: Plan of Example Partial Flow-Through Level Auxiliary Ventilation
| 16.12.6 | Staged Ventilation Models |
The equipment fleet will change during different stages of the mine life and the ventilation design for the project was divided into four separate ventilation stages of development including:
| Effective Date January 1, 2021 | Aris Gold | |||
| Page 271 of 384 |
| SRK Consulting | Soto Norte NI 43-101– Feasibility Study |
| ● | Year 03 (Figure 16.58) |
| ● | Year 06 (Figure 16.59) |
| ● | Year 11 (Figure 16.60) |
| ● | Year 14 (Figure 16.61) |
For each model, the ventilation system was set up based on the maximum number of equipment that may be in the mine during that stage. For each stage the actual number of equipment in the mine may vary, however, the maximum number of equipment for each stage was used to represent potential extreme conditions.
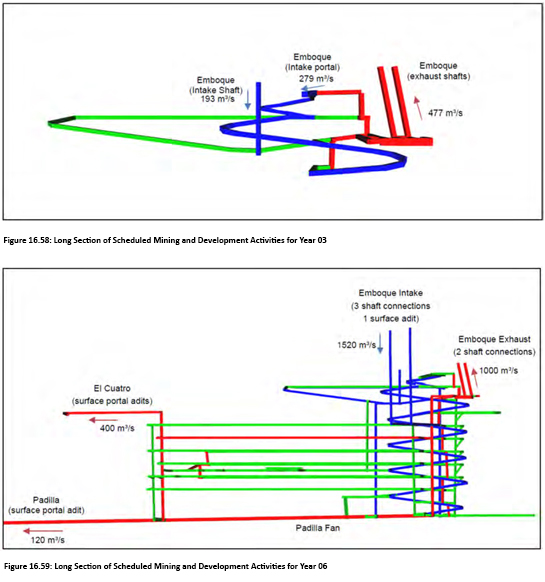
| Effective Date January 1, 2021 | Aris Gold | |||
| Page 272 of 384 |
| SRK Consulting | Soto Norte NI 43-101– Feasibility Study |
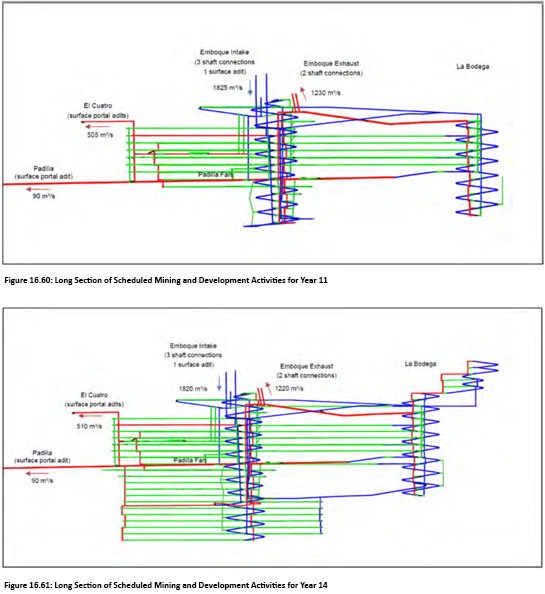
| 16.12.7 | Summary of Ventilation Approach |
The ventilation configuration of the Soto Norte Project is considered a common practice design but not best practice as it partially uses series ventilation. The ventilation system for the Project includes four main ventilation splits that each provide a fresh air source for the underground from each ramp spiral. Fixed facilities are ventilated so that all the air used in the shops and crusher dump areas is transferred directly to exhaust and away from working levels. Table 16.29 provides the planned ventilation infrastructure items and equipment in support of the Soto Norte Project ventilation design.
In the designed ventilation system, in general, exhaust air from most levels (dependent on the location of the nearest exhaust raise connection) does not reach other levels, but contaminants generated in the ramp will reach the levels. The use of exhaust raises on each level helps to reduce heat and contaminants generated on other levels. On-shift blasting in most areas is possible with this type of ventilation design. As the mine life progresses, fewer trucks are planned to be used as the conveyor and ore pass system are brought into production, resulting in cleaner and cooler air delivered to the levels. Levels without an exhaust raise connection may not be able to incorporate on-shift blasting.
Principal results of the study show that the Emboque intake portal should be used as the primary escape.
| Effective Date January 1, 2021 | Aris Gold | |||
| Page 273 of 384 |
| SRK Consulting | Soto Norte NI 43-101– Feasibility Study |
The Padilla TBM drive is in exhausting air and should be used for secondary egress. Due to the length of the TBM tunnel and depending upon the exact location of a potential fire, it could be difficult to escape once smoke enters the airway. The construction of refuge stations, approximately every 2,000 m along the TBM tunnel, will be important for the evacuation/safety of personnel working in the conveyor drift.
Table 16.29: Estimated Ventilation Infrastructure and Equipment Requirements
| Items | Units | Amount | Notes | |||||
|
Main Fans Installations | ||||||||
| Padilla Exhaust 200 kW |
ea | 1 | Main Installations can consist of more than one fan operating in parallel. | |||||
| El Cuatro Exhaust 1,800 kW |
ea | 1 | ||||||
| Emboque Exhaust 4,000 kW |
ea | 1 | ||||||
|
Auxiliary Ventilation | ||||||||
| 55 kW Fan |
ea | 43 | Auxiliary fans based on total number of equipment and multiplying utilization and duct sharing factors. | |||||
| 150 kW Fan |
ea | 10 | ||||||
| 225 kW Fan |
ea | 10 | ||||||
| 1.35 m Dia. Lay-flat Ducting |
m | 209,000 | Assume 1/2 total horizontal development x 2 for twinning the duct. | |||||
| 1.8 m Dia. Hardline Ducting |
m | 7,000 | Length per TBM Tunnel | |||||
| 1.8 m Dia. Lay-flat Ducting |
m | 300 | Assuming 150 m cassette lengths | |||||
| 1.8 m Dia. Duct Cassette |
ea | 1 | ||||||
|
Ventilation Controls | ||||||||
| Single Equipment Doors |
ea | 1 | Total number used in Year 14 model. Doors amount can change based on fan installation areas. | |||||
| Airlock Equipment Doors |
ea | 7 | ||||||
|
Bulkheads/Level Regulators |
ea | 140 | ||||||
|
Sensors | ||||||||
| Airflow, Quantity, Quality |
ea | 20 | To be placed throughout active areas and TBM tunnels. | |||||
| 16.13 | Conclusions and Recommendations |
SRK has provided significant technical support on the mining studies for Soto Norte where Minesa has provided the direction for the mining approach with additional support from third parties for integration of other technical disciplines (including TBM access, materials handling, dry thickened tailings, and backfill). Minesa has also interacted with equipment suppliers for determining unit capital and operating costs and equipment productivity/performance estimates. SRK has undertaken to review all aspects related to the mining study to determine that there is sufficient confidence in the practicality of the planned mining approach and accuracy of the cost estimate.
Further optimisation of the strategic mine plan is recommended for the next project phase that may improve project economics and overall environmental, social, and governance performance, particularly with regards to reduced trucking requirements in the nearby California municipality.
Annual review of the operational readiness plan is recommended as the Project advances through the next phases of engineering to operations.
| Effective Date January 1, 2021 | Aris Gold | |||
| Page 274 of 384 |
| SRK Consulting | Soto Norte NI 43-101– Feasibility Study |
| 17 | RECOVERY METHODS |
| 17.1 | Process Plant Overview |
No cyanide or mercury will be used to process the Soto Norte ores. The process units of the flowsheet developed to treat the Soto Norte ore are:
| ● | Crushing: Two mobile crushers will be installed underground which will primarily be used to crush ore and campaign crush waste rock as required. |
| ● | Grinding: The ore will be ground using a single stage SAG mill that will operate in closed circuit with hydrocyclones. Provision will be made for the installation of a pebble recycle and pebble crushing circuit in Year 3, if needed. |
| ● | Flotation: Sequential flotation with the following individual stages: |
| ○ | Cu rougher; feed is cyclone overflow, tails to pyrite rougher |
| ○ | Cu rougher concentrate regrind, in open circuit but with the feed scalped by hydrocyclones |
| ○ | Cu cleaner; feed is combined regrind cyclone overflow and regrind mill product, tails to Cu rougher feed |
| ○ | Cu recleaner; feed is Cu cleaner concentrate, tails to Cu concentrate regrind circuit |
| ○ | Cu Jameson cell cleaner; feed Cu recleaner concentrate; tails to Cu concentrate regrind circuit |
| ○ | Pyrite rougher, after conditioning with sodium hydrosulphide; feed Cu rougher tails, tails to final dry thickened tailings |
| ○ | Pyrite rougher concentrate regrind, in open circuit with scalping hydrocyclones; |
| ○ | Pyrite cleaner: feed is combined regrind cyclone overflow and regrind mill product, tails to pyrite rougher feed |
| ○ | Pyrite recleaner: feed is pyrite cleaner concentrate, tails to pyrite concentrate regrind circuit |
| ○ | The process aims of the flotation circuit are to produce a Cu concentrate with a grade of 16% Cu or higher, and to maximise the overall recovery of gold while restricting the non-sulphide gangue content of the concentrates to 10%. |
| ● | Dewatering: The Cu concentrate, pyrite concentrate, and final tailings will all be thickened then filtered in separate facilities. Pressure filters will be used for all streams. The flotation dry thickened tailings will be mixed with crushed waste rock and transported by conveyor to the DSF. Provision is made in the plant equipment and layout for dry filtered tailings to be returned to the mine as fill if required. |
A Process Flow Diagram for the plant is shown in Appendix B and Table 17.1 provides a mineral processing production summary.
Table 17.1: Mineral Processing Production Summary
| Production Summary | Unit | Value | ||||
|
Plant feed |
||||||
|
Length of production |
years | 10 | ||||
| tonn | ||||||
| LOM feed |
24,766,924 | |||||
| e | ||||||
| Average gold grade |
ppm | 6.22 |
| Effective Date January 1, 2021 | Aris Gold | |||
| Page 275 of 384 |
| SRK Consulting | Soto Norte NI 43-101– Feasibility Study |
| Production Summary |
Unit | Value | ||
| Average silver grade |
ppm | 34.39 | ||
| Average copper grade |
ppm | 1,884 | ||
| Copper concentrate |
||||
| tonn | ||||
| LOM concentrate production |
229,541 | |||
| e | ||||
| Average concentrate gold grade |
ppm | 300 | ||
| LOM concentrate contained fine gold |
oz. | 2,214,179 | ||
| Average concentrate silver grade |
ppm | 1,663 | ||
| Average concentrate copper grade |
% | 15.03 | ||
| Pyrite concentrate |
||||
| tonn | ||||
| LOM concentrate production |
1,989,698 | |||
| e | ||||
| Average concentrate gold grade |
ppm | 36.9 | ||
| LOM concentrate contained fine gold |
oz. | 2,360,065 | ||
| Average concentrate silver grade |
ppm | 188.5 | ||
| Total production |
||||
| LOM gold production |
M oz. | 4.57 | ||
| Average gold recovery |
% | 92.40% | ||
| Gold in copper concentrate /Gold in pyrite concentrate |
% | 48.4% / 51.6% | ||
| LOM silver production |
M oz. | 24.33 | ||
| Average silver recovery |
% | 88.90% | ||
| Silver in copper concentrate/Silver in pyrite concentrate |
% | 50.4% / 49.6% | ||
| tonn | ||||
| LOM copper production (copper concentrate only) |
e | 34,499 | ||
| 17.2 | Design Criteria |
The process plant design criteria are summarised in Table 17.2.
Table 17.2: Process Plant Design Criteria
|
Item |
Unit | Value | ||||||||||
|
Plant design capacity |
|
nominal | tpa | 2,200,000 | ||||||||
| design | tpa | 2,600,000 | ||||||||||
|
Operating days |
d/a | 365 | ||||||||||
| Crusher operating availability |
% | 75 | ||||||||||
|
Crusher operating hours |
h/a | 6,570 | ||||||||||
| Waste rock crushing requirement |
t/a | 1,400,000 | ||||||||||
| Crushing plant capacity, design |
t/h | 700 | ||||||||||
| Grinding operating availability |
% | 91.3 | ||||||||||
|
Grinding operating hours |
h/a | 8,000 | ||||||||||
| Grinding plant capacity, design |
tph | 325 | ||||||||||
|
Plant Feed grade |
Au | g/t | 6.03 | |||||||||
| Ag | g/t | 33.21 | ||||||||||
| Cu | % | 0.195 | ||||||||||
|
Recovery |
Au to Cu con | % | 36.2-54.0 | |||||||||
| Au to pyrite con | % | 40.4-55.9 | ||||||||||
| Cu to Cu con | % | 66.8-79.1 | ||||||||||
|
Ore properties |
Impact work index | kWh/t | 12.0 | |||||||||
| Rod Mill work index | kWh/t | 18.8 | ||||||||||
| Effective Date January 1, 2021 | Aris Gold | |||
| Page 276 of 384 |
| SRK Consulting | Soto Norte NI 43-101– Feasibility Study |
|
Item |
Unit | Value | ||||||
| Ball Mill work index | kWh/t | 19.0 | ||||||
| Abrasion index | - | 0.85 | ||||||
| Crushing maximum ore size |
mm | 800 | ||||||
| RoM bin capacity | t | 150 | ||||||
| Crusher type | - | Jaw | ||||||
|
Stockpile type |
- | Conical | ||||||
| total capacity | d | 3.5 | ||||||
| Feeder type, total / duty | - | Apron Feeder, 2 / 1 | ||||||
|
Grinding |
feed size (P80) | mm | 150 | |||||
| Product size(P80) | µm | 106 | ||||||
| SAG mill size | m | 7.9 x 7.9 | ||||||
| SAG mill power installed | kW | 8,000 | ||||||
| Ball load – nominal | %v/v | 15 | ||||||
| Total load – nominal | %v/v | 26 | ||||||
| Trommel rture ape | mm | 20 | ||||||
| Circulating load – pebbles | % | 18 | ||||||
| Pebble crusher size (P80) | mm | 15 | ||||||
| Circulating load – cyclones | % | 400 | ||||||
|
Cyclones Feed density |
% solids | 53 | ||||||
| Underflow ensity d | % solids | 67.8 | ||||||
| Overflow nsity de | % solids | 33 | ||||||
|
Flotation |
||||||||
|
Cu Rougher |
no of cells | 5 | ||||||
| Residence time | minutes | 20 | ||||||
|
Regrind circuit |
||||||||
| Feed rate | tph | 32 | ||||||
| Feed size(P80) | µm | 106 | ||||||
| Product size(P80) | µm | 30 | ||||||
| Regrind mill type | - | Stirred (HIG) | ||||||
| Regrind mill power – installed | kW | 700 | ||||||
| Circulating load | % | 100 | ||||||
|
Cu Cleaner |
no of cells | 5 | ||||||
| Residence time | minutes | 25 | ||||||
|
Cu Recleaner |
no of cells | 3 | ||||||
| Residence time | minutes | 15 | ||||||
|
Cu Jameson cell |
no of units | 1 | ||||||
| Residence time | minutes | 25 | ||||||
|
Pyrite Rougher |
no of cells | 5 | ||||||
| Residence time | minutes | 40 | ||||||
|
Regrind circuit |
||||||||
| Feed rate | tph | 51 | ||||||
| Feed size(P80) | µm | 106 | ||||||
| Product size(P80) | µm | 45 | ||||||
| Regrind mill type | - | Stirred (HIG) | ||||||
| Regrind mill power – installed | kW | 700 | ||||||
| Circulating load | % | 100 | ||||||
|
Pyrite Cleaner |
no of cells | 5 | ||||||
| Residence time | minutes | 30 | ||||||
| Effective Date January 1, 2021 | Aris Gold | |||
| Page 277 of 384 |
| SRK Consulting | Soto Norte NI 43-101 – Feasibility Study |
|
Item |
Unit | Value | ||||
| Pyrite Recleaner |
no of cells | 4 | ||||
| Residence time |
minutes | 25 | ||||
| Cu concentrate thickener |
number | 1 | ||||
| Feed rate |
tph | 3.7 | ||||
| Solids loading |
t/m2/h | 0.25 | ||||
| Diameter |
m | 5.0 | ||||
| Underflow ensity d |
% solids | 55 | ||||
| Cu concentrate filter |
number | 1 | ||||
| Filtration rate |
kg/m2/h | 620 | ||||
| Filter area |
m2 | 3.5 | ||||
| Pyrite concentrate thickener |
number | 1 | ||||
| Feed te ra |
tph | 23.5 | ||||
| Solids loading |
t/m2/h | 0.28 | ||||
| Diameter |
m | 10.0 | ||||
| Underflow ensity d |
% solids | 55 | ||||
| Pyrite concentrate filter |
number | 1 | ||||
| Filtration rate |
kg/m2/h | 670 | ||||
| Filter area |
m2 | 27.9 | ||||
| Tailings thickener |
number | 1 | ||||
| Feed rate |
tph | 310 | ||||
| Solids loading |
t/m2/h | 0.67 | ||||
| Diameter |
m | 24.0 | ||||
| Underflow ensity d |
% solids | 55 | ||||
| Tailings pressure filter |
number | 3 | ||||
| Filtration rate |
kg/m2/h | 240-320 | ||||
| Reagents |
||||||
| Quicklime |
kg/t RoM | 2.5 | ||||
| Flocculant addition |
||||||
| Concentrate hickener t |
g/t feed |
30 | ||||
| Tailings r thickene |
g/t feed |
30 | ||||
| Collector addition – Cu |
g/t RoM | 17.5 | ||||
| Collector addition – pyrite |
g/t RoM | 135 | ||||
| Frother addition |
g/t RoM | 25 | ||||
| NaHS addition |
g/t RoM | 200 | ||||
| Dispersant addition |
g/t RoM | 105 | ||||
| SAG Mill media addition |
kg/t RoM | 2.87 | ||||
| Regrind mill media addition |
kg/t RoM | 0.30 |
| 17.3 | Detailed Description |
| 17.3.1 | Primary Crushing and Ore Transfer to Surface |
The primary (mobile) crushers will be located within the mine area; ore will be withdrawn from the discharge vault by a variable speed apron feeder and transferred to the primary crusher sacrificial conveyor, which discharges onto the underground tunnel conveyor.
The tunnel conveyor provides the most direct and cost-effective route through the underground mine to transport ore from the primary crushing station to the crushed ore stockpile at the plant facilities. The crushed ore transfer conveyor tunnel will have an arch roof with a top of radius of 3.9 m and a finished cross
| Effective Date January 1, 2021 | Aris Gold | |||
| Page 278 of 384 |
| SRK Consulting | Soto Norte NI 43-101– Feasibility Study |
circular section 7.8 m wide at the centre and 6.7 m high at the top of the arch.
The underground tunnel conveyor transports ore to the surface and discharges onto the coarse ore stockpile (“COS”).
| 17.3.2 | Coarse Ore Stockpile and Reclaim |
The coarse ore from the primary crusher will feed a single conical, uncovered stockpile, which has a live capacity of approximately 6,600 t. The stockpile provides surge capacity between the primary crushing circuit and the downstream processing plant. The live stockpile capacity provides approximately 24 hours of mill feed capacity. The dead capacity is equivalent to about three more days of feed, and this can be recovered using equipment such as a bulldozer or front-end loader.
Coarse ore will be reclaimed from the stockpile by two apron feeders, each capable of delivering the full design feed rate, which will be fitted with variable-speed drives. A spray water dust suppression system is considered for dust generated at the processing stockpile feed conveyor discharge point as well as the apron feeder discharge points.
The apron feeders will discharge onto the SAG mill feed conveyor, which will transport the crushed ore to the SAG mill feed chute. The SAG mill feed conveyor will be fitted with a weightometer to measure new feed rate to the SAG mills for process control and metallurgical accounting.
SAG mill grinding media will be added to the SAG mill feed conveyor by a front-end loader that will load balls into a hopper located over the SAG mill feed conveyor. There will be ball storage and a ball charging system for the SAG mill.
| 17.3.3 | Grinding and Pebble Recycle |
The grinding circuit consists of a single stage SAG mill operating with a primary cyclone cluster in closed circuit. The product from the grinding circuit (primary cyclone cluster overflow) will have a typical size of 80% passing 106 µm, with a density between 30% and 35% w/w solids.
Ore withdrawn from the stockpile will discharge from the SAG mill feed conveyor into the SAG mill feed chute. A belt weigh scale will be installed on the SAG mill feed conveyor and will be used to measure new ore feed rate and control the water addition to a fixed ratio with the solids entering the SAG mill. The water will be added at the head end of the mill feed chute to assist the material flow into the mill.
The SAG mill feed conveyor will transfer ore and grinding media (and crushed pebbles possibly starting on the third year of operation) to the SAG mill feed chute where it will be combined with mill feed dilution water and lime slurry to increase the slurry pH to approximately 9.0.
The SAG mill will be fitted with a single pinion, a liquid resistance starter (“LRS”), and discharge grates to retain grinding media while allowing smaller particles to discharge from the mill. The SAG mill will be fitted with a trommel screen to separate slurry and coarse, unbroken rocks.
If the need for a pebble crushing system is confirmed with plant throughput trials, the SAG mill will be retrofitted with discharge grates containing pebble ports to discharge from the mill, and therefore feed the pebble crushing circuit. In this case, the pebbles in the trommel oversize from the SAG mill will report to a surge bin and pebble crusher via the pebble crusher feed conveyor.
A self-cleaning electro-magnet will be installed over the pebble crusher feed conveyor belt to remove any
| Effective Date January 1, 2021 | Aris Gold | |||
| Page 279 of 384 |
| SRK Consulting | Soto Norte NI 43-101 – Feasibility Study |
metal present that could damage the pebble crusher. A metal detector will be installed downstream of the electro-magnet to detect any remaining metal on the belt. If metal is detected, a gate in the conveyor head chute changes position and the stream containing the metal is directed away from the pebble surge bin and the downstream pebble crusher. This gate can also be used to purge pebbles from the circuit into a pebble bunker if the recirculating load becomes too large. When the crusher is on maintenance, the gate in the pebble crusher feed conveyor head chute changes position to allow pebbles to by-pass the pebble crusher.
SAG mill trommel undersize will gravitate to the primary cyclone feed hopper, which uses a variable speed cyclone feed pump to feed slurry to the cyclone cluster. A spare feed pump wet end is available for quick repairs in the case of a pump failure. The cyclone overflow stream will gravitate to the copper flotation circuit via cross-stream samplers and boil boxes while the cyclone underflow stream reports back to the SAG mill.
| 17.3.4 | Copper and Pyrite Flotation |
The flotation circuit will consist of two stages: one for producing copper concentrate and one for producing pyrite concentrate, both with high gold grade. The copper rougher flotation is followed by rougher concentrate regrind and three stages of cleaner flotation to produce a copper concentrate with high gold grade. The pyrite flotation circuit will condition copper rougher tailings in one conditioning tank followed by pyrite rougher flotation, concentrate regrind and two stages of cleaner flotation.
Copper Rougher Flotation
Primary cyclone overflow will report directly to the copper rougher flotation collection box and, along with cleaner tailings and On-Stream Analyser (“OSA”) sample return, will feed the rougher flotation circuit consisting of five 70 m3 forced air mechanical flotation tank cells.
Lime will be added to the copper rougher collection box to increase the pH to 10.5. Frother and copper collector will also be added in this collection box. Lime slurry can also be added to the second rougher cell to maintain the target pH, if needed. Frother and collector can be added at the individual rougher cells as necessary for stage performance control.
The rougher flotation cells produce a low-grade copper concentrate that will be pumped to the copper concentrate regrind circuit for further liberation before reporting to the copper cleaning circuit for upgrading. The rougher concentrate will be pumped to the regrind mill cyclone feed tank. The copper rougher tailings will be pumped to the pyrite conditioning tank prior to pyrite flotation circuit.
Copper Concentrate Regrind
The regrind circuit consists of a single vertical regrind mill HIGmill® running in open circuit with a classifying system using hydrocyclones. The main purpose of this stage prior to the cleaner flotation circuit is to improve copper liberation and recovery by grinding rougher concentrate to a finer granulometry.
Copper rougher concentrate, Copper recleaner tailings, lime slurry and OSA sample return are the fresh feed to the regrind mill cyclone feed tank. A variable speed cyclone feed pump transports slurry to the regrind mill cyclone cluster. Fine particles in the cyclone overflow that do not require further grinding report by gravity to the regrind discharge hopper to produce a 30 µm stream; the cyclone underflow reports to the regrind mill feed hopper. The cyclone underflow stream flows by gravity to the regrind mill feed hopper.
Grinding media for the copper regrind mill will be hoisted up to the regrind media feed hopper and metered into the regrind mill feed hopper by the regrind mill grinding media feeder.
| Effective Date January 1, 2021 | Aris Gold | |||
| Page 280 of 384 |
| SRK Consulting | Soto Norte NI 43 -101 – Feasibility Study |
Copper Cleaner Flotation
Regrind product will report to the cleaning flotation circuit, which consists of three stages: the first stage (cleaner) consists of forced air mechanical flotation tank cells, the second stage (recleaner) consist of forced air rectangular cells and the third stage is a Jameson cell. Cleaner flotation consists of five 10 m3 forced air tank cells, recleaner flotation consists of three 3 m3 forced air rectangular cells and the tertiary cleaner cell consists of a single Z1200 Jameson cell.
Regrind circuit products feed the cleaner circuit via the regrind mill cyclone overflow pump and report to the cleaner feed box. The cleaner concentrate is pumped to the recleaner flotation cells. The cleaner tailings are pumped back to the rougher flotation feed.
The cleaner concentrate is combined with tertiary cleaner tailings and the OSA sample return in the recleaner feed box. The recleaner concentrate is directed to the tertiary cleaner, the recleaner tailings are pumped back to the copper regrind circuit.
Recleaner concentrate is combined with the Jameson cell tailings internal recycle stream in the Jameson cell feed box and pumped into the cell via a set of downcomers. The tertiary cleaner produces a concentrate (around 16% Cu) that flows by gravity to the final concentrate hopper where it is pumped to the copper concentrate thickener. The tailings flow by gravity back to the recleaner stage.
Pyrite Rougher Flotation
Copper rougher tailings and pyrite cleaner tailings are fed to the pyrite conditioning tank to produce the pyrite rougher flotation feed. The pyrite conditioning tank overflows to the rougher flotation circuit consisting of five forced air mechanical flotation tank cells of 150 m3 capacity each.
Slurry pH is between pH 5.5 and 7 due to the addition of NaHS and pyrite collector at the head of the rougher train.
The rougher flotation cells will produce a low-grade pyrite concentrate that requires further liberation and upgrading, thus the rougher concentrate is pumped to the pyrite regrind mill cyclone feed tank and the rougher tailings report to the tailings thickener.
Pyrite Concentrate Regrind
The regrind circuit consists of a classification system (using hydrocyclones) and a single regrind vertical mill. Pyrite rougher concentrate, pyrite recleaner tailings and OSA sample return are fresh feed to the regrind mill cyclone feed tank. A variable speed cyclone feed pump transports slurry to the regrind mill cyclone cluster.
Fine particles that do not require further grinding report to the cyclone overflow stream that gravitates to the pyrite regrind discharge hopper to produce a 45 mm stream. The cyclone underflow stream flows by gravity to the regrind mill feed hopper.
Pyrite Cleaning Flotation
Regrind circuit cyclone overflow and reground product will report to the cleaning flotation stage, which consists of cleaner and recleaner stages with forced air mechanical flotation tank cells. Cleaner flotation consists of five 20 m3 capacity cells to produce a concentrate that reports to the recleaner flotation cells. The pyrite cleaner tailings are pumped back to the pyrite conditioning tank.
| Effective Date January 1, 2021 | Aris Gold | |||
| Page 281 of 384 |
| SRK Consulting | Soto Norte NI 43-101 – Feasibility Study |
Recleaner flotation consists of four 10 m3 cells. The recleaner concentrate is directed to the pyrite concentrate thickener and recleaner tailings are pumped back to the pyrite regrind circuit.
| 17.3.5 | Concentrate Dewatering, Storage and Load Out |
Copper Concentrate
The concentrate dewatering circuit consists of a single high-rate thickener and a vertical pressure filter. Copper concentrate will be fed to the concentrate thickener feed box through a metallurgical sampler.
The copper concentrate thickener overflow will report to the copper process water tank. Copper concentrate solids will be thickened to an operating density of 55% to 60% w/w solids. The thickener underflow stream will be pumped to an agitated filter feed tank by dedicated pumps.
The copper filter feed tank provides 24 hours surge capacity allowing filter maintenance to be conducted without causing mill downtime. Thickened copper concentrate will be pumped to the copper concentrate filter to produce a filter cake of 9% w/w moisture.
The copper concentrate filter cake drops into the copper concentrate surge bin and feeds onto the copper concentrate belt feeder, which loads the filter cake directly into a load out system consisting of motorised container carts for copper concentrate transport in and out of the load out area. Loading progress will be monitored by a conveyor weightometer and prior to load out, a concentrate sample is taken by a rotary sample collector, which gathers representative samples for concentrate assays, quality control, and commercial reconciliation purposes.
Pyrite Concentrate
The pyrite concentrate dewatering circuit consists of a high-rate thickener and a horizontal pressure filter. Pyrite concentrate will be fed to the concentrate thickener feed box through a metallurgical sampler. Pyrite concentrate filtrate will also be fed to the pyrite concentrate thickener.
The pyrite concentrate thickener overflow will report to the pyrite process water tank and, combined with the tailings thickener overflow, will provide pyrite process water to the remainder of the plant outside the copper recovery circuit. Pyrite concentrate solids will be thickened to an operating density of 55% to 60 % w/w solids. The thickener underflow stream will be pumped to an agitated pyrite filter feed tank by dedicated pumps.
The pyrite filter feed tank provides 12 hours surge capacity allowing filter maintenance to be conducted without causing mill downtime. The thickened pyrite concentrate is pumped to the pyrite concentrate filter to produce a filter cake of 9% w/w moisture. Pyrite process water will be used at the thickener for froth suppression sprays and to flush filter manifolds. Raw water will be used for filter cloth washing and for flocculant dilution for the thickener.
Similar to copper concentrate load out, the pyrite concentrate filter cake drops into the pyrite concentrate surge bin and feeds onto the pyrite concentrate belt feeder, which loads the filter cake directly into a load out system consisting of motorised container carts for pyrite concentrate transport in and out of the load out area. The concentrate loading progress will be monitored by a conveyor weightometer.
Prior to load out, a concentrate sample is taken by a rotary sample collector, which gathers representative samples for concentrate assays, quality control of pyrite production, and commercial reconciliation purposes.
| Effective Date January 1, 2021 | Aris Gold | |||
| Page 282 of 384 |
| SRK Consulting | Soto Norte NI 43-101 – Feasibility Study |
| 17.3.6 | Thickened Tailings Dewatering and Disposal |
The tailings thickening circuit consists of a tailings thickener feed box and a high rate thickener to thicken final tailings to 55% to 60% w/w solids in preparation for tailings filtration and to recover process water to be returned for use in the process plant.
Tailings filtrate return and spillage from reagent preparation facilities will be added to the thickener feed box. Tailings thickener overflow will report to the tailings thickener overflow tank prior to being pumped to the pyrite process water tank. The thickened underflow will be pumped to the tailings filtration feed tanks and distributed proportionally by the tailings filter feed distribution box to the tanks.
Thickened tailings will be pumped to a tailings distribution box, which distributes the slurry to three agitated filter feed tanks. Each filter feed tank provides 5 hours surge capacity allowing filter maintenance without causing mill downtime. Other factors are the large thickener capacity and the low filter availability. Each filter feed tank is capable of supplying slurry to each horizontal pressure filter via the filter feed pumps. A spare feed pump wet end is available for quick repairs in the case of a pump failure.
The tailings filtration design requires two filters to be in operation during nominal conditions with an availability of 75%, and the operational availability could be increased up to 90% when the three filters are needed during design conditions.
Filter cake from each filter discharges into a single belt feeder via a set of bomb bay doors. The belt feeders operate continuously but at a lower rate to deliver batches of filter cake to the downstream conveyor over the full cycle time of the filter. The tailings/waste conveyor receives dried filtered tailings and mine waste rock from the discharge feeders for transportation to the DSF, where the dry thickened tailings are placed and compacted. Figure 18.2 shows a plan view of the tailings thickening and filtration area.
| 17.3.7 | Reagents and Consumables |
Separate mixing and storage tanks will be provided for reagents that require mixing in order to ensure consistency of reagent strength. Reagents will include lime as the pH modifier, copper and pyrite flotation collectors, frothers and flocculants. Dosing rates have been estimated for each of the reagents based on the metallurgical testwork consumption rates. A hydrated lime preparation plant has been included in the design to prepare hydrated lime slurry at 20 %w/w solids.
Table 17.3 provides the applicable consumption rates for process reagents and consumables and Table
17.4 provides annual replacement rates for other process consumables.
Table 17.3: Process Reagents and Consumables Consumption Rates
| Reagent | Consumption (g/t) | |||
| Quicklime (pH modifies) | 2500 | |||
| AP- 7290 (copper collector) | 18 | |||
| MIBC (Frother) | 25 | |||
| PAX (pyrite collector) | 135 | |||
| NAHS (pyrite activator) | 200 | |||
| Calgon (gangue depressant) | 105 | |||
| Flocculant (concentrate thickeners) | 30 | |||
| Flocculant (tailings thickener) | 30 | |||
| Consumables | Consumption (g/t) | |||
| SAG Mill Media | 2,009 | |||
| Regrind Mill Media Cu | 8 | |||
| Regrind Mill Media Py | 8 |
| Effective Date January 1, 2021 | Aris Gold | |||
| Page 283 of 384 |
| SRK Consulting | Soto Norte NI 43-101 – Feasibility Study |
Table 17.4: Annual Replacement Rates for Other Consumables
| Other Consumables | Changes/annum | |||
| Upper Cheek | 1.33 | |||
| Lower Cheek | 1.33 | |||
| Jaw Plate | 1.33 | |||
| Metal Liners and Hardware | 1.33 | |||
| Discharge end trunnion liner | 1.33 | |||
| Miscellaneous | 1.00 | |||
| Primary Cyclones | 1.00 | |||
| Flotation Cells | 1.00 | |||
| Copper Regrind Liner | 1.00 | |||
| Pyrite Regrind liner | 1.00 | |||
| AISE Valve Complete Assembly | 1.00 | |||
| Filter Cloth Cu | 1.00 | |||
| Filter Cloth Py | 1.00 | |||
| Filter Cloth Tailings | 1.00 |
| 17.3.8 | Process Plant Support Facilities and Utilities |
Raw, Process and Potable Water Distribution
Raw Water (Treated Water)
Raw water is the product from the Water Treatment Plant (“WTP”). Run-off water from DSF collection pond, mine dewatering water and process water bleed streams are pumped to the WTP, where each stream is treated separately, according to the final specification. The treated water is distributed to fire/raw water tank and mine services (depending on process requirement), and the excess is discharged to the Surata River.
Water usage for the Project was established for both construction and operation phases, as average and maximum flows. Water intake and discharge permits were included in the ESIA report and are listed in Table 17.5 and Table 17.6 respectively.
Table 17.5: Summary of Water Intake Permits (Source: ESIA, 2019)
| Location
|
Construction
|
Operation
|
Permitted Flow
|
|||||||||
| Avg . Flow (I/s)
|
Max. Flow (I/s)
|
Avg. Flow (I/s)
|
Max. Flow (I/s)
|
|||||||||
| Suratá River | 26.2 | 27.5 | 6.7 | 8 | 27 .5 | |||||||
| La Baja Stream | 10 | 10 | - | - | 10 | |||||||
| San Juan Stream | 2 | 2 | 2 | 2 | 2 | |||||||
| San Antonio Stream | 0.5 | 0.5 | 0.5 | 0.5 | 0.5 | |||||||
| UG Mine and Tunnel | 179.6 | 354.4 | 142.5 | 176.2 | 354.4 | |||||||
Table 17.6: Summary of Water Discharge Permits (Source: ESIA, 2019)
| Location | Discharge Point | Construction Avg. Flow (I/s) |
Construction Max. Flow(I/s) |
Operation Avg. Flow (I/s) |
Operation Max. Flow(I/s) |
Permitted Flow(I/s) |
Type of Discharge (All Treated) | |||||||||
| Suratá River |
V1 | 3 | 4 | 3 | 4 | 4 | Sewage | |||||||||
| Suratá River | V2 | 27 | 43.4 | — | — | 32.4 | TBM tunnel construction | |||||||||
| Suratá River | V3 | 3 | 8.4 | 157.1 | 217.5 | 354. 4 | Mine, DSF and processing plant water | |||||||||
| La Baja Stream |
V4 | 154 | 314.8 | — | — | 314.8 | Mine water | |||||||||
| La Baja Stream |
V5 | — | — | 69 | 69 | 69 | Mine water to compensate environmental flow in La Baja | |||||||||
| La Baja Stream |
V6 | 1 | 1 | 1 | 1 | 1 | Sewage |
| Effective Date January 1, 2021 | Aris Gold | |||
| Page 284 of 384 |
| SRK Consulting | Soto Norte NI 43-101– Feasibility Study |
The plant raw water tank serves as a combined raw water/fire water storage tank with the lower section dedicated for fire water service and the remainder available for general process plant use. From the water balance during plant operations, the average plant water requirement is 219.2 l/s of which 206.7 l/s is sourced from water recycled from the dewatering circuits and 12.4 l/s from raw water. Raw water will be used to supply the following services:
| • | Process plant clean water and make-up water requirements |
| • | Gland seal water |
| • | Fire suppression water. |
Process Water
Considering the chemical conditions of each processing branch (pH and specific collector presence in each circuit), two separate process water circuits have been considered as follows:
| • | Copper Process Water: Copper process water consists of copper concentrate thickener overflow and raw water make-up and is used to supply the process water needs for the copper flotation, regrinding and dewatering circuits. |
| • | Pyrite Process Water: Pyrite process water consists of pyrite concentrate thickener overflow and final tailings thickener overflow and is used to supply process water to the rest of the process plant. If there is excess pyrite process water, this will require treatment before release to the environment. The excess pyrite process water is sent to the WTP. |
Potable Water Treatment and Distribution
Potable water will be supplied from the potable water treatment plant, located at the permanent camp, to the potable process plant safety shower system. water tank that provides storage capacity for 48 hours. Potable water is distributed for general use and supplies the
Water Treatment Plant
Water from mine dewatering, seepage from the DSF pond and excess water are pumped to the WTP, where each stream is treated separately. Contact water from the RoM stockpile (see Section 17.3.1 for ROM stockpile details) and waste rock platforms are gravity fed to the WTP. Water from the DSF is potentially acidic and may require treatment with lime prior to release or use in the process plant.
No detail design of the acidic water treatment has been completed, however, quotes received for the WTP envision that the acidic water treatment plant will consist of a divider tank (shipping container with welded baffled) that will be used to separate oils and solids, followed by a lime dosing tank with dosing pump and two agitated mine water treatment tanks arranged in series. Lime slurry will be added to the water treatment tanks to increase the pH and precipitate heavy metals. This design is based on water quality assumptions; further field investigation will be conducted in the next phase.
The treated water could either be released to the environment or reused as process plant makeup water, depending on the water balance. Precipitates formed will settle and will be dewatered in order to be handled as required by operations.
17.3.9 Air Services
| Effective Date January 1, 2021 | Aris Gold | |||
| Page 285 of 384 |
| SRK Consulting | Soto Norte NI 43-101 – Feasibility Study |
Low pressure air for the copper and pyrite flotation circuit is supplied by three blowers operating as two duty and one stand-by. The rougher cells and cleaner cells operate at different air pressures. Air pressure to the copper cleaner cells is reduced to the required pressure via an inline pressure control valve.
Three air compressors (two duty and one stand-by) will provide high pressure air for plant instruments and general service points. Compressed air for plant instruments is dried and filtered to instrument air quality prior to storage in instrument air receivers and distribution.
Details of plant energy requirements and available supply can be found in Section 18.3.
17.4 Conclusions and Recommendations
SRK recommends that the first phase of detailed design should be a gap analysis and basic engineering work to review the Ausenco redesign and address any gaps that must be resolved before moving forward with the detailed engineering phase.
SRK notes that the target grade for the Cu concentrate, 16% Cu, is low by benchmark standards. This figure was selected by Minesa based on testwork results as well as considerations for maximising gold in copper concentrate and reducing penalty element concentration. The Cu concentrate, as it is currently understood, also contains quantities of several penalty elements that will exceed typical penalty limits, notably As, but also Bi, Cd, Sb, and probably Zn. The high arsenic level in particular will prevent this material being imported to China as a copper concentrate, except for a small number of smelters who are licenced to import such material. Otherwise, this material could be imported into China by designating it as a precious metal (“PM”) concentrate. Such concentrates are subject to less rigorous impurity specifications as Cu concentrates.
Minesa conducted a trade-off study at the commencement of the 2017 PFS and concluded that producing a separate copper concentrate was economically justified as the contained copper value, even at 16% Cu, would far exceed the potential penalties paid for deleterious elements (As, Sb, Bi, etc).
The proposed comminution circuit consists of a single stage SAG mill operating in closed circuit with cyclones, with the provision for a recycle crusher to crush pebbles, on the expectation that they at some stage will be produced in excessive quantities. SRK notes that such a circuit contains an inherent compromise:
| • | Close circuiting a SAG mill with cyclones produces a finer product size than an open circuit mill, but at the cost of a reduction in throughput |
| • | Adding a pebble crusher to a SAG mill is typically employed as a means of increasing throughout; however, it is always associated with a coarser product size from the mill. |
SRK notes that the intention is for the plant to operate initially without the pebble crusher, with suitable layout provision to incorporate the recycle circuit should such be considered necessary to seek to maintain the process objectives.
In addition, a single stage SAG mill typically produces a flatter particle size distribution than, for example, a SAG mill followed by a ball mill, that is, a greater proportion of fine sized material at the same P80. Hence, the flotation response of the ore may be different that that achieved under laboratory conditions, where typical sample preparation procedures tend to mirror the particle size distribution produced as a result of two stage grinding.
| Effective Date January 1, 2021 | Aris Gold | |||
| Page 286 of 384 |
| SRK Consulting | Soto Norte NI 43-101 – Feasibility Study |
SRK understands that the selection of a single stage SAG mill was made on the basis of assumptions including a reduced plant footprint requirement and a reduced capital cost for the milling circuit. While acknowledging this, SRK believes that the inherent operational difficulties presented by a single stage SAG mill operating in closed circuit both with a coarse (pebble crusher) and fine (hydrocyclones) recycle streams, in addition to impact of the variability in tonnage and grind size that such a circuit is likely to produce on the process units downstream of the comminution circuit, should be considered in more detail. SRK notes that the mill will be fitted with a variable speed drive, however, in order to minimise the negative impact of the high design circulating load at potentially low load levels, SRK recommends that the SAG mill is fitted with a twin chamber pulp lifter (Outotec Turbo Pulp Lifter or similar) to maximise the mill’s discharge efficiency.
| Effective Date January 1, 2021 | Aris Gold | |||
| Page 287 of 384 |
| SRK Consulting | Soto Norte NI 43-101 – Feasibility Study |
18 PROJECT INFRASTRUCTURE
18.1 Introduction
The mining and processing operations are supported by on-site project infrastructure and services.
There are two principal areas of operation on site: Padilla and Emboque. Padilla is located near the municipality of Suratá and comprises the camp area, processing plant, dry filtered tailings facility, operation laydown, box cut and main utility facilities (fuel, concrete, emulsion, potable water and sewage plant). Emboque is the mining area, consisting of ventilation terraces, access roads and tunnel access.
The sites of Padilla and Emboque are separated by a straight distance of approximately 9 km or 13 km by road. Figure 18.1 shows the general layout of each area with the associated infrastructure. Figure 18.2 and Figure 18.3 provide more detail around the Padilla Process facilities (including boxcut for the TBM underground access) and Emboque, respectively.
The following sections provides a summary of the on-site and off-site infrastructure and product logistics (bulk power supply, export logistics operations).
| Effective Date January 1, 2021 | Aris Gold | |||
| Page 288 of 384 |
| SRK Consulting | Soto Norte NI 43-101 – Feasibility Study |
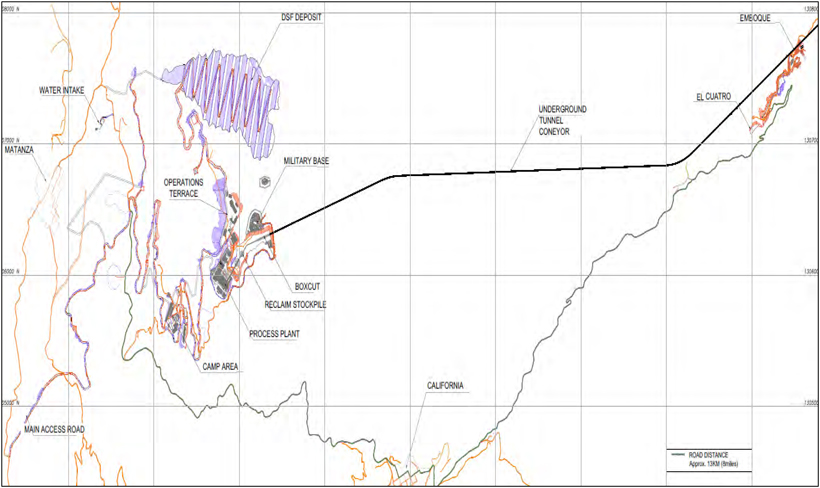
Figure 18.1: Plan of Padilla and Emboque General Layout
| Effective Date January 1, 2021 | Aris Gold | |||
| Page 289 of 384 |
| SRK Consulting | Soto Norte NI 43-101 – Feasibility Study |
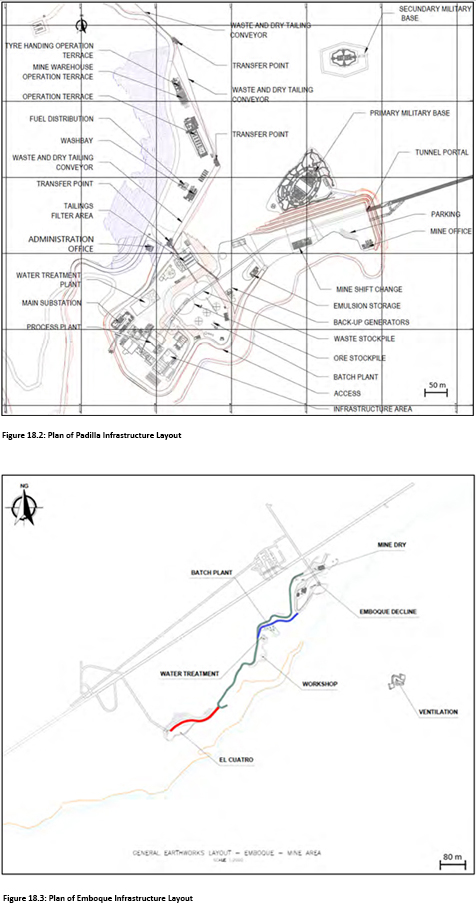
| Effective Date January 1, 2021 | Aris Gold | |||
| Page 290 of 384 |
| SRK Consulting | Soto Norte NI 43-101 – Feasibility Study |
| 18.1.1 | Base Surveys and Design Criteria |
Topography
The Project obtained and utilised a LiDAR dataset to inform the earthworks and other designs, which is appropriate for the level of study. The LiDAR dataset set comprised some historical data which was acquired by the Project and then flew site specific survey to cover the remaining area of interest. The co-ordinate reference system used to develop the engineering is Magna Sirgas Colombia with origin Bogota, EPSG 3116. During the construction, the selected contractor will be responsible to undertake detailed ground surveys before, during and at the completion of construction.
Design Criteria
The design of the facilities was dictated by the location of the site general topography, and to minimise the mine footprint, therefore local building and civil engineering design standards have been used as a basis for design criteria. A summary of the design parameters and criteria are provided below.
Roads: All roads throughout the Padilla site are divided into three categories: haulage roads, access roads, and service roads. The geometrical design parameters and criteria are provided in Table 18.1.
Table 18.1: Road Design Parameters and Criteria
|
Item
|
Description
|
|||
| Main roads design vehicle |
C3S2 According to INVIAS design manual |
|||
| Internal roads design vehicle |
C3 According to INVIAS design manual |
|||
| Design Speed |
20 to 30 km/h |
|||
| Minimum horizontal ratio curves |
20 m |
|||
| Percentage camber |
N.A. |
|||
| Road width |
6 to 13 m |
|||
| Lane transversal slope |
2% |
|||
| Road longitudinal slope |
0 to 13% |
|||
| Vertical curvature type |
Symmetrical |
|||
| Minimum vertical curve length |
20 m |
|||
| Surface Finishing |
Road 1.1 - Asphalt pavement, chip seal and gravel on all other roads |
Terrace: The distribution, location and sizing of the terrace has been determined considering construction and operational requirements.
Buildings: All buildings designed based on “Reglamento Colombiano de Construccion Sismo Resistente -NSR 10”, latest version.
Bridge: The bridge proposed over the Vetas River, has been pre-dimensioned considering the INVIAS criteria and the requirements of the Current Regulations, Colombian Bridge Design Standard CCP-14.
Stability: Minimum factors of safety were derived from item H.5.2.7 from NSR-10, which are presented in Table 18.2. The minimum safety factors used for slope stability analysis of the DSF are shown in Table 18.3.
| Effective Date January 1, 2021 | Aris Gold | |||
| Page 291 of 384 |
| SRK Consulting | Soto Norte NI 43-101 – Feasibility Study |
Table 18.2: Minimum Safety Factors Required for Slope Stability
| Conditions | Minimum Required Safety Factors | |||
| Static |
1.5 | |||
| Pseudo-static |
1.05 |
Table 18.3: Minimum Safety Factors Required for DSF Stability
| Load Conditions | Minimum Safety Factor Required | |||
| End of construction |
1.3 | |||
| Long term (steady state seepage) |
1.5 | |||
| Rapid drawdown |
N/A | |||
| Pseudo-static |
1.0 | |||
| Post-earthquake |
1.2 |
| 18.2 | On-site Infrastructure |
| 18.2.1 | Box-Cut |
In order to establish access to the incline portals at Padilla, a box cut will be excavated using traditional drill and blast methods. The soil at the box cut will be removed to a depth where competent rock is exposed and is considered stable enough to support tunnel development.
It is envisaged that rock-bolting will be required in the upper sections, due to the anticipated poor condition of the bedrock. Lattice girder with spiling bars and shotcrete will be used for the first 70 m of tunnelling. From that point on, a TBM will be utilised.
The incline portal will ultimately be the lifeline of the operation and will house the conveying systems required for removing ore and waste rock from the mine, as well as returning backfill. A military base will be constructed on a development platform above the box-cut.
| 18.2.2 | Terraces |
A series of terraces are to be constructed to support the installation of infrastructure site wide. Consideration has been given to best balance the excavation and embankment volumes. A summary of the volume of cut and fill and resulting balance is presented in Table 18.4.
Table 18.4: Cut and Fill Volume Balance
| Construction Item | Total Cut Volume (m3) | Total Fill Volume (m3) | ||||
| DSF phase 1 | - | 620,701 | ||||
| DSF phase 2 | 49,143 | 805,087 | ||||
| Operations terrace | 102,111 | 893,002 | ||||
| Plant & box cut | 1,489,171 | 2,591 | ||||
| Padilla | 335,316 | 39,495 | ||||
| Emboque | 38,028 | 63,255 | ||||
| Roads | 697,319 | 218,400 | ||||
| Total | 2,711,087 | 2,642,535 |
| Effective Date January 1, 2021 | Aris Gold | |||
| Page 292 of 384 |
| SRK Consulting | Soto Norte NI 43-101 – Feasibility Study |
| 18.2.3 | Roads and Bridges |
Materials and consumables will be transported to the site using the existing road to Suratá. The new site access road will link the Padilla Plant-site with the existing Matanza to Suratá secondary road at the site known as Puente Panaga.
Roads
All roads throughout the Padilla site are divided into three categories: haulage roads, access roads and service roads. There are two “main” roads; the DSF haul road (1.7 km) and the main access road (8.8 km) between Padilla and the national road system. The DSF haul road will facilitate the installation of a conveying system from the Filter Plant to the DSF and allow access to the DSF for the 45 t articulated dump trucks that will be operating there. The main access road will be used to transport materials and consumables to site. This road will link the Padilla Plant- site with the existing Matanza to Suratá secondary road.
The remaining roads are service roads for a total length of 5.4 km. These roads correspond to those where access is required to different infrastructure sites throughout the Project, connecting different platforms or service terraces.
Road widths vary and are generally between 6 and 8 m. The maximum slopes reach 16% for some access roads. The main access road, which is numbered as “Road 1.1” also includes a 32 m long, 10 m wide bridge with a pre-stressed concrete deck and abutments on piled foundations.
Bridge
The Bridge crossing the Vetas River is on road 1.1 at station K1+260. It is 32 m in length and 10 m wide, including a pedestrian lane. The road is sloped at 2.8% along the length of the bridge. This bridge will be built on the main access road to the project, to allow vehicles to avoid passing through the town of Suratá.
Culverts
The road drainage design is based on recommendations included in the “Manual técnico de drenajes para carreteras del INVIAS”. The following work types have been defined:
| ● | Lineal works: ditches and channels |
| ● | Transversal works: 36” culverts and box culverts. |
| 18.2.4 | Camp |
The camp area (Figure 18.4) comprises four terrace platforms, namely:
| ● | Camp area including: |
| ○ | Accommodation blocks |
| ○ | Kitchen |
| ○ | Laundry |
| ○ | Recreation facilities. |
| ● | Potable water treatment plant. |
| Effective Date January 1, 2021 | Aris Gold | |||
| Page 293 of 384 |
| SRK Consulting | Soto Norte NI 43-101 – Feasibility Study |
| ● | Waste management facility. |
| ● | Sewerage treatment plant. |
There are plans to provide 1,100 beds for the construction phase through continued usage of existing camp facilities and construction of an additional 750 beds. The camp is self-contained with rooms plus amenities and dining hall.
The sewerage treatment plant and waste management facility are located northwest of the camp.
The maximum workforce is estimated to reach approximately 1,800 persons during construction (see Table 24.2) and 940 during operations (see Table 24.3). Minesa has used a census of labour resources coupled with the labour resources schedule and accommodation study in 2018 to anticipate requirements for the construction camp, which can accommodate around 50% of these people. The remainder of labour is anticipated to be fulfilled by the Soto Norte area and thus would reside locally.
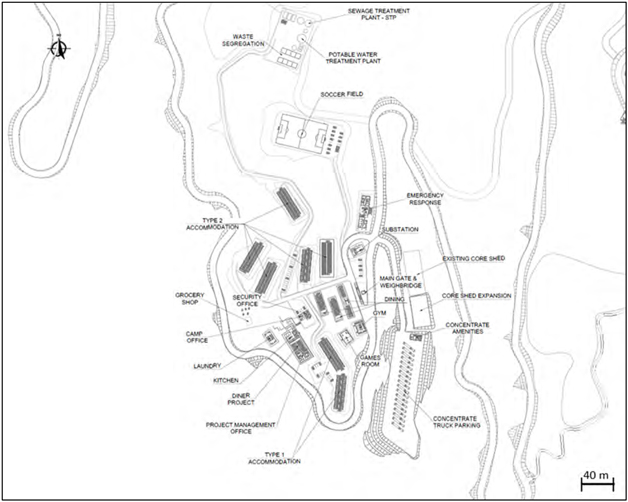
Figure 18.4: Plan of Padilla Camp Area
| 18.2.5 | Infrastructure and Utilities |
Accommodation Camp Area
The following buildings will be constructed adjacent to the accommodation camp area:
| Effective Date January 1, 2021 | Aris Gold | |||
| Page 294 of 384 |
| SRK Consulting | Soto Norte NI 43-101 – Feasibility Study |
| ● | Main entrance building |
| ● | Truck scale & control room |
| ● | Core-shed (existing) |
| ● | Concentrate truck parking area and building |
| ● | First aid and emergency response building. |
General Support Buildings
The following buildings will be constructed adjacent to the processing plant:
| ● | Warehouse / electromechanical workshop |
| ● | Laboratory |
| ● | Technical services offices (mine, plant, facilities maintenance). |
Security and Emergency Alarms
There are a series of guard houses positioned around the site. An electronic security system will be deployed across the Project area including video surveillance, intrusion detection and access control systems. The Project site will also be protected by over 7.8 km of 2.5 m high chain link fencing with 18” upper concertina wire.
The fire detection, alarm and extinguishing system will be included in all industrial and non-industrial buildings of the Project.
| 18.2.6 | Technology and Information Infrastructure |
Telecommunication System
A telecommunications system will be installed to control information, electronic security, alarm systems and process information within the mine, the process plant.
This system is composed of the following equipment: Servers, Controllers, Link Switches to the telecommunications network, repeaters, fixed radios for office, fixed radios for vehicles, portable radios for personnel, repeater antennas, licenses and software, all the necessary Local Area Network (“LAN”) structured cabling network, among others.
Trunked Mobile Radio System
A mobile radio system will be used for radio communication between operators, vehicles and authorised administrative personnel of the project. The radio system will require the telecommunication equipment to provide coverage to the administrative buildings, the industrial areas, the satellite facilities, the mining areas of Emboque and El Cuatro and all the roads where vehicles from Minesa will be circulating.
Process Automation System (PAS)
A process automation system (“PAS”) will be used to monitor and control all main areas/processes such as underground crushing and conveying, thickening and filtration and water intake. A single control room will be established on site to accommodate and drive collaboration along the mine/processing value chain, with
| Effective Date January 1, 2021 | Aris Gold | |||
| Page 295 of 384 |
| SRK Consulting | Soto Norte NI 43-101 – Feasibility Study |
a unified view of the production and infrastructure across the whole operation. Capability to move to remote operations in Bucaramanga has been considered and where appropriate has been factored into the design.
The PAS will include, but is no limited to the following components:
| ● | Input/output modules |
| ● | Communication interfaces/modules |
| ● | Controllers |
| ● | Network (fiber optic, data cables, switches, firewalls, etc) |
| ● | Cabinets, power supplies, etc. |
| ● | Servers (HMI, historian, reporting, domain controller, etc) |
| ● | Sub-systems (energy management, advance process control, etc) |
| ● | Engineering workstations |
| ● | Operation workstations and consoles |
| ● | Other central control room equipment |
| ● | Interfaces with third party/packaged systems and other operation systems (CCTV, access control, people tracking, fleet management, etc). |
Electronic Security System
The Electronic Security system includes CCTV, Access Control and Intrusion Detection for the camp and process areas of the Project. It will be a robust and reliable system that has 24/7 operational availability, to manage the possibility of a security breach.
| 18.2.7 | Conclusions and Recommendations |
SRK makes the following conclusions and recommendations regarding the on-site infrastructure:
| ● | Conduct additional testwork (flow tests and transportable moisture content) to provide more detail on the design of the dry filtered tailings conveyor system from the plant to the edge of the DSF. |
| ● | SRK has used the information provided to review the high-level cost summaries and finds the costs reasonable. |
| 18.3 | Bulk Power Supply |
The power supply for the Project is planned to provide power for mining and plant production, which correspond to an electrical load shown in Table 18.5.
Table 18.5: Power Requirements during Operation
|
Area
|
Power Required (Running Load) | |||||
| kW | kVA | |||||
| Mining (max)1 |
18.578 | 20,652 | ||||
| Plant |
21,202 | 23,443 | ||||
| Effective Date January 1, 2021 | Aris Gold | |||
| Page 296 of 384 |
| SRK Consulting | Soto Norte NI 43-101 – Feasibility Study |
|
Area
|
Power Required (Running Load) | |||
| kW | kVA | |||
|
Auxiliary |
1,919 | 2,147 | ||
| TOTAL |
41,699 | 46,242 | ||
1 the long-term average is 15 MW once the tunnel boring machine is demobilised.
The power supply strategy includes:
| ● | High-voltage power (47.167 MVA) will be supplied from the existing Palos substation, located on the Northern outskirts of Bucaramanga to the Main Plant Substation at the Padilla site. |
| ● | This will involve the installation of a new 220/34.5 kV (50 MVA) transformer in an additional area of the Palos substation, controlled by ESSA and connected to the existing 220 kV bus system, controlled by ISA within the Palos substation. |
| ● | Construction of a new double circuit 34.5 kV transmission line from Palos substation running 35 km to the Padilla substation. The power line shall also run communications to and from Bucaramanga and Padilla via a segregated fibre optic cable. |
| ● | Each 34.5 kV transmission line has a capacity of 24 MVA (for a total of 48 MVA). |
| ● | Subsequent site distribution will be at primary 34.5 kV and secondary 13.8 kV carried out of the Padilla Substation E-House. |
ESSA has confirmed it can provide the power requirements for the Project. The above strategy was selected following an options study undertaken by HMV Ingenieros who explored 8 alternatives. HMV concluded that 230/34.5 kV connections (medium voltage transmission; are the most appropriate when considering all aspects of the feasibility study (cost, engineering and environmental legislation / licencing).
During pre-production, power will be sourced from both diesel generators and the existing California substation connection as required.
| 18.3.1 | Conclusions and Recommendations |
Regarding the bulk power supply, SRK considers that accommodating the two lines on a single set of poles introduces the risk of interruption to both lines should the poles be adversely affected. SRK recommends that redundancy in the system at the Palos substation should be revised to ensure that onsite back up power needs are sufficient for critical loads.
| 18.4 | Off-Site Roads and Upgrades |
The 172 km route from the Barrancabermeja Port to the Padilla plant-site has a number of restrictions and these do have the potential to cause delays and issues, especially for construction. The route can be considered as the following sections:
| ● | Barrancabermeja to Bucaramanga |
| ● | Bucaramanga town |
| ● | Bucaramanga to Matanza |
| ● | Matanza town |
| Effective Date January 1, 2021 | Aris Gold | |||
| Page 297 of 384 |
| SRK Consulting | Soto Norte NI 43-101 – Feasibility Study |
| ● | Matanza to Suratá |
| ● | Suratá village |
| ● | Suratá to Padilla. |
Between Barrancabermeja to Bucaramanga is a two-way single lane regional highway that is already suitable for construction and operations, although traffic volumes regularly cause delays through bottleneck sections. The local authorities are upgrading to a dual lane highway with works due to be completed in 2021. It is also noteworthy that the Project relies on the regional government completing the necessary upgrades prior to Project commencement to allow unhindered construction and operational access. If these upgrades are not funded by others and not completed in time, it could significantly extend the current proposed construction schedule.
The remaining distance from Bucaramanga to site is split into road sections (summarised in Table 18.6) and for the majority, the detailed engineering design to upgrade this road is complete and is ready for construction and a works program has been developed in conjunction with the regional government (Gobernacion de Santander) to upgrade these critical sections.
Table 18.6: Road Sections and Lengths
|
Location
|
Length (m)
|
Municipality
|
||||
| Road Bucaramanga – Matanza (from Carabineros Police Station to La Playa Bridge) |
25,190 | Bucaramanga / Charta | ||||
| La Playa Bridge to Matanza |
5,520 | Matanza | ||||
|
Matanzas’s parallel road (bypass) |
1,140 | Matanza | ||||
| Matanza – Panaga Bridge |
4,300 | Matanza / Suratá | ||||
| Panaga Bridge - Suratá |
1,980 | Suratá |
In order to reduce impact and simplify construction access and schedule, the Project will construct an access road from a point in advance of Suratá to access the site. This access road falls under the Project bulk earthworks contract. The Matanza bypass has a rather longer permitting duration than the Project schedule and thus the Project proposes to rent the properties in the alignment of the new road to transport the construction equipment and in a parallel, the environmental studies will be developed to allow road construction to be ready for the operation of the Project.
| 18.4.1 | Conclusions and Recommendations |
SRK conclude that the overall costs are reasonable and have been estimated at a level appropriate for a Feasibility Study.
| 18.5 | Off-site Logistics |
| 18.5.1 | Introduction |
The overall strategy for export of concentrates will be for concentrates to be loaded into twenty-foot equivalent containers (“TEU”) which are firstly, transported by road to Impala Terminal’s Barrancabermeja River Port on the Magdalena River, where they are then stored and loaded to river barges before being towed/pushed to Cartagena sea port for export. The Impala Terminal is circa 172 km by road from California village and the resulting barging distance from the river port to Cartagena is approximately 660 km. The road haulage operation to Impala Terminal’s Barrancabermeja River Port is envisaged to be sub-contracted
| Effective Date January 1, 2021 | Aris Gold | |||
| Page 298 of 384 |
| SRK Consulting | Soto Norte NI 43-101 – Feasibility Study |
to a Haulage Contractor. Import of equipment and materials during construction and operations will follow the same route in reverse or could be transported by road.
The transport and logistics concept are both reasonable and feasible. The Impala Terminal is ready to accept the proposed container traffic and (if ever required) there is an alternative by road. The utilisation of Haulage Contractors and existing third-party infrastructure (road, Impala terminal and fluvial transportation) minimises capital costs to the Project and utilises the readily available third-party knowledge and resources.
| 18.5.2 | Impala Terminal River Port and Fluvial Transport |
The recently constructed Impala Terminal at Barrancabermeja comprises a single harbour crane and a suite of barges and tugs. The river port operator will be responsible for unloading containers from trucks, storage of containers, and loading to barges, as well as the value chain as far as loading to ocean going vessel at Cartagena.
The most commonly used configuration comprises one pusher boat of 1,800 to 4,500 HP and 6 to 8 barges of 1,000 to 1,600 t capacity (36 to 58 containers per barge) and the terminal has enough capability to handle the throughput.
| 18.5.3 | Road Haulage Operations |
Minesa proposes to sub-contract road haulage operations to a Haulage Contractor and the existing road network will be used, although with the upgrades as already described. According to Resolution 4100 – 28 December 2004 from Ministerio de transporte of Colombia, the maximum allowed dimension of designation 4 type vehicles is: 2.6 m wide, 4.4 m high and 12.2 m long with a maximum gross weight allowance of 36 t.
The total haulage route will be circa 172 km with a round trip estimated at circa 15 hours. This means around 31 trucks in the fleet, assuming daylight hours only operations.
The utilisation of Haulage Contractors and existing third-party infrastructure (road, Impala terminal and fluvial transportation) minimises any capital costs to the project and utilises the readily available third-party knowledge and resources.
| 18.5.4 | Container Loading |
At the processing plant, the lined containers will be loaded by retractable conveyor, sealed and relocated to a secured storage facility located adjacent to the process plant that will have the capacity to store 120 TEU with additional areas designated for emergency storage (capacity 120 TEU). Containers will be sealed and loaded to trucks by reach-stacker, operated by Minesa. The gross target weight for each concentrate container is 27.3 t, giving a nominal payload of 25 t as the containers are understood to have a tare weight of 2.3 t.
| 18.6 | Dry Filtered Tailings and Waste Management |
| 18.6.1 | Introduction |
The development of Soto Norte Project will produce over 22.5 Mt of dry filtered tailings and 12.8 Mt of waste rock through the life of mine. All the dry filtered tailings and 2.5 Mt of waste rock are to be stored on surface, with the remainder of waste rock stored as backfill. The selected method of storage is dry stacking of filtered tailings. The proposed management strategy for the tailings and waste rock designated for surface storage is to co-dispose the waste rock with the filtered tailings at a long-term storage facility with an estimated
| Effective Date January 1, 2021 | Aris Gold | |||
| Page 299 of 384 |
| SRK Consulting | Soto Norte NI 43-101– Feasibility Study |
design capacity of 21.5 Mm3 or 38.5 Mt. The DSF design includes additional capacity as part of a longer-term strategy in excess of the current defined mine life.
The thickened tailings from the process plant will be filtered at the filtration plant to a filter cake with a moisture content of less than 15%. The filtered tailings from the filtration plant will be transported by a conveyor system and deposited at the DSF, where it will be protected from rainfall and surface runoff. The dry filtered tailings will be deposited and mechanically compacted to achieve the target density which is critical for both static and seismic stability of the DSF.
Most of the development mine waste rock generated underground will be deposited underground as backfill in the mined stopes and only a small portion, approximately 2.5 Mt, of the waste rock is designated for surface storage. The waste rock will be environmentally contained in surface storage since most of the waste rock is classified as PAG (SRK, 2017; SGS, 2018). The waste rock will be deposited as internal drainage zones to be encapsulated within the dry filtered tailings to prevent oxidation in the long term and function as drainage during operation. The waste rock drainage zones will be wrapped with geotextile to prevent tailings ingress. The box cut and plant site excavations will produce around 1.6 Mt of waste material consisting of sand, gravel and pebbles. Screened sand and gravel from these materials can be used as drainage material for the initial phase of the DSF development if required.
Design work completed for the planned DSF at Soto Norte Project and referenced as part of this Technical Report are shown below:
| ● | DSF Complimentary Design (SNC, 2019a) |
| ● | DSF Design Improvement Progress Updates PowerPoint Presentation (SNC, 2019b). |
| ● | Relevant sections of the Pre-Feasibility Study (SNC, 2017) including: |
| ○ | Dry Stack Facility Design |
| ○ | Capital Expenditure Estimate – Rev 1. Appendix A3 (Access database report) |
| ○ | Memorandum – Site Water Management study (issued 26/05/17). |
| ● | Drainage System DSF – Report (WorleyParsons, 2019a) |
| ● | DSF Stability Calculation (WorleyParsons, 2019b). |
| ● | Soto Norte Project Feasibility Study Dry Stack Facility - Design Review - Draft Report (WorleyParsons, 2017a). |
| ● | Soto Norte DSF Drawing Set (WorleyParsons, 2017b). |
The following sections provide an overview of the proposed dry filtered tailings and waste rock management strategy on surface, plus recommendations related to future work.
| 18.6.2 | DSF Design Development |
The complex topography and high seismicity of the project site as well as the requirement for containment of small quantities of PAG waste rock contribute to the complexity of the DSF. The main DSF engineering and design components include:
| ● | Dry filtered tailings and waste rock deposition planning and handling. |
| Effective Date January 1, 2021 | Aris Gold | |||
| Page 300 of 384 |
| SRK Consulting | Soto Norte NI 43-101– Feasibility Study |
| ● | A starter facility located downstream of the depression for retaining of dry filtered tailings. |
| ● | Surface water management including surface non-contact water diversion and surface contact water collection for treatment at the water treatment plant; details for site-wide water management and water treatment are presented in Section 18.7 (Water Management). |
| ● | A liner system to minimise or prevent negative impact of seepage water on the groundwater system and a cover system at closure. |
| ● | Internal, upper and under drainage systems to promote drainage of the dry filtered tailings and to prevent pore water pressure build-up in dry filtered tailings, monitor water quality and convey runoff. |
| ● | Instrumentation. |
A general arrangement of the DSF is presented in Figure 18.6.
| 18.6.3 | Design Criteria |
The key design criteria for the DSF are as follows:
| ● | The DSF will be designed to the Canadian Dam Association (“CDA”) standards 2014 to provide a safe and environmentally acceptable facility for co-disposal of dry filtered tailings and waste rock with a maximum storage capacity of approximately 21.5 Mm3 for -a total tonnage of 38.5 Mt of dry filtered tailings and waste rock. This facility has been given a consequence classification of ‘High’. |
| ● | Dry filtered tailings are non-PAG or low-PAG and the waste rock are PAG, so the waste rock will be covered by dry filtered tailings to mitigate acid generation and metal leaching. |
| ● | The DSF involves construction of a starter facility for buttressing and environmental containment of the dry stack constructed with non-PAG and non-ML rockfill. |
| ● | The DSF involves upstream stacking of dried filtered tailings with a minimum solid content of 85%. Minimum factors of safety will be met, and it will be designed for a Maximum Credible Earthquake (“MCE”) of half between a 1 in 2,475-year and 1 in 10,000-year earthquake event. |
| ● | Full drainage for contact and non-contact water, including underdrainage will be incorporated into the design, including allowance of between a 1 in 25-year and a 1 in 100-year storm event. |
| ● | Enough crest width will be provided to facilitate construction and heavy equipment traffic during operation. |
| ● | Water in the collection pond will be sampled for water quality testing prior to pumping to the water treatment facility or to the natural receiver depending on water quality. The pumping capacity is designed to handle 1 in 100-year 24-hour duration storm event without overtopping, taking into consideration the very limited storage that the collection pond can provide due to the topography. |
| 18.6.4 | Deposition Plan |
A conveyor system will be used to transport the dry filtered tailings and waste rock to a discharge point at the DSF. The dry filtered tailings will be deposited using tripper conveyors on the side slope and tailings deposition surface with portable conveyors to move materials close to the deposition point and front-end
| Effective Date January 1, 2021 | Aris Gold | |||
| Page 301 of 384 |
| SRK Consulting | Soto Norte NI 43-101– Feasibility Study |
loaders with trucks to transport short distances. Graders and compactors will be used to place the dry filtered tailings and rock waste material appropriately to a compaction specification.
| 18.6.5 | Water Management |
Minesa has specific management measures to mitigate, control and monitor the impacts on water resources in the area of influence in management programmes. The DSF water management system includes surface water management and non-surface/drainage water management. The surface water management includes two components:
| 1) | Non-contact water: open diversion channels that run around the DSF perimeter |
| 2) | Contact water: a DSF surface water collection system. |
The diversion channels collect non-contact surface runoff from the natural watershed and drains to the receiver (downstream of the collection pond). The DSF surface water collection system was designed to collect DSF surface contact runoff drainage and direct the water to the collection pond during operation. The DSF surface water collection ditches will become non-contact water collection ditches after closure, and the water from the collection system will be directed to the non-contact water diversion channels.
The non-surface or drainage water management includes the following two components:
| ● | Underdrain pipelines (WorleyParsons, 2019a) run underneath the liner system of the DSF which collect groundwater from the base of the DSF for groundwater pressure relief |
| ● | Upper drain pipelines (WorleyParsons, 2019a) to collect seepage water from the DSF |
The collection pond is located downstream of the DSF and receives inflows from:
| ● | Contact surface runoff from the DSF |
| ● | DSF seepage water collected by the upper drain system |
| ● | Groundwater collected by the underdrain system depending on water monitoring results |
| ● | Local runoff from the collection pond catchment |
A series of pipes, monitoring access holes, and an energy dissipation basin will be constructed to safely direct the flows to the collection pond where the water will be pumped through a robust pumping system to the water treatment plant. The pumping system will consist of two main pumps and a low-flow pump.
| 18.6.6 | DSF Design |
The DSF design is developed by construction of the starter facility to a crest elevation at 2,020 mRL. Associated surface and drainage water management structures and liner system for Phase 1 will be constructed prior to operation. The starter facility is a cross valley facility for retaining the stacked dry filtered tailings and is designed as a rockfill facility with impermeable lining on the upstream face. Cross sections of the starter facility are shown in Figure 18.5. It will be founded on prepared foundations of dense sand and gravel or weathered bedrock. A sand layer at the bottom and a transition zone between sand layer and the rockfill will be placed on prepared foundation for protection from erosion. The sand and transitional zones also provide protection to the outlet upper and under drainage pipes (WorleyParsons, 2019a) from mechanical damage by rockfill. The underdrainage and upper drainage pipes underneath the starter facility
| Effective Date January 1, 2021 | Aris Gold | |||
| Page 302 of 384 |
| SRK Consulting | Soto Norte NI 43-101– Feasibility Study |
will be HDPE and will be placed in trenches that are keyed into very dense material or weathered bedrock for protection considering the significant loading stress from the embankment. Before construction of the starter facility, Phase 1 diversion channels will be constructed for diversion of surface non-contact water. During construction of the starter facility a temporary pump will be used for surface runoff within Phase 1 catchment area and groundwater seepage from the natural slopes to downstream until the dry filtered tailings deposition surface reaches the DSF crest. The Phase 1 DSF storage has enough capacity for dry filtered tailings and waste rock until end of year 2 operations. The associated surface drainage water management structures and liner system for the remaining four phases will be constructed during operations, ahead of the deposition of the next phase.
| 1. | The ultimate DSF is designed for a storage capacity of approximately 21.5 Mm3 or a total tonnage of 38 Mt of dry filtered tailings and waste rock. The main design features of the ultimate DSF are summarised below. |
| 2. | The ultimate dyke is a raised dyke on top of the starter dyke in stages using the downstream method with rockfill and extension of the impermeable geomembrane liners on the upstream face. It has a front face slope of 5H:1V for the co-disposed dry filtered tailings and waste rock during operations and 4H:1V at the end of operations. The steeper final configuration is shown in Figure 18.6. The rockfill source for dyke raising is assumed to be from non-PAG waste rock. |
| 3. | The non-contact water flow-through underdrain and contact water drainage pipe(s), which are constructed with the starter dyke before operation, crosses underneath the ultimate dyke at the valley bottom. |
| 4. | The ultimate DSF involves extension of the non-contact water perimeter diversion ditches, and the contact water drainage system. |
A basin liner system is required to minimize or prevent impacts of seepage water from the DSF on the groundwater system and surrounding environment. The proposed liner system for the DSF includes a geosynthetic liner at the lower valley area extending a minimum of 30 m above the valley bottom in the lower valleys and a clay liner above the geosynthetic liner on upper valley slopes. Benches of approximately1.5H:1.0V will be cut to facilitate liner installation. A bedding sand layer below the geomembrane liner will be placed to prevent puncture from rocks or debris. The liner will be progressively installed bench by bench as the dry filtered tailings are deposited so that the dry filtered tailings can form a platform and to provide buttress for the excavated slopes above as well.
It is critical that the dry filtered tailings in the DSF are unsaturated and provide enough effective strength under both static and seismic loading conditions to meet the design criteria. Internal drains are incorporated in the DSF design to promote drainage of the dry filtered tailings, to prevent tailings saturation and loss of effective strength. The proposed material for the internal drainage zones is clean stone which can be either clean mine waste rock or quarry rock. The drainage zone will be constructed prior to dry filtered tailings deposition and the other internal drainage components will be constructed progressively as dry filtered tailings are deposited.
The geotechnical investigations for the DSF consisted of drilling three boreholes at the DSF area, one borehole at the proposed filtration plant and two boreholes at the bypass road downstream of the DSF, excavation test pits within the basin, and implementing three geophysical survey lines which were broken into 11 segments. Laboratory tests, including direct simple shear, were carried out on two tailings samples to identify the geotechnical properties of the unsaturated tailings including hydraulic conductivity, shear
| Effective Date January 1, 2021 | Aris Gold | |||
| Page 303 of 384 |
| SRK Consulting | Soto Norte NI 43-101– Feasibility Study |
strength and volume change functions.
The liquid limits test results indicate that 85% solid content for the dry filtered tailings is marginal to liquidity and the water content is on the wet side of the Optimum Water Content (“OMC”).
Based on the geotechnical data, the ground conditions encountered at the DSF consist of a topsoil layer with a thickness of up to 1 m, and underlying overburden soil and bedrock. The thickness of the overburden soil layer varies from 0.5 m to 17 m. The overburden soil is primarily comprised of dense silty or clayey fine sand, and sand and gravel. Bedrock outcrops were observed at the north abutment and the upper south slope close to the planned filtration plant area. Where overburden soil appears, generally the change from overburden soil to bedrock is significantly transitional. The bedrock formation is generally sedimentary rock from limestone, sandstone to interbedded limestone or sandstone with shale.
Groundwater levels were observed in the three installed piezometers at depths of 22.6 m and 29.1 m below surface in the banks and a depth of 7.3 m below surface in the low valley area.
The site is located within the Andean tectonics region which has ‘High’ seismic and magmatic activity. In addition, the site-specific seismic hazard analysis carried out for the mine area (Ausenco, 2013) recognised several nearby active fault systems. Based on the deterministic analysis, the MCE produced by the Morronegro–Las Mercedes System has a magnitude of 7.5 Mw and peak accelerations of 0.26 g at the 50th percentile and 0.38 g at the 84th percentile at the mine area.
A geochemical characterisation program on dry filtered tailings and waste rock was undertaken during the FS, including both static and kinematic tests. These tests concluded that the dry filtered tailings samples maintained neutral pH and the rock samples indicated low solute release rates but indicated acid conditions.
| Effective Date January 1, 2021 | Aris Gold | |||
| Page 304 of 384 |
| SRK Consulting | Soto Norte NI 43-101 – Feasibility Study |
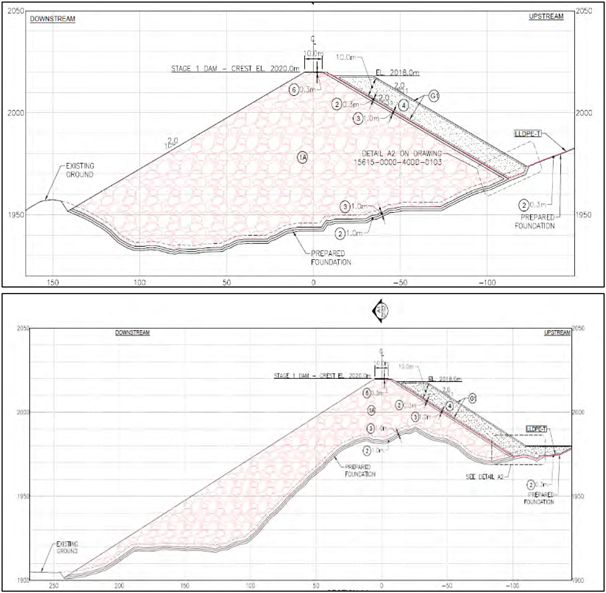
Figure 18.5: Cross Sections 1 (left) and 2 (right) of Starter Facility
| Effective Date January 1, 2021 | Aris Gold | |||
| Page 305 of 384 |
| SRK Consulting | Soto Norte NI 43-101 – Feasibility Study |
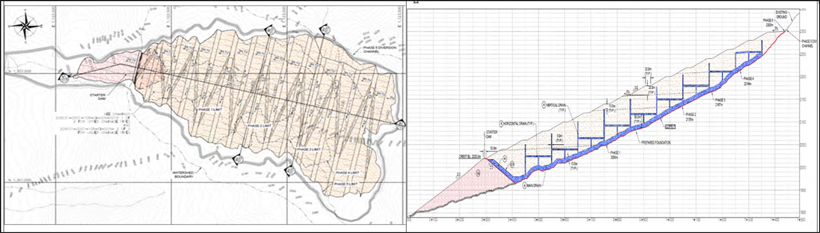
Figure 18.6: Plan (left) and Cross Section (right) of DSF Final Phase 5 (Final) Deposition
| Effective Date January 1, 2021 | Aris Gold | |||
| Page 306 of 384 |
| SRK Consulting | Soto Norte NI 43-101– Feasibility Study |
| 18.6.7 | DSF Stability Analyses |
Stability analyses were carried out on three sections of the natural slopes at the planned DSF, the starter facility and five phases of the DSF using pseudo-static analyses for a ‘High’ seismic zone. The CDA 2014 standards were used for the seismic coefficients and acceptable factors of safety for a ‘High’ consequence facility, which are shown in Table 18.7.
Table 18.7: Minimum Factor of Safety (CDA, 2014)
| Loading Conditions
|
Minimum Factor of Safety Required |
Comments | ||
|
End of construction |
1.3 | |||
|
Long term (steady state seepage) |
1.5 | |||
|
Rapid drawdown |
- | Not Applicable | ||
|
Pseudo-static |
1 | |||
|
Post-earthquake |
1.2 |
Limit equilibrium analysis was conducted using peak effective strength soil parameters taken from the laboratory direct shear tests that indicate a j’ value of between 340 and 360.
The analysis results for the starter facility, the five phases of the DSF and the DSF at closure indicate satisfactory factors of safety under static and pseudo-static conditions with excavation of residual soil in the basin upstream of the starter facility, and excavation of residual soils and upper saprolite soil within the starter facility footprint. The excavation depth within the starter facility footprint is estimated to be in the range of 2 to more than 10 m at localised areas to ensure a competent foundation. In the footprint upstream of the DSF and the surrounding embankments, residual soils require removal.
| 18.6.8 | Instrumentation and Monitoring |
Geotechnical safety will be monitored by vibrating wire piezometers within the DSF and starter facility and inclinometers in the natural slopes and embankments during operation and after closure. Real time continuous and unattended monitoring will be employed for the geotechnical monitoring. Additionally, water quality monitoring instrumentation will be implemented for monitoring of the surface contact-water, upper and underdrainage flows at immediately downstream of the DSF and at the collection pond.
| 18.6.9 | Closure Concept |
The DSF will provide long term storage of dry filtered tailings and waste rock and will remain in place beyond mine closure. The DSF will be closed in stages following deposition to maintain slope stability, minimise dust, minimise water infiltration and contaminant migration and to limit access of people whilst being aesthetically compatible with the surrounding lands.
The cover system, subject to availability of material, consisting of saprolitic soil, a drainage blanket and topsoil with vegetation cover, will be designed to prevent future infiltration of surface water into the DSF. The cover system will allow the DSF collection ditches to transform from collection of contact water during operation to the collection of non-contact water after closure. The collected runoff will be directed to natural receivers after closure. Sufficient topsoil will be stockpiled to allow for closure during construction.
| 18.6.10 | Construction and Operation Considerations |
The construction of the DSF is a complex multi-step process which includes construction of water diversion
| Effective Date January 1, 2021 | Aris Gold | |||
| Page 307 of 384 |
| SRK Consulting | Soto Norte NI 43-101– Feasibility Study |
channels, natural slope and foundation preparation, starter facility construction and progressive construction of drainage and liner systems. Correct planning and scheduling, then careful installation and protection of the various infrastructure and monitoring equipment will be implemented.
An “Operation, Maintenance and Surveillance (OMS) Manual” will be prepared and available before the operation starts. It will include the requirements for inspection and maintenance, proper planning and scheduling of construction, dry filtered tailings deposition plans, dust control measures, contact water ditch maintenance and details of closure.
| 18.6.11 | Conclusions and Recommendations |
SRK has made the following conclusions and recommendations for future work on the DSF:
| • | Carry out further geotechnical testing, including undrained and triaxial strength testing to determine residual strength and whether the materials are contractive or dilative at the point of failure, on representative tailings samples from filtration tests, to determine whether they are at moisture contents representative of those that can be achieved during operation. Additional geotechnical testing should be completed on representative tailings samples from all areas and stages of the LoMP ore (classification tests, compaction tests and CU Triaxial tests) to confirm parameters for both future stability analyses and design. |
| • | Limited equilibrium analysis was conducted using peak effective strength soil parameters taken from the laboratory direct shear tests that indicate a j’ value of between 340 and 360. No residual or undrained shear strength parameters were considered during the analysis. Instead, pseudo- static analysis was undertaken to check for stability during a seismic event, with no consideration for short term loading. The pseudo-static analysis may not be relevant as it is not understood whether the material is contractive and therefore potentially liquefiable. Finally, the targeted moisture content from the filtration plant is 15% which is wet of optimum moisture content meaning that placed material will not be at maximum dry density and there not at peak strength. Undrained strength limit equilibrium analysis should be completed as a matter of priority for the DSF, to ensure that the effects of porewater pressure increase in the dry filtered tailings are adequately assessed. This could occur due to rapid loading of dry filtered tailings during construction or contraction of the dry filtered tailings during static/seismic liquefaction. The designed DSF external slopes may require adjustment to ensure that adequate Factor of Safety (“FOS”) values are obtained under all loading scenarios. |
| • | Interface shear strength testing should be performed using the Linear low-density polyethylene geomembrane liner (“LLDPE”) / sand materials proposed in the design to consider the effect of dry filtered tailings settlement, consolidation, and displacement on tension and shear strain in the lining system. This should be undertaken using equipment capable of performing large-scale direct shear (“LSDS”) testing with large displacements to confirm the parameters assumed in the analyses. |
| • | Review the footprint area available on the upper deck of the DSF to ensure that there is sufficient area for storage of off-specification dry filtered tailings during periods of high rainfall. A plan should be made to distribute, place, and compact the wet of OMC dry filtered tailings material to the required specification/density, particularly around the external slopes of the landform. This is essential to ensure that no loose, potentially contractive material is placed around the external slopes of the landform. Additional equipment may be required to rework any the dry filtered tailings that are deposited significantly wet of optimum, to ensure that the compaction specification of the |
| Effective Date January 1, 2021 | Aris Gold | |||
| Page 308 of 384 |
| SRK Consulting | Soto Norte NI 43-101– Feasibility Study |
| 95% Standard Proctor maximum dry density (“SPMDD”) can be achieved. |
| • | The design documentation highlights the importance of managing seepage, drainage and surface water flows to ensure that design constraints are not exceeded. This is to prevent saturation, build-up of excess pore pressure and development of loose conditions in the dry filtered tailings mass. The sizing of the critical contact and non-contact water management features should be updated for design storm annual exceedance probabilities (“AEP”) that are appropriate to a ‘High Consequence’ tailings storage facility. The Global Industry Standard on Tailings Management (“GISTM”) requires a design storm AEP of 1/2,475 years for operations / active closure and 1/10,000 years for long-term passive closure. |
| • | The cost estimates prepared for the DSF design should be updated to reflect additional capital costs associated with forming the proposed benched geometry (basal slope areas) and construction of additional surface and drainage water management features (cut/fill to form access roads and channels and concrete drop structures adjacent to the main embankment; increased drain and pond sizes). Operating cost estimates should also be re-appraised, to ensure that the costs associated with rework and compaction of dry filtered tailings on the DSF are factored into the cost model. |
| 18.7 | Water Management |
Minesa has specific management measures to mitigate, control and monitor the impacts on water resources in the area of influence in management programmes. The following sections presents the water balance, water treatment requirements and closure water management considerations. The surface and groundwater management plans were presented in Section 16.4.
| 18.7.1 | Water Balance |
The Soto Norte Project involves multiple facilities, various sources of dewatering flows, and many ways in which the different flows interact. In the initial stages of mine life, during the first three years, tunnelling from Padilla and the underground development at Emboque will not be connected so will need to be handled as separate schemes. All groundwater generated by the underground mine will be treated to required standards at Emboque for reuse or discharge to the La Baja stream and water required for services during construction at Padilla will be obtained from the Suratá river.
During the operations phase, most of the groundwater will be routed from the mine through the TBM tunnel access and handled at the Water Treatment Plant in Padilla, where DSF contact water and any excess from the processing plant are also treated to required standards. The outflow from the treatment plant will be recycled for service water use within the processing plant and underground mine with any excess discharged to the Suratá river.
A spreadsheet based, steady state, site-wide water balance has been produced for four construction and four operational scenarios, considering average and peak construction with average and wet climatic conditions. Appendix C presents an example of the output for the average operational and climatic conditions.
A total of five water intake permits and six discharge permits were included in the EIA report to meet the project water demand and discharge requirements.
| 18.7.2 | Water Treatment |
| Effective Date January 1, 2021 | Aris Gold | |||
| Page 309 of 384 |
| SRK Consulting | Soto Norte NI 43-101– Feasibility Study |
The Project will have several WTP’s and sewage treatment plants (“STP”) to treat water to the required standards including:
| ● | Padilla process WTP |
| ● | Padilla potable WTP |
| ● | Padilla STP |
| ● | Emboque process WTP |
| ● | Emboque potable WTP |
| ● | Emboque STP. |
A potable WTP will be located at the Padilla camp facility site (La Higuera) and the plant capacity is designed for a construction phase peak of 1,850 personnel.
The STP at Padilla will have a capacity of 187 m³/day, capable of handling a peak of 1,850 personnel during the construction phase. The sewage system runs from the military base, processing plant and camp to the STP terrace, where it is treated to the required standard and then discharged to the Suratá River. Sludge waste from the sewage treatment plant will be disposed of off-site by an authorised contractor.
Geochemical modelling of contact underground dewatering discharge water quality suggests concentrations of some determinants will be above the relevant surface water environmental quality standards (particularly Zn, but also Cu and U) during the first few years of mining, which will be addressed during water treatment.
A WTP will process water from the DSF pond, UG mine, excess water from the process plant and contact water from the process plant area platforms to an appropriate standard. The treated water will be raw water for the process plant and excess water will be discharged to the Suratá River by pipeline. Excess dewatering water will be discharged via Padilla unless there are low flows in La Baja, in which case excess water will be discharged to La Baja.
The layout of the main WTP to be built in Padilla is presented in Figure 18.7. The approach is to build a staged facility that allows for modifying the layout and to activate/deactivate the various trains to respond to the flow needs. The treatment stages comprise the following:
| ● | The main treatment will be carried out via trains of Coagulation-Flocculation-Sedimentation. These trains will be set up in parallel to be adjusted to different flow capacity. Each of these trains will include a chemical mixing chamber, two-stage mechanical flocculation with Variable Frequency Drives (“VFD”) to monitor the process and adjust its speed, and a tube settler clarifier. The process will include: (i) chemical injection in raw water to raise pH to 8 – 9 to help in precipitation of the heavy metals such as Zn and Cu (ii) chemical injection in raw water with a coagulant such as Polyaluminum Chloride or Ferric Chloride followed by rapid or flash mixing (iii) flocculation or gentle mixing of the water along with chemical injection of polymer or coagulant aid and (iv) clarification or sedimentation of the flocculated water for about 35 to 40 minutes to settle the sludge using tube settlers and pH adjustment by adding acid injection to bring down the pH between 7-8. |
| ● | The setup would include a secondary IX circuit to treat excess metals such as zinc and/or uranium which may have the potential to be above the effluent criteria after primary treatment. |
| Effective Date January 1, 2021 | Aris Gold | |||
| Page 310 of 384 |
| SRK Consulting | Soto Norte NI 43-101– Feasibility Study |
| ● | There are two approaches for ammonia treatment, using an IX circuit with zeolite pressure vessels or using a rotating biological contractor (“RBC”). The former has the advantage of working with low ammonia concentration, and the latter is less costly and can treat significant concentrations that feed the bacteria in a consistent manner. |
| ● | The sludge generated in the effluent will be dried using a centrifuge to leave it ready for disposal. |
This WTP will be further developed during the detail engineering phase and the treatment processes will confirmed via pilot testing. This staged treatment with parallel trains will offer versatility and OPEX optimization.
| Effective Date January 1, 2021 | Aris Gold | |||
| Page 311 of 384 |
| SRK Consulting | Soto Norte NI 43-101 – Feasibility Study |
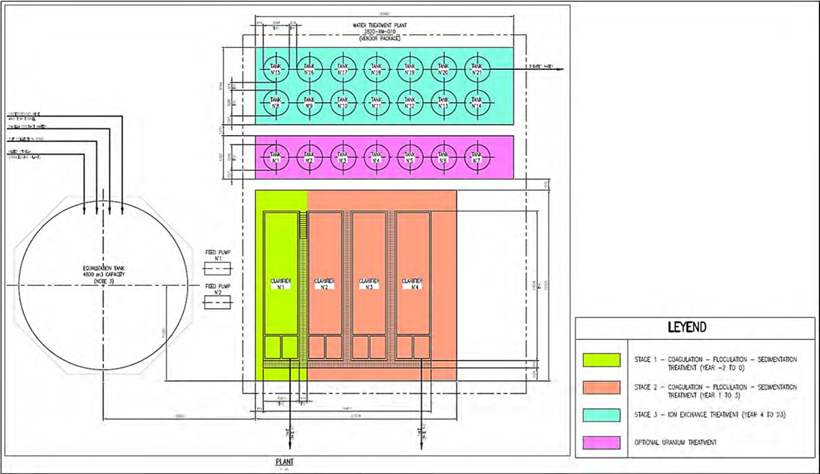
Figure 18.7: Plan of Padilla Main Water Treatment Plant Layout
| Effective Date January 1, 2021 | Aris Gold | |||
| Page 312 of 384 |
| SRK Consulting | Soto Norte NI 43-101 – Feasibility Study |
| 18.7.3 | Water Management During Closure |
Following groundwater rebound post mine workings closure, the La Baja River is expected to return to a gaining river, receiving groundwater baseflow. Once rebound has occurred, a portion of the groundwater baseflow entering the river is expected to be from groundwater that has flowed through the mine workings, and may have interacted with mineralised rock, cemented tailings backfill, and/or backfilled waste rock. Figure 18.8 shows a conceptualisation of the rebound conditions, showing potential flow paths for groundwater flow through the mine workings and to daylight as baseflow into La Baja.
Predictive geochemical models have been developed for the underground mine following rebound of the water table to assess the effect of mixing of the mine void water with La Baja flow. The models evaluated two scenarios: (1) when the water table is allowed to rebound naturally over 10 years; and (2) when the mine is rapidly filled by pumping La Baja water into the mine during the wet season, with rebound completed within three years.
The model results predict that under the natural rebound conditions the water quality within La Baja could deteriorate with respect to Zn, Cd and U, potentially exceeding the proposed effluent discharge standards, even after mixing with La Baja flows. Under the rapid fill approach there is lower solute loading from the rebounding groundwater. Therefore, the predictive models indicate that the risk of surface water impacts post-rebound can be minimised by using a rapid-fill approach to groundwater rebound, however, there remains a risk of elevated zinc concentrations in La Baja following rebound. This risk will be further evaluated during the mine life and the treatment and mitigation requirements to meet post-closure discharge water quality standards will be defined.
The DSF will be progressively closed and rehabilitated. The facility is to remain in perpetuity. At closure, the DSF will be adequately capped/covered and then covered with topsoil and vegetation. The purpose of the cap will be to reduce the rate of infiltration into the waste mass, such that the seepage and discharge rate will be lower than during operations, allowing the waste mass to drain down in the post-closure period. The cap will also serve to limit the ingress of oxygen into the waste mass. As a result, the rate of oxidation during closure will be lower than during the operational period.
| Effective Date January 1, 2021 | Aris Gold | |||
| Page 313 of 384 |
| SRK Consulting | Soto Norte NI 43-101 – Feasibility Study |
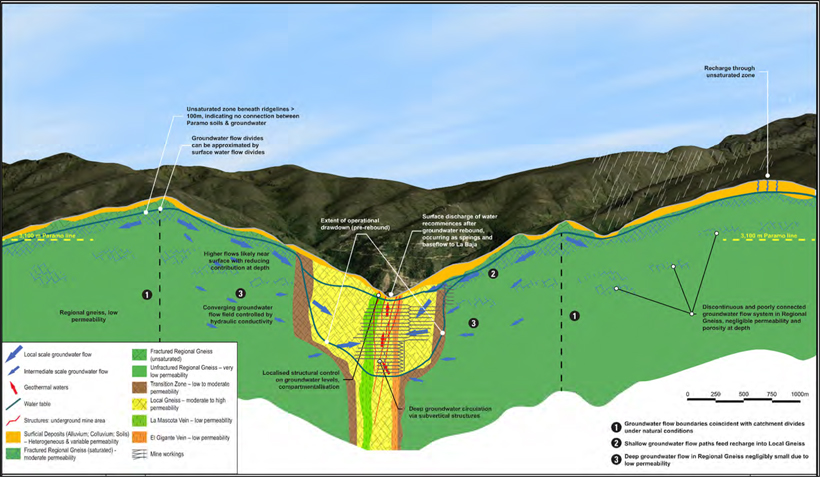
Figure 18.8: Cross Section of Conceptualised Groundwater Flow Post-Rebound (SRK 2017)
| Effective Date January 1, 2021 | Aris Gold | |||
| Page 314 of 384 |
| SRK Consulting | Soto Norte NI 43-101 – Feasibility Study |
| 19 | MARKET STUDIES AND CONTRACTS |
| 19.1 | Introduction |
No material contracts are yet in place. Minesa engaged BlueQuest Resources AG (“BQR”) to assist in the development of a comprehensive marketing and logistics strategy (Marketing Strategy) which was completed in February 2020. More recently (in March 2020), Minesa set up its in-house marketing team to further engage with potential offtakers. Bids were received and revised during the second half of 2020 for consideration.
Marketing assumptions used in the economic analysis were based on direct engagements with numerous potential offtakers.
| 19.2 | Commercial Terms for Copper Concentrate |
| 19.2.1 Copper | Payables |
The copper concentrate expected to be produced by Minesa will have a grade of copper approximately 16%, which is generally below the median average copper content of global seaborne traded concentrates of approximately 22 to 30%.
The deductions applied to the payables for copper in the copper concentrate are summarised in Table 19.1.
Table 19.1: Deductions to be applied to Copper Payables in the copper concentrate
| Cu Content per dmt | Deduction | |||||
|
Below 23% |
Subject to a minimum deduction of 1.1 units |
|||||
|
Below 20% |
Subject to a minimum deduction of 1.2 units |
|||||
|
Below 15% |
Subject to a minimum deduction of 1.3 to 1.5 units if accepted |
| 19.2.2 Gold | Payables |
Minesa estimates a payable 97.25% to 97.5% of the total assayed gold content in the copper concentrate provided the grade is above 100 g/dmt Au, subject to the minimum deduction of 3 or 4 g/dmt Au.
| 19.2.3 Silver | Payables |
Minesa estimates a payable 95% to 97% of the total assay silver content in the copper concentrate provided the grade is above 1,000 g/dmt Ag, subject to the minimum deduction 50 g/dmt Ag.
| 19.2.4 Deductions | and Penalties |
The Soto Norte copper concentrate is relatively high in arsenic, therefore the ability to ship to China as a copper concentrate relies on the receiver either having a special importation license (such as XGC or Chinalco) or customs interpreting the material as a gold concentrate (which is likely).
Individual copper smelters have different requirements, restrictions and preferences relating to the number and grade of deleterious elements it can blend with its current supply contracts, so in practice penalties will differ from smelter to smelter. Table 19.2, to some extent, provides typical penalty rates and forms the basis for the economic model. Values are in percentage by weight or ppm of contained element per dmt of
| Effective Date January 1, 2021 | Aris Gold | |||
| Page 315 of 384 |
| SRK Consulting | Soto Norte NI 43-101 – Feasibility Study |
concentrate (Table 19.2).
Table 19.2: Penalties on copper concentrate
| Element | Penalty | |||||
| Arsenic (As) | <0.3% | no penalty | ||||
| 0.3-0.5% | USD2.00 per 0.1% As per dmt | |||||
| 0.5-1.5% | USD5.00 per 0.1% As per dmt | |||||
| 1.5-3% | USD8.00 per 0.1% As per dmt | |||||
| >3% | USD10.00 per 0.1% As per dmt | |||||
| Antimony (Sb) | (Europe) | |||||
| <0.02% | No penalty | |||||
| 0.03-0.05% | USD1.00 per 0.01% Sb per dmt | |||||
| >0.05% | USD1.50 per 0.01% Sb per dmt | |||||
| (China) | ||||||
| <0.02% | No penalty | |||||
| >0.02% | USD5.00 per 0.1% Sb per dmt | |||||
| Bismuth (Bi) | <0.05% | No penalty | ||||
| >0.05% | USD2.00 per 0.01% Bi per dmt | |||||
| Chlorine (Cl) | <0.05% | No penalty | ||||
| >0.05% | USD1.00 per 0.01% Cl per dmt | |||||
| Cadmium (Cd) | <0.03% | No penalty | ||||
| >0.03% | USD4.00 per 0.01% Cd per dmt | |||||
| Fluorine (F) | <0.03% | No penalty | ||||
| >0.03% | USD1.00 per 0.01% F per dmt | |||||
| Lead (Pb) | <3% | No penalty | ||||
| >3% | USD2.00 per 1% Pb per dmt | |||||
| Mercury (Hg) | <10 ppm | No penalty | ||||
| >10 ppm | USD1.50 per 10 ppm Hg per dmt | |||||
| Zinc (Zn) | <3% | No penalty | ||||
| >3% | USD1.50 per 1% Zn per dmt | |||||
| Alumina (Al2O3) | <4% | No penalty | ||||
| >4% | USD1.00 per 1% Al2O3 per dmt | |||||
| Nickel and Cobalt (Ni + Co) |
<0.5% | No penalty | ||||
| >0.5% | USD1.00 per 0.1% (Ni + Co) per dmt | |||||
| Selenium (Se) |
<0.03% | No penalty | ||||
| 0.03-0.05% | USD1.50 per 0.01% Se per dmt | |||||
| >0.05% | USD2.50 per 0.01% Se per dmt | |||||
| Tellurium (Te) |
<0.01% | No penalty | ||||
| 0.01-0.05% | USD4.00 per 0.01% Te per dmt | |||||
| >0.05% | USD7.00 per 0.01% Te per dmt | |||||
| Thallium (Tl) |
No presence is assumed, and only likely with Western smelters. Rare, as few copper concentrates contain thallium in sufficient quantity to require penalties Most would be naturally blended/diluted in the feed mix, however, if thallium were to present in sufficient quantities, it is possible that penalties or rejection of material would be applied. >30 ppm would therefore likely be a potential quality issue and would need to be covered off with copper smelters in contract negotiations. | |||||
| Radiation |
No presence is assumed. Radiation more than normal background levels is accepted in copper concentrates supplied to most Western copper smelters but only to a limited degree. Depending on other raw material input types in the feed mix and the overall capacity of a smelter, it is a problem that usually is eliminated by natural dilution. In sufficient quantity and volume, however, smelters will be more cautious and limit the amount of overall intake of materials with higher than background emissions, commensurate with strict | |||||
| Effective Date January 1, 2021 | Aris Gold | |||
| Page 316 of 384 |
| SRK Consulting | Soto Norte NI 43-101 – Feasibility Study |
| Element | Penalty | |||
|
health and safety laws. Uranium and thorium are the most likely elements with radioactive isotopes found in copper concentrate. China has strict radiation limits of any material imported and material therefore must comply with GB-20664-2006. | ||||
|
Silica (SiO2) |
No presence is assumed. Silica is another compound that, though not specifically deleterious, in excess in a feed mix will affect the viscosity of molten material, hindering gold absorption into matte and require increased energy input to reach melting point, however, it is rarely penalised in either Western or Chinese smelters, as many smelters will indeed add silica to the feed mix as a minimum silica content is also required for efficient slag/matte segregation, that is, it is a variable penalty/positive element. | |||
| 19.3 | Indicative Terms for Pyrite Concentrate |
Based on the feedback gathered during Phase 2 engagement with potential Offtakers, Minesa has selected indicative commercial terms as a basis for the economic evaluation, applying weighted average payables and penalty rates.
European refineries were assumed to be the sole offtakers of the copper concentrate due primarily to the ability to leverage Export Credit Agency (“ECA”) financing off the back of these contracts.
European refineries and traders are positioned to be the offtakers of the pyrite concentrate due primarily to their ability to accept large volumes of pyrite concentrate on terms that could support Project financing.
| 19.4 | Logistics |
Concentrate will be loaded into lined TEU at the processing plant. Assay samples will be taken during the loading and the TEU will be sealed and trucked to Barrancabermeja. The TEU will be transported by barge from Barrancabermeja (Impala Terminals) to Cartagena, then onwards to European and Asian smelters by sea freight. Both Barrancabermeja and Cartagena ports will provide temporary storage.
The following logistics assumptions are made:
| ● | The containers will be loaded onto a marine vessel in Cartagena for transportation to the final receiver |
| ● | Copper and pyrite concentrates are below the transportable moisture limit, are free-flowing and not agglomerated in any way (Minesa has production guarantees of not higher than 9% moisture content and a particle size P80 of 30 µm for copper concentrate and a P80 of 45 µm for pyrite concentrate) |
| ● | Copper concentrate will be shipped and sold in 1,000 wet metric ton (“wmt”) lots and pyrite concentrates will be shipped and sold in 10,000 wmt lots |
| ● | No assumptions taken for weight loss, since the concentrates will be shipped in closed containers. |
The transport to the port, port handing, assay and insurance costs are estimated to be USD72.3/wmt of copper concentrate and USD58.7/wmt of pyrite concentrate. Sea freight is in addition thereto and varies depending on receiving smelter.
| 19.5 | Confirmation by the Qualified Person |
The Qualified Person responsible for this section of this Technical Report has reviewed these studies and analyses and confirms that the results support the assumptions in the Technical Report.
| Effective Date January 1, 2021 | Aris Gold | |||
| Page 317 of 384 |
| SRK Consulting | Soto Norte NI 43-101 – Feasibility Study |
| 20 | ENVIRONMENTAL STUDIES, PERMITTING, AND SOCIAL OR COMMUNITY IMPACT |
| 20.1 | Introduction |
This section relies on the findings of:
| ● | The reports prepared as part of the ESIA process undertaken by Ingetec Ingenieros Consultores (Ingetec) as part of the Colombian environmental approval process |
| ● | The bankable environmental and social impact assessment (“BESIA”) undertaken by ERM that summarised the ESIA and addressed gaps with the International Finance Corporation Performance Standards, with the aim of satisfying potential lenders. |
Environmental and social specialists from SRK have visited site on several occasions, most recently in 2015 as part of SRK’s work on the Scoping Report for Mubadala.
The focus of this section is on potential material issues, or modifying factors, associated with environmental, permitting, and social matters. Opportunities, risks or liabilities that would generally be addressed in terms of accepted environmental practice and which do not have significant cost or management implications have not been discussed. While mining waste management and water management are discussed in this section, additional detail is provided in Sections 18.6 and 18.7 of this Technical Report.
The key issues raised in this section relate to:
| ● | The archiving of the environmental licence application by the regulatory authority, resulting in uncertainty about the likelihood, cost and timeframe for obtaining the environmental licence (Section 20.3.3) |
| ● | Potential opposition from local communities, addressed through implementation of the stakeholder engagement plan (Section 20.5), resettlement programme (Section 20.6.3) and coexistence plan (Section 20.6.5) |
| ● | Any perceived or potential impacts on water resources and water users (including communities, sensitive biodiversity and cultural sites), managed through the ABI-03 Water Management programme (Section 20.4), specific control measures (Section 20.6.1) and supported by proactive management and close monitoring of these receptors to confirm the low impact predictions |
| ● | The need for land acquisition and resettlement and potential delays to this process, managed through SOC-02 (Resettlement and Livelihood Restoration Program) and a FRAP (Section 20.6.3) |
| ● | Management of artisanal mining communities, addressed by the Coexistence Programme (Section 20.6.5) and included as SOC-012, however risk of lack of buy-in or agreement among the artisanal miners to the programme remains. |
| 20.2 | Environmental and Social Setting |
The Soto Norte project is located in the Soto Norte Province of the Santander Department. Communities located inside or in the vicinity of the area of influence are the rural municipalities of California, Suratá, Matanza, Vetas, Charta, and Tona. These six municipalities make up the province of Soto Norte.
The Project site is situated in a mountainous region with a wide range of altitudes varying from 1,620 metres
| Effective Date January 1, 2021 | Aris Gold | |||
| Page 318 of 384 |
| SRK Consulting | Soto Norte NI 43-101 – Feasibility Study |
above sea level (“masl”) to 4,200 masl. The mountains are incised by steep river valleys, with villages/hamlets scattered along the rivers hugging the slopes of the hills.
Regional monthly temperatures remain constant throughout the year, with an average of 18.5°C. Annual precipitation ranges from about 700 to 1,200 mm, with wetter months from March or April to May and then from September to November in an average year. Occult precipitation (fog and drizzle) in the páramo2 is harder to measure but is understood to have a significant influence on the maintenance of this ecosystem. Annual potential evapotranspiration ranges from about 940 to 1,450 mm. Evapotranspiration is an important influence on the catchment water balance with differences between the páramo and the lower valleys linked to orographic effects of precipitation in the páramo.
The mine area sits within the La Baja catchment, with its two key tributaries (Angostura and Paez) draining the upland páramo. The La Baja stream joins the Vetas River, which ultimately discharges into the Suratá River. The Padilla plant site, including DSF and associated water treatment facilities, have been planned in minor tributaries of the Suratá River. Larger stream flows are sustained by groundwater discharged baseflow but are highly variable in response to rainfall events.
Groundwater in the area is complex and influenced by the geology and structures in the vicinity of the project. The wider regional gneiss has low bulk permeability and deep groundwater levels (often more than 100 m below ground level at topographical highs). Groundwater eventually discharges via springs and into the streams as baseflow; there are no major groundwater abstractions (taking water from the groundwater source) in the project area. In the vicinity of the mine, the local gneiss is broken up by fault structures and veins, containing mineralised zones, resulting in higher permeability.
The project area is characterised by two main ecosystems, the High Andean Orobiome that covers 89% of the area of influence and the Sub-Andean Orobiome that mainly consists of anthropogenic transformed ecosystems. The area of influence does not contain any strategic or sensitive ecosystems, except for the priority areas for conservation established by the National Council of Economic and Social Policy-CONPES 3680. These CONPES areas currently exhibit signs of degradation or transformation of the vegetation cover. The most relevant strategic ecosystem is the páramo, however, the high elevation boundary of the Project footprint is located 300 m below the formally designated Páramo de Santurbán. Endemic and conservation status species identified in the area of influence include plant species threatened at either a regional and/or national level and six native fish species identified in the Suratá river basin, including the sardine Hemibrycon sierraensis, which previously was not known in the area.
The economy of the Department of Santander has shown strong growth in the last decade. The GDP showed a positive average variation of 4.9% from 2000 to 20153, with a slowdown in 2015 to 2016 due to the general slowing down of the Colombian economy and decline in oil prices.
Soto Norte Province has a population of approximately 23,000 inhabitants, with an estimated 3,459 located in the area of influence. The provincial economy is based on agriculture and mining related activities. These economic activities are developed differently in each of the Soto Norte municipalities. California, closest to the mine area, is dominated by agriculture, dairy and meat farming, ecotourism (which is growing in importance), and artisanal mining. Suratá, downstream of the Padilla processing and DSF area, has ranching, agriculture, and forestry as its main economic generators. The other municipalities have different
2 Páramo are high altitude mountainous ecosystems protected under Colombian law.
3 Source: http://www.camaradirecta.com/temas/indicadoresantander/indicadores/pibxdptos.htm
| Effective Date January 1, 2021 | Aris Gold | |||
| Page 319 of 384 |
| SRK Consulting | Soto Norte NI 43-101 – Feasibility Study |
combinations of the same types of livelihoods. Population dynamics in the ESIA indicate the working age population is migrating from Suratá to the mining economy in California, presumably as a result of a growing disinterest in agriculture livelihoods in Suratá in contrast to the mining opportunities in California.
| 20.3 | Legal, Permitting, and Project Approvals |
Mining activities in Colombia are subject to a constitutional framework, which establishes:
| ● | The ownership of the State over the subsoil and non-renewable natural resources located on the soil and/or in the subsoil, acknowledging the rights acquired by individuals pursuant to previous laws |
| ● | The obligation to pay royalties for the exploitation of non-renewable resources, without prejudice to other rights or compensations that are agreed |
| ● | The obligation of the State to plan the management and use of natural resources and to guarantee its sustainable development. |
This section outlines the permissions required for the project, the laws supporting these, and the current status of the key approvals required for construction and operation.
The National Government of Colombia has designated the Soto Norte Project as a mining Project of National Strategic Interest (Proyecto de Interés Nacional Estratégico). As such, the key permitting processes are undertaken at the national level. The two main regulatory agencies responsible for the permitting of the Project are:
| ● | National Mining Agency (ANM or the “Mining Authority”): the governmental authority responsible for granting exploration and mining concessions, enforcing mining legislation, and regulating and promoting the sector. The agency’s main goal is to develop a strong sector within a framework of social and environmental sustainability. |
| ● | National Bureau of Environmental Licences (ANLA): the government authority responsible for granting applications for licences, permits, and environmental procedures to develop projects that contribute to the country’s sustainable development. |
| 20.3.1 Mining | Legal Framework and Approvals |
Article 1 of the Mining Code (Law No. 685 of 2001) establishes mining as an activity of public interest. The Ministry of Mining and Energy determines the policy on mining, energy, oil and gas activities and the ANM regulates and audits mining activities. The Mining Code has been amended with the key requirements being:
| ● | The mining concession contract includes exploration and exploitation stages within a single title-the ANM shall determine if it grants the concession contract. |
| ● | The contract is subject to the laws in force on the date it was registered and thus mining titles might be subject to three different regimes, depending on their registration date: (i) the current Mining Code; or (ii) the current Mining Code as amended by Law 1382/2010 (provisionally valid between 2010 and 2013); or (iii) the current Mining Code as amended by National Development Plan Laws in 2015 and 2019. |
| ● | Applicants and assignees should provide evidence of their financial capacity for the exploration, exploitation, development and execution of the mining project (ANM’s Resolution 352 of 2018). |
| Effective Date January 1, 2021 | Aris Gold | |||
| Page 320 of 384 |
| SRK Consulting | Soto Norte NI 43-101 – Feasibility Study |
| ● | Durations and renewability of the contract and exploration/exploitation periods are stipulated along with the provisos that influence these (subject to the amendments of the Mining Code referenced above), see Table 20.1. |
| ● | Before construction can commence, an approved works and construction program (PTO) together with the associated environmental licence (discussed further below) must be obtained, see Table 20.1. |
Minesa’s Integrated Concession 095-68 contract resulted from the integration of concession contracts 095-68 and HDB-081, as approved by the ANM by means of Resolution No. 002922 dated 6 November 2015, and from an exploration program previously approved by the ANM under writ VSC No. 000210 dated 26 October 2015. The PTO was submitted in May 2017 and a mining licence granted by ANM on 13 October 2017 through resolution VSC No. 000195.
The PTO is in an amended process to align with the ESIA, and Minesa currently has a number of active programmes that include ongoing baselines studies and socialisation activities to support the PTO amendment process and to further advance Project engineering. As per global industry standards, any future PTO amendments will be submitted to the mining authority for approvals based on the Project strategic requirements and compliance with regulatory guidelines. This amendment process is reportedly a straightforward process and is not expected to affect the approved mining tonnage. The status of the environmental licence is described in Section 20.3.3.
| Effective Date January 1, 2021 | Aris Gold | |||
| Page 321 of 384 |
| SRK Consulting | Soto Norte NI 43-101– Feasibility Study |
Table 20.1: Concession Contract Description and Requirements (Source: Minesa)
| Phase | Validity (years) | Surface Fee requirement |
Works and Construction Program (PTO) requirement |
Environmental requirements | Mining and Environmental Bond |
Royalties | Reports and other Filings | |||||||
| Exploration | Three with an allowance for extensions every two years up to a total of 11 years |
Yes | No | Environmental guideline prepared sufficient for activities. Certain environmental permits for the use and/or impact of renewable natural resources may be required (i.e. water concessions, effluent discharges permit, forestry permits, riverbed occupation permits and emission permits). The removal of any forest reserves that may be cleared for mining purposes must be completed. |
Yes. 5% of planned annual expenditure. |
No | Basic mining format (“FBM”) | |||||||
| Construction | Three with one extension of one year allowed |
Yes | Yes | Requires environmental license (issued upon approval of ESIA) and PTO approved, as well as a construction license for any ‘conventional’ buildings (see below) |
Yes. 5% of planned annual investment as per the approved PTO. |
No, unless advance exploitation occurs. |
FBM Royalty declarations (In case of advance exploitation). | |||||||
| Exploitation | 30 years subtracting the number of years spent in exploration and construction and assembly + 30 years potential negotiated extension (not automatic). |
No (except for areas kept by the concessionaire to undertake additional exploration activities during a maximum period of 2 years). |
Yes | Yes. Requires Environmental License (issued upon approval of the ESIA). |
Yes. 10% of the result of multiplying the estimated annual production of the mineral at the mine’s adit for the mineral as annually determined by the government. |
Yes. Based on the law in force at the time the contract was registered in the National Mining Registry. |
FBM Royalty declarations. |
| Effective Date January 1, 2021 | Aris Gold | |||
| Page 322 of 384 |
| SRK Consulting | Soto Norte NI 43-101– Feasibility Study |
| 20.3.2 | Environmental Legal Framework |
Environmental legislation in Colombia is evolving. The general trend has been towards stricter standards and enforcement, increased fines and penalties for non-compliance, more stringent environmental assessments of proposed projects and increasing liability for companies and their officers, directors and employees.
The Environment Law (Law 99 of 1993) enabled the creation of the Ministry of the Environment (now Ministry of the Environment and Sustainable Development or “MADS”) and stipulates the process to obtain an environmental licence. The licensing process requires preparation of an environmental impact assessment (ESIA or EIA) report in accordance with the Unified Regulatory Decree of the Environment and Sustainable Development sector (Decree 1076/2015).
Regional and local environmental authorities involved in the ESIA process include the Regional Autonomous Corporations and Corporations of Sustainable Development. The Soto Norte Project lies within the jurisdiction of the Corporación Autónoma Regional Para la Defensa de la Meseta de Bucaramanga (“CDMB”). In Minesa’s area of operation, the CDMB is responsible until an environmental licence is approved by ANLA. Both MADS and ANLA are entitled to take environmental control from the Regional Autonomous Corporations on a case-by-case basis, when circumstances require it to do so and as indicated above this has happened for the Soto Norte Project. All three authorities have the following functions.
| ● | Prevent and/or suspend any activity it deems contrary to environmental standards |
| ● | Define areas excluded from mining activities (for example, forest reserves and moorland ecosystems, such as the páramo) |
| ● | Approve environmental instruments, such as environmental management plans (Planes de Manejo Ambiental or “PMA”), mining and environmental guides (“GMA”) and environmental impact assessments (Estudios de Impacto Ambiental), environmental licences, permits, concessions and authorisations. |
Exploration activities do not need approval of an ESIA and do not require an environmental licence, rather the company must comply with the guidelines established in the GMA. Additionally, if renewable natural resources will be used and/or affected, the company must file for the corresponding permits. In the case of Minesa, the necessary exploration permits have been obtained during the exploration phase (Section 20.3.4).
The ESIA needs to be prepared, presented and approved at the end of the exploration phase and must be based on the conclusions contained in the approved PTO. Construction cannot commence until the environmental licence has been obtained.
| 20.3.3 | ESIA Process History and Status |
Ingetec commenced an ESIA process on behalf of Minesa in 2016. Ingetec completed the baseline studies building on previous ESIA studies undertaken by MCS in 2016 and Servicios Ambientales y Geograficos in 2013. SRK understands collection of baseline data and engagement with
| Effective Date January 1, 2021 | Aris Gold | |||
| Page 323 of 384 |
| SRK Consulting | Soto Norte NI 43-101– Feasibility Study |
communities in some peripheral areas of the potential zone of influence has been hampered by resistance from local community leaders. This has not happened in areas where significant impacts are predicted by the ESIA specialists and Minesa indicates the data collected are statistically representative within the area of influence. However, this poses a risk there is insufficient baseline data in a few areas on the periphery of the project where potential future impacts can be confirmed. To manage this risk, SRK understands Minesa will propose monitoring locations in these areas to ANLA, and if licenced, this will give Minesa the authority it needs to establish appropriate data collection sites. In addition, the BESIA includes management and monitoring programmes that apply across a wide area, in some cases beyond the area of influence.
The ESIA report was subject to feedback consultation with local communities and regulators (referred to in Colombia as socialisation) and was submitted to ANLA in August 2017. During the evaluation process, Minesa withdrew the ESIA to facilitate a further update of the ESIA report to reflect most of the project design changes arising since the previous submission. This decision was taken to avoid lengthy licence modification processes in the future. The changes to the ESIA were subject to a second round of feedback consultation between 29 May and 22 December 2018 and the final ESIA report was filed in February 2019. The evaluation by ANLA formally recommenced on 8 March 2019 and continued according to the process (see Appendix D).
The stipulated evaluation process in Appendix D should not take more than about four months excluding requests to evaluate additional information, the lifting of bans and public hearings. After submission of the ESIA in February 2019, two scheduled site visits were completed and additional information was requested by ANLA, which was provided by Minesa in January 2020.
On 2 October 2020, ANLA issued a writ ordering the closure of the file for the study of the Soto Norte project’s environmental license, based on the consideration that the information provided in the ESIA was not sufficient to continue the environmental assessment process and issue an opinion on the viability of the Soto Norte project. Minesa was notified of such decision on 13 October 2020, and within the 10 business-days’ statutory term, Minesa filed the corresponding reconsideration request against the writ that ordered the closure of the environmental licensing process. Minesa made 10 legal arguments on why ANLA was mistaken in its decision to close the file and requested that the Authority continue with the environmental licensing process and issue a decision on the merits of the project.
ANLA issued a decision dated 19 January 2021, whereby it rejected all reconsideration requests filed against its 2 October 2020, writ (including the one filed by Minesa) and, thus, confirmed its decision to close the file on the environmental license request for the Soto Norte Project before deciding on the merits of the application. Because ANLA’s decision to close the file on the Soto Norte Project application is based on a procedural conclusion on the perceived insufficiency of the information submitted, Minesa is not barred from resubmitting a new application.
Minesa has already identified two differences between the project description in the ESIA and the feasibility study, due to the timing of the two documents, which will need to be reflected in a new environmental licence application. These include:
| ● | Change in mine design to include one main access tunnel instead of two and inclusion of |
| Effective Date January 1, 2021 | Aris Gold | |||
| Page 324 of 384 |
| SRK Consulting | Soto Norte NI 43-101 – Feasibility Study |
underground waste stopes to supply additional rockfill for Modified Avoca mining process
| ● | Relocation of the non-domestic wastewater treatment plant from the DSF to the processing plant, resulting in a change to flows of water discharge permits for the Suratá River. |
These changes, and other future design variations arising in response to ANLA’s concerns, will require additional studies including a re-evaluation of environmental and social impacts, and re-start of the environmental permitting process and timeframes.
Once approved, the environmental licence is valid for the life of the project, subject to compliance audits by the environmental authority. The licence may be modified for changes arising as the project evolves.
Bankable ESIA
To support Minesa’s plans to seek international financing for the Soto Norte Project, a BESIA was prepared in July 2019 to communicate the findings of the ESIA and provide additional information to fulfil the relevant requirements of the IFC Performance Standards. Two areas where specific gaps to the Performance Standards have been addressed by the BESIA include:
| ● | Broader assessment area: the ESIA Area of Influence was focussed on the main project site according to Colombian requirements. In addition to the main project site, the BESIA used secondary data to assess impacts from the off-site concentrate transport network and the off- site transmission line. Additional baseline studies and consultation activities are planned to fully inform management of these off-site impacts. |
| ● | Impacts on species of conservation significance: additional surveys were carried out for two International Union for Conservation of Nature (“IUCN”) critically endangered species and several IUCN endangered species identified in the Project area to complete additional elements required to comply with Performance Standard 6. |
The BESIA contains an action plan of approximately 36 additional measures required to assess or manage the impacts expected from the project in accordance with international standards. Most of these are planned for completion during the pre-construction phase. The BESIA and supporting action plan is in the process of being updated and costs for completion of action plan activities have not yet been finalised.
| 20.3.4 | Permits and Penalties |
Currently, Minesa has the licences it requires for the exploration phase of the Project. Within the area of influence, these licences consist of 8 licences for using water for industrial use (drilling, etc), one concession for potable water usage, and two licences for water treatment and discharge. A register of the permits required for construction and operation has been developed. With respect to commencing construction and moving into the exploitation phase, the key permissions are the amendment of the existing PTO to reflect changes in the ESIA, and approval of the ESIA to obtain the construction permit, followed by approval of the mining permit.
The construction permit is only applicable for those structures considered ‘conventional buildings
| Effective Date January 1, 2021 | Aris Gold | |||
| Page 325 of 384 |
| SRK Consulting | Soto Norte NI 43-101– Feasibility Study |
of a permanent nature developed within the area of the project’. In accordance with Decree-Law 19 of 2012, the infrastructure required for the exploration, exploitation, and distribution of non-renewable natural resources, among which are expressly mentioned the minerals, does not require any type of construction permit, that is, is non-conventional. The permits are requested from the competent municipal authority (local planning department) and seek to verify buildings are structurally sound (for example, able to deal with earthquakes). There is no legal definition for “conventional buildings” and interpretation of this will depend merely on technical aspects and permanence. The permit process, based on submittal of a standard form and payment of the stated fees, takes 45 business days and may be extended for 23 additional business days depending in the size and complexity of the project.
Under the terms of Law 1333 of 2009, a mining concession holder is liable for environmental remediation and other penalties arising as a result of the concession holder’s actions and/or omissions occurring after the date the concession contract is awarded. The owner is not liable for environmental liabilities that occurred prior to the concession contract, from historical activity or from illegal mining activity.
| 20.4 | Management Approach |
To guide both the ESIA process and the design engineers, an environmental basis of design was prepared by SNC that sets out the environmental standards to which the Project must adhere. Where relevant, Colombian requirements have been compared to relevant good practice standards, and the most stringent value applied to the Project.
As an outcome of the current ESIA process, a detailed EMP has been developed to guide the Project’s activities during construction and operation. The overall EMP is sub-divided into 38 programmes: 22 social plans (“SOC”), 8 biotic (“BIO”), and 8 abiotic (“ABI”). The topics covered by the programmes are presented in Table 20.2.
Table 20.2: Environmental and Social Management Programmes
| Programmes | Subprogramme and / or activities | |
| ABI-01: Management and control of atmospheric emissions and noise emissions (Our Air)
|
● Subprogram of environmental noise.
● Air subprogram | |
| ABI-02: Explosives management and vibration control program (Our Air)
|
● Management and handling of explosives
● Vibration control due to blasting
| |
| ABI-03: Water Management (Our Water) |
● Subprogram Construction of hydraulic infrastructure
● Subprogram management of the reduction of the base flow
● Subprogram Supply and installation of the pumping system from the mine to the La Baja stream
● Subprogram system of permitted catchment, conduction and discharge in the San Antonio creek ● Raw water management subprogram for any potential users affected by the decrease in the base flow
● Subprogram Efficient Use and Saving of the Water | |
| ABI-04: Non-domestic wastewater management (Our Water)
|
● Activity 1. Operation of the Non-Domestic Wastewater treatment plants ● Activity 2: Control and maintenance mechanisms
| |
| Effective Date January 1, 2021 | Aris Gold | |||
| Page 326 of 384 |
| SRK Consulting | Soto Norte NI 43-101 – Feasibility Study |
|
Programmes |
Subprogramme and / or activities | |
| ABI-05: Domestic wastewater management (Our Water) |
● Activity 1: Handling portable toilets
● Activity 2: Operation of Domestic Wastewater Treatment Plants
● Activity 3: Control and maintenance mechanisms | |
| ABI-06: Management of the organic layer of soils (Our Land) |
● Activity 1: Demarcation of areas to intervene, object of soil removal during the construction stage
● Activity 2: Removal and transport of soil (edaphic) material during the development of the project
● Activity 3: Storage and preservation of soil
● Activity 4: Restoration of the degraded areas released in the construction and assembly stage | |
| ABI-07: Management of erosion processes and geotechnical stability (Our Land) |
● Activity 1: Revegetation and grass revegetation
● Activity 2: Stabilisation of slopes with concrete and anchor bolts or tendons | |
| ABI-08: Management of solid waste and hazardous substances (For a clean project) |
● Subprogram of non-hazardous waste management
● Subprogram for handling hazardous waste | |
| BIO-01: Management of vegetal cover and terrestrial habitats (Our vegetation) |
● Subprogram of vegetation management during construction activities
● Subprogram of reconditioning of intervened areas
● Subprogram for the improvement of connectivity in areas of biotic area of influence | |
| BIO-02: Biotic compensation plan |
● The plan of compensation of the biotic component is aimed at complying with the guidelines established in the manual describing compensations and national conservation goals whereby it seeks to compensate potential biodiversity loss due to impacts that cannot be avoided, corrected, mitigated or replaced | |
| BIO-03: Conservation of endemic special conservation status and listed flora species (Our vegetation) |
● Subprogram management of arboreal, shrub and vascular and non-vascular epiphytes species with special conservation status during the phases of the Project | |
| BIO-04: Management of wildlife and endemic species with special conservation status |
● Subprogram of management of wildlife during construction ● Subprogram of wildlife management during construction and operation | |
| BIO-05: Management of aquatic life |
● Subprogram of quality management of aquatic habitats
● Subprogram for the compensation of aquatic habitats | |
| BIO-06: Management of the alteration of the visual quality of the landscape (Our landscape) |
● Subprogram of management for the prevention of the intervention of the surfaces surrounding the project
● Subprogram of landscape management in areas adjacent to surface infrastructure | |
| SOC-01: Information and community relations (Our Link) |
● Subprogram Community Service
● Subprogram Information and participation | |
| SOC-02: Resettlement and livelihood restoration (Our Family – Comprehensive Livelihood Project) |
● Subprogram of Integral resettlement in priority in rural areas of the municipalities of residence
● Subprogram of restoration of living conditions of the USPs
● Subprogram of restoration of living conditions of USRs as tenants
● Subprogram of restoration of living conditions of the USR as caretakers and administrators
● Subprogram of integral social attention to non-resident inhabitants dependent on the properties
● Maintenance subprogram of the existing conditions of the receiving population (Conditional on the results of the census and characterisation study and if applicable)
● Maintenance subprogram of the existing conditions of the population that remains residing in the areas subject to any involuntary transfers (Conditioned | |
| Effective Date January 1, 2021 | Aris Gold | |||
| Page 327 of 384 |
| SRK Consulting | Soto Norte NI 43-101 – Feasibility Study |
|
Programmes |
Subprogramme and / or activities | |
|
to the results of the characterisation study)
● Subprogram of property purchase and payment of improvements and infrastructures (with advice and social, technical and legal support) | ||
|
SOC-03: Migration assistance (My Quality of Life) |
● Subprogram of immigration monitoring
● Subprogram of psychosocial care, sexual and reproductive health
● Subprogram of monitoring strengthening public and social services | |
|
SOC-04: Employment management associated with the project (My Job) |
● Subprogram of local employment generation (for the link)
● Subprogram of preparation of the new scenario due to loss of employment source at project closure | |
|
SOC-05: Formalisation and strengthening of the supply of local goods and services (My Company) |
● Subprogram of strengthening activities that provide local goods and services to meet project requirements (suppliers to MINESA)
● Subprogram strengthening the production of alternative economic activities | |
|
SOC-06: Safety, maintenance and road mobility (Our Road Safety) |
● Subprogram for improvement, maintenance, signaling and road safety on the Suratá-California-Angosturas road ● Subprogram of awareness and training in road safety and mobility | |
|
SOC-07: Replacement of community infrastructure affected by the project (Our infrastructure to be restored) |
||
|
SOC-08: Strengthening of community participation and local public institutional capacity (Our Organization) |
● Formative line of leadership and diagnosis
● Line of civil society organization | |
|
SOC-09: Strengthening of local cultural traditions, values and practices (Proud to be Citizens of California and Suratá) |
● Memory and identity subprogram
● Sustainable and sustainable rural community subprogram | |
|
SOC-10: Environmental education (Our Environment) |
||
|
SOC-11: My countryside (My countryside) |
● Subprogram of Support to Local Productive Units ● Subprogram of Impulse to Value Chains and Marketing Networks ● Management Subprogram for Inter-institutional Support | |
|
SOC-12: Mining coexistence (Mining Coexistence) |
||
|
SOC-13: Archaeological management plan (Our Archaeological Heritage) |
||
|
SOC-14: Our people (Our People) |
● Subprogram of attention to the elderly in vulnerable condition
● Subprogram of care for people with disabilities | |
|
SOC-15: Taking care of our health (Our health) |
||
|
SOC-16: Management for tourism support (Our Territory, A Tourist Destination) |
||
|
SOC-17: Social compensation (Infrastructure to meet local requirements) (My Territory) |
● Subprogram of identification, planning and design
● Subprogram of inter-institutional construction and articulation, endowment, agenda and sustainable operation | |
|
SOC-18: Our present and our future (Our present and our future) |
● Subprogram Training of young environmental leaders ● Subprogram for the use and promotion of technological tools applicable to the | |
| Effective Date January 1, 2021 | Aris Gold | |||
| Page 328 of 384 |
| SRK Consulting | Soto Norte NI 43-101 – Feasibility Study |
|
Programmes |
Subprogramme and / or activities | |
|
environmental field
● Subprogram for the creation of a virtual youth community with an environmental focus
● Communication strategy subprogram from a youth perspective and with an environmental approach
● Subprogram for the promotion of environmental productive initiatives led by the youth of California and Suratá | ||
|
SOC-19: Spreading our knowledge (Spreading Our Knowledge) |
||
|
SOC-20: Strengthening our municipality (Our municipality) |
● Line 1 capacity building for the public function
● Line 2 strengthening local public institutions | |
|
SOC-21: Inclusion and rights program (New relationships-New Soto Norte) |
● Subprogram for generating opportunities for women in California and Suratá
● Subprogram for the implementation of a policy of zero tolerance for gender violence in the development of the Soto Norte Project | |
|
SOC-22: Management for local planning (Management of our territory) |
||
|
Voluntary programmes |
||
|
Bio-07: Special Management Program for Sardine Hemibrycon sierraensis (Voluntary programme) |
● Characterise the population, trophic and reproductive structure of Hemibrycon sierraensis in the upper basin of the Suratá river | |
|
Bio-08: Special management strategy for High mountain ecosystems (Voluntary programme) |
● Contemplates the characterisation, modeling and prioritization of areas to be managed
● Develop the strategies for the acquisition of properties considered of high importance
● Implementation of reforestation strategies (natural and / or assisted), rehabilitation
● Participatory research, to strengthen the resilience and health of ecosystems | |
Each programme has a dedicated monitoring plan to enable the effectiveness of the proposed management measures to be evaluated and to confirm there are no unacceptable impacts occurring. Monitoring will also provide information to the authorities and other stakeholders on environmental and social issues. The exact areas to be monitored along with the monitoring parameters will be approved through the ESIA process by ANLA.
As part of the ESIA (Chapter 10), Minesa also has an emergency response and readiness plan in line with GIIP requirements.
In terms of costing the actions presented in Table 20.2, Minesa recognises the following:
| ● | Each of the programmes has a detailed cost sheet incorporated into an overall EMP budget. The total provision for implementing the EMP, including post-closure activities, is estimated at USD116m. |
| ● | In accordance with Resolution No. 256 of 2018, the objective of the biotic compensation plan (Programme BIO-02) is to develop compensation scenarios due to biodiversity loss during Project implementation, operation and closure. Using appropriate compensation factors, the compensation area for Soto Norte is equivalent to 391.59 ha. ANLA will evaluate the |
| Effective Date January 1, 2021 | Aris Gold | |||
| Page 329 of 384 |
| SRK Consulting | Soto Norte NI 43-101 – Feasibility Study |
| compensation options presented in the ESIA and will indicate how and where the definitive compensation plan should be implemented, with the final decision taken after the environmental licence is granted. Additionally, the project will compensate additional areas as part of its voluntary program “Special management strategy for High mountain ecosystems” that will be defined after the decision of granting the environmental license. The EMP includes an allowance of USD9m for these programmes, with an additional USD1.5m for monitoring. |
| ● | The 1% Investment Plan was developed in response to Decree 2099 of 2016 that dictates a value of not less than 1% the value of the project’s capital expenditure and associated development costs must be invested in environmental and/or sustainability related projects. In accordance with the investment rules, Minesa indicated in its ESIA application that its investment plan would consider projects focused on management of water resources, management of environmental heritage and management of biodiversity and its ecosystem services. Funds from the 1% investment plan will be managed by the CDMB based on the programs jointly identified with Minesa, as part of the corporate governance framework. |
Minesa intends to develop an integrated Environmental-Social Management System (“ESMS”) to implement the management plans developed through the ESIA process. Organograms of the proposed environment, health and safety (“H&S”), and community departments have been prepared and indicate Minesa has recognised the need for comprehensive human resources to ensure the identified management measures can be successfully implemented. For operations, the organogram indicates the environment, social and community relations managers’ report to the Sustainability Director, who in turn reports to the CEO. The H&S manager sits within the operational management department, reporting through the GMO.
Contractors are currently required to adhere to a number of environmental requirements as stipulated in their contracts. Contractors will be expected to adhere to and receive training on Minesa’s various environment, community and health and safety policies and standards.
| 20.5 | Stakeholder Engagement and Social Licence to Operate |
| 20.5.1 | Stakeholder Engagement |
Minesa has a stakeholder management plan that was developed in 2016 and is regularly updated. The objective of the plan is to facilitate the approval of the ESIA, and the communication strategy is being modified to co-ordinate post-approval topics such as land purchases, resettlement and communicating the EMP.
According to the BESIA and ESIA, Minesa completed a stakeholder identification process to define those who may be impacted by the Project, those with a particular interest in the Project, and those specifically involved in the implementation of the Project. Minesa included local, regional and national government, as well as community leaders from Suratá and California, residential social units from Suratá and California, neighbouring communities (Soto Norte Province and Bucaramanga), the education sector, the media, organizations from both municipalities, and other regional and national organizations in this identification process.
Minesa’s stakeholder engagement activities to date have mainly focussed on information disclosure
| Effective Date January 1, 2021 | Aris Gold | |||
| Page 330 of 384 |
| SRK Consulting | Soto Norte NI 43-101 – Feasibility Study |
of the ESIA, known in Colombia as ‘socialisation’. Minesa has carried out ten engagement phases between February 2017 and January 2020 to disclose information on the process of preparing and filing the ESIA (earlier engagements were undertaken by the previous owners so there is wide familiarity of the Project in the region):
| ● | Phase 1: Information and engagement meetings on activities associated with preparing the ESIA and presentation of the Project (February, March and April 2017). |
| ● | Phase 2: Land use planning and characterisation workshops (March 2017). |
| ● | Phase 3: Presentation and validation of baseline data (characterisation of abiotic, biotic, and socioeconomic environments), detailed description of the Project and workshops to identify and assess impacts and possible measures for managing them (May 2017). |
| ● | Phase 4: Dissemination of the results of the 2017 ESIA (July 2017). |
| ● | Phase 5: Meeting entitled “Where are we going?” aimed at reporting milestones for the filing of the ESIA with environmental authorities and explaining how the process will proceed (September 2017). |
| ● | Phase 6: Dissemination of the revised ESIA to include additional information required by the ANLA (January 2018 and June 2018). |
| ● | Phase 7: Consultation on the 2018 ESIA process: Home by home socialisation, workshops on the topics that most concern the community, changes to the project and proposals to the management plan. (May to June 2018). |
| ● | Phase 8: Consultation on content of updated ESIA prior to filing with ANLA (December 2018) |
| ● | Phase 9:9a Home by home socialisation and distribution of booklet on content of updated ESIA filed with ANLA (March 2019), 9b and 9c Workshops and further re-enforcement of optimised impacts and management measures (November-December 2019). |
| ● | Phase 10: Consultation of content of updated ESIA prior to filing with ANLA (January 2020). |
In addition to the ESIA socialisation process, Minesa has implemented site visits and presentations for stakeholders outside the area of influence, that could not take part in the socialisation process. These stakeholders include universities and academic institutions, businesspeople, trade unions and committees, social and community leaders from Bucaramanga and its metropolitan area, journalists and opinion leaders among others.
Details of the concerns raised during this extensive stakeholder engagement exercise are given in the ESIA and summarised in the BESIA. The main concerns expressed by the communities related to Minesa’s social programs and social investment, concerns regarding the increased population with respect to water availability, impacts on water resources, and resettlement (Section 20.6.3).
Minesa will develop the Project, specifically its EMP, in consultation with communities and authorities. Many of the management programmes (Table 20.2 in Section 20.4) include addressing impacts that involve decision-making by the families living in the area of influence, and therefore the nature of these programmes will be participatory. Stakeholders will also be involved in external
| Effective Date January 1, 2021 | Aris Gold | |||
| Page 331 of 384 |
| SRK Consulting | Soto Norte NI 43-101 – Feasibility Study |
monitoring of the project to further promote a transparent relationship between the project and surrounding communities.
To maintain ongoing communication with stakeholders through construction and operation and provide information to the public in a timely manner, Minesa has opened: three social centres or “casa social” in Suratá, California and Matanza; one specific centre in California for the mining coexistence programme; and two centres for the resettlement programme (one in Suratá and one in California). For those not in the area of influence (for example in Bucaramanga), Minesa has implemented a mobile classroom and site visits.
Minesa has a Grievances, Claims and Suggestions Response System (“GCSRS”) that provides a process for recording and responding to grievances in a timely manner. Grievances can be raised through dedicated mailboxes in local communities, or via general post, email and phone. The system is publicly advertised on Minesa’s website.
| 20.5.2 | Corporate Social Responsibility |
Minesa’s social management model was formulated in a participative way based on meetings with the different communities of the municipalities of California, Suratá, Matanza, Vetas, and Charta. Minesa has already undertaken a number of social, labour and community related programmes with the aim of meeting the above stated objectives. Since mid-2016, Minesa’s Corporate Social Responsibility (“CSR”) plan has been generating programmes focused on infrastructure, education for children, access to and the protection of water, promotion of culture and traditions, promotion of local entrepreneurship and co-existence with local miners, these being the key issues identified as important to both Minesa and the Soto Norte community by means of focus group discussions. The programmes implemented to date will be updated to include obligations from the social EMP documented in Table 20.2.
In addition to CSR programmes, Minesa has established a series of alliances with NGOs, universities and other organisations and some of these alliances are incorporated into Minesa CSR plan. Examples of strategic alliances established by Minesa in support of the above programmes includes:
| ● | The protection of children and child rights (UNICEF) |
| ● | Water and sustainable use (University of British Columbia and Critical Resources) |
| ● | Agriculture and a sustainable economy for local subsistence farmers Corporación Colombia Internacional (“CCI”) |
| ● | Biodiversity and environmental management (Conservation International) |
| ● | Traditional mining and the development of a coexistence platform (University Santo Thomas and the Federation of Municipalities) |
| ● | Organising training courses to improve opportunities for local recruitment (National Learning Service, “SENA”). |
| 20.5.3 | Social Licence to Operate |
| Effective Date January 1, 2021 | Aris Gold | |||
| Page 332 of 384 |
| SRK Consulting | Soto Norte NI 43-101 – Feasibility Study |
Minesa monitors the perceptions of its stakeholders to the project through analysis of Stakeholder Management Plan indicators, monitoring media and social networks, and surveys by independent sources.
Based on the findings of a perceptions survey in November 2018, the project is supported to different extents by the communities in California, Suratá and Matanza. Support for the project, mainly in California and Matanza, is largely due to the economic expectations of the local communities in relation to jobs and service development. As part of the Stakeholder Management Plan, the Minesa hiring policy will aim to prioritise suitably qualified inhabitants of the region for production and administrative positions. The policy is active and training has already started for production positions.
Minesa acknowledges the risks associated with potential opposition from local communities. The risk register rates ‘loss of social licence to operate’ and ‘community unrest’ as very high and risk of protests, demonstrations or blockages as high. Key management programmes to address these risks include the stakeholder engagement plan, resettlement programme and coexistence plan. If successfully implemented, these management plans should facilitate maintaining public support in those areas closest to the mine, but communities further away and potentially not experiencing the same level of benefits may still be a source of risk.
| 20.6 | Management of Potentially Material Environmental and Social Matters |
This section presents the perceived or potential bio-physical or socio-economic issues that have influenced or have the potential to influence the Project in a material way. Perceived and potential impacts are discussed where relevant along with how the project design or operational management of these issues is proposed to be handled. The issues below are based on consideration of the BESIA, the work completed as of the Effective date of this technical report and SRK’s groundwater study (SRK, 2017 and 2019b).
| 20.6.1 | Water Resource Management |
The importance of water resources in the vicinity of the Project was recognised early in the Project development process. Several studies were commissioned to collect and evaluate baseline data and use these to develop conceptual and numerical models to evaluate the potential impacts (Section 18.7). This work includes: periodic flow accretion survey along the main streams; inventory of water users and uses, wells, water springs; baseline water quality analysis comprising chemical composition and field parameters (temperature, conductivity, dissolved oxygen); groundwater level and quality monitoring by means of piezometers, springs and existing underground mine workings; hydraulic testing of soil and sub-soil materials; and isotopic analysis on stream water and groundwater; amongst others. Surface water flow, groundwater movement, and solute transport models were used to characterise potential water resource impacts and input into Project design.
Groundwater drawdown management
Due to the greater permeability of the rocks around the mine workings, inflow of groundwater is expected. This inflow will be managed by grouting certain areas to minimise the volumes entering the workings and by directing inflow to a water treatment plant so that it can be treated and
| Effective Date January 1, 2021 | Aris Gold | |||
| Page 333 of 384 |
| SRK Consulting | Soto Norte NI 43-101 – Feasibility Study |
discharged. The groundwater modelling predicts a zone of drawdown around the workings and the Padilla access tunnel over the life of the mine.
From an ecological perspective, there are two perceived or potential issues related to groundwater:
| ● | Potential risks to aquatic ecosystems reliant on the La Baja stream, which may be affected during periods of dry weather when the rivers are no longer fed by groundwater discharge (instead they become a source of groundwater recharge). Minesa will monitor the flow in the La Baja stream in accordance with standard industry practices and will add water to the system to maintain minimum ecological flow requirements, as determined in agreement with ANLA. |
| ● | Perceived risks to the sensitive páramo habitat located upgradient of the mine workings. The risk of dewatering activities impacting the ecologically sensitive vegetation of the páramo is negligible. Shallow groundwater conditions are present within the páramos as a result of low permeability gneiss, with the vegetation relying on occult precipitation (fog and drizzle) and reduced evapotranspiration to sustain its ecologically sensitive vegetation. There is limited hydraulic connection between the páramos and the La Baja valley, and its moisture rich organic superficial soils are disassociated from the deeper groundwater. Furthermore, no dewatering impacts are expected to propagate as far as the páramo as the mine intends to pre-grout areas of inflow potential where necessary, particularly in the La Bodega zone to the east and closest to the páramo. |
Based on the groundwater modelling, the main water supplies to villages like California are not expected to be impacted by the drawdown. Minesa has guaranteed in the EMP (ABI-03 Water Management) the availability of water resources for users potentially affected by impacts from drawdown (if any) or changes to stream flow. A cultural spring at El Pocito is expected to be impacted during the dry months, discussed further in Section 20.6.2 for which there is also a management plan (SOC-13).
Extractive waste management
Geochemical studies have been completed to develop an understanding of the weathering behaviour of the mine waste (dry filtered tailings and waste rock) and exposed materials in the underground mine, and to ascertain whether contact waters could present a risk to the environment through acid rock drainage and/or metal leaching (“ARDML”) during operations and on closure. The geochemical prediction calculations covered underground mine water quality and post-closure water quality impacts on surface and groundwater, as well as waste and dry filtered tailings operational and post-closure water quality.
Based on kinetic testing data, it is considered the dry filtered tailings are unlikely to generate acid during operations if the surface is continually renewed by deposition of fresh dry filtered tailings. The waste rock deposited in the DSF will likely be acid generating, however, as the materials will be co-disposed, the waste rock will be buried/smothered by compacted dry filtered tailings, limiting the oxidation and acid release. Therefore, the overall composition of the DSF drainage is dependent upon the balance between dry filtered tailings and waste rock deposited each year. During years 1 to 19 when there are higher proportions of waste rock deposited than dry filtered tailings, the contact
| Effective Date January 1, 2021 | Aris Gold | |||
| Page 334 of 384 |
| SRK Consulting | Soto Norte NI 43-101 – Feasibility Study |
waters are predicted to be acidic with elevated solute release, which will be treated prior to discharge to meet the required effluent standards. The models predict the drainage from the DSF could need treatment up to around Year 20. From Year 20 when the quantity of waste rock decreases, the contact waters are expected to be circum-neutral, reducing solubility of several metal/metalloids except for zinc, which is also predicted to fall below discharge limits from year 22 onwards. Towards the end of mine life, the water quality could improve to below the proposed mine effluent standards, and the drainage flow may not need treatment, although the period for the quality to improve is not certain.
The use of emulsion explosives underground will mean there is residue on the waste rock that will report to the DSF. Flushing of the explosive residue is expected to give rise to elevated concentrations of ammonia and nitrate that will be treated if required.
Subject to pilot testing, the DSF seepage will be passed through a high-density sludge plant to remove metals, an ion exchange plant to remove uranium (if required) and a rotating biological contactor to remove nitrogen species. At closure, the DSF will be covered with a low permeability cover to reduce infiltration. This will decrease the rate of drainage from the facility. Current predictions from the groundwater model suggest the seepage at closure from the DSF will not require treatment to meet effluent limits but this will continue to be confirmed as the Project progresses.
The predicted composition of the underground contact water is expected to remain around pH 8 and the concentrations of several metal constituents are not expected to exceed the mine water effluent standards, however, the models predict concentrations of cadmium and zinc could exceed the proposed feasibility study effluent criteria, which will be treated to the necessary standard, if required. Initial sulphate concentrations are likely to be relatively high (around 500 to 800 mg/L) due to the inflow of high sulphate deep groundwater but levels are predicted to remain under the effluent limit of 1,200 mg/L. Mercury has the potential to be an issue, but due to the low concentrations and frequent data analyses issues, no confidence can be placed in the prediction of this metal’s behaviour, however, as water treatment for zinc will also remove any mercury present, it is not considered an issue. Overall, the models indicate that treatment may be required, but that solute loading could potentially be reduced by optimising the management of waste rock backfill. For instance, cementing or encapsulating the waste rock to reduce the contact/flushing could reduce the rate of solute release and therefore reduce the treatment requirements.
A review of the proposed water treatment methods is previously discussed in Section 18.7.2.
Water supply management
During operations, the water balance indicates the Project’s water supply needs can be met internally by using contact water, treated as necessary. During construction, there will be a need for make-up water direct from the environment, in which case permitted quantities of water will be taken from the Suratá River (construction in Padilla area), La Baja stream (construction at Emboque), San Juan stream (construction in El Cuatro area) and San Antonio (to maintain flow at El Pocito site).
Summary
| Effective Date January 1, 2021 | Aris Gold | |||
| Page 335 of 384 |
| SRK Consulting | Soto Norte NI 43-101 – Feasibility Study |
Impacts on water resources are an emotive issue for stakeholders and a sensitive issue for regulators. Through the ESIA and supported by modelling and analyses, Minesa has outlined specific management measures to mitigate, control and monitor the impacts on water resources in the area of influence in management programmes (ABI-03 Water Management and ABI-04 Non-domestic Wastewater Management), including:
| ● | Design and construction of a local aqueduct (reticulation system) to supply water for the community that may potentially be impacted by mining-related drawdown and stream baseflow reduction |
| ● | Implementation of grouting and dewatering strategies in the underground mine design and operation to avoid impacts on the páramo ecosystem, and to reduce the baseflow alteration on streams |
| ● | Implementation of water management and treatment systems for wastewater from the DSF, underground mine, processing plant, camps, offices, etc to comply with National regulated effluent limits. |
Given the sensitivity of water-related aspects in underground mining, Minesa has committed to implementing robust follow-up and monitoring plans to control the effectiveness of the outlined measures, which are expected to be scrutinised by regulators, academic and professional organizations, local communities, government and other key stakeholders. The costs for implementing these measures are included as either capital and/or operational costs for each individual project component.
The impacts and associated management programmes related to water resources have been presented to stakeholders inside and outside the area of influence (local and regional communities, mining and environmental authorities, government officials, academic representatives, etc), by means of the ongoing socialisation and communication process (Section 20.5.1).
| 20.6.2 | Cultural Heritage and Archaeology |
Hydrogeological modelling of the potential zone and extent of impact (Section 20.6.1) has shown that the cultural site of El Pocito (a natural spring where religious activities are undertaken) may be dried up during certain times of the year. Minesa has developed a management sub-programme within the ‘Our Water’ programme (ABI-03 Water Management) to maintain the same hydraulic conditions that feed it at present. This will involve using water extracted from the San Antonio stream (0.5 L/s) being transferred and discharged at the El Pocito location to ensure water flows during the dry season. A preliminary cost provision of USD800k has been determined for the design and implementation of the water reticulation system to potentially affected receptors as part of the water management programme (ABI-03).
| 20.6.3 | Land Acquisition and Resettlement |
Additional land acquisition for construction and operation of the Project will result in physical displacement (relocation) and economic displacement (loss of assets or access to assets affecting livelihood) for some members of the surrounding communities. If purchase cannot be mutually agreed, a mechanism for expropriation does exist. Expropriation authorisation must be obtained
| Effective Date January 1, 2021 | Aris Gold | |||
| Page 336 of 384 |
| SRK Consulting | Soto Norte NI 43-101 – Feasibility Study |
from the Ministry of Mines and Energy prior to starting the process.
Minesa has undertaken efforts to minimise the scope of displacement through design modifications and alternatives to the Project’s footprint, resulting in a reduction from 827 to 755 ha. Further Project refinements may cause minor alternations to the resettlement footprint, however, based on the anticipated Project footprint, Minesa has identified 85 properties that will need to be acquired, provisionally affecting 213 households. Minesa is still evaluating the areas to which affected households will be relocated to determine their appropriateness in terms of proximity to point of origin, availability of land, and similar productive capacity to enable continuity of livelihoods for affected populations.
In terms of the impact assessment, resettlement was identified as the most significant negative impact of the Project and consequently is a key focus of the management programs presented in Section 20.4, particularly SOC-02 (Resettlement and Livelihood Restoration Program). Minesa has developed a FRAP to guide the resettlement planning process and undertaken the necessary studies and negotiations required to prepare a final Resettlement Action Plan (RAP). Minesa intends to manage resettlement impacts in compliance with Colombian regulations and in accordance with the IFC Performance Standards. Implementation of the RAP will commence when the Project’s environmental licence is issued and is expected to take four years. Resettlement will be carried out in phases to facilitate construction commencing nine months following receipt of the environmental licence. As the environmental licence has not been issued, the resettlement process has not commenced. An implementation schedule has been completed that lists a suite of activities to be completed prior to, and post, the start of implementation. A budget of USD38m is included in the EMP costs to implement this program.
Although the proposed activities and schedule appear to be reasonable, there is a risk the land acquisition and resettlement process, or phases of the process, may take longer than currently envisaged, particularly if expropriation is required. Minesa has developed a strategy to deal with reluctant households to mitigate this risk and effect of delays on the construction schedule. Minesa also recognises the risk of additional resettlement requirements from future design modifications, and from land-related interventions in the additional project assessment area (road from Padilla to Bucaramanga), beyond the scope currently expected.
| 20.6.4 | Local Community Participation |
In line with Minesa’s social commitments, Minesa is currently targeting 60% of the workforce to be drawn from the local community, with a further 20% being drawn from the department of Santander. It is envisaged another 18% will come from other departments in Colombia and foreign technical and managerial specialists will only make up 2% of the entire Project workforce. The local content may increase in the future as the output of the different learning programmes is realised.
Minesa will develop a contracting and procurement strategy targeting an optimum level of opportunities for local resources, both in terms of labour, equipment, and services and in compliance with the Minesa local sustaining objectives. A responsibility to train and increase the skills level of the local work force is clearly stated in the management programmes, primarily SOC- 05 Formalisation and strengthening of the supply of local goods and services.
| Effective Date January 1, 2021 | Aris Gold | |||
| Page 337 of 384 |
| SRK Consulting | Soto Norte NI 43-101 – Feasibility Study |
The involvement of local communities in development of the different CSR programmes (Sections 20.4 and 20.5.2) should also facilitate local communities seeing direct benefits. Social monitoring programmes to verify the implementation of the CSR programmes are included in the ESIA/BESIA.
| 20.6.5 | Artisanal Mining and Historical Liabilities |
Historically, Minesa’s current tenement areas were held by artisanal miners with small concessions. Significant environmental effects have arisen from these historical workings and processing plants, with monitoring data showing impacts on the La Baja River. Existing adits continue to discharge water affected by ARDML, and there is erosion and mobilisation of sediments near the mine workings and processing areas, however, this small-scale mining also provides a significant contribution to local livelihoods.
These small concessions were acquired by successive companies, and lastly by Minesa, with the aim of consolidating a large-scale operation, the Soto Norte Project. Workers of those former tenements were dismissed but continued with illegal mining activities within the now Integrated Concession area. Minesa has notified the mining agency for the relevant risk mitigation actions, which are under review. The Mining Code provides for a legal mechanism in favour of the title holder for disturbances in the area of a mining title caused by third parties (in this case, the illegal miners), called administrative relief (“amparo administrativo”). This includes the eviction of illegal miners from the concession area. As of December 2019, Minesa has submitted 60 applications in the area of Mining Title 095-68. Legal action is also possible under the Colombia Penal Code for environmental crimes caused by illegal mining.
Rather than pursuing criminal prosecution, Minesa is prioritising formalisation of the artisanal activities within the concession area through development and implementation of the Coexistence Programme (SOC-12: Mining Coexistence). The purpose of this programme is to help artisanal miners to develop a small-scale mining collective that complies with environmental, labour, technical, and financial requirements. Minesa identified a suitable area within its mining concessions for the miners to carry out their currently disperse activities in a more concentrated and formalised manner that reduces environmental impact and increases physical and social security for those involved.
To date, the negotiations for the mining development proposal for informal miners (Calimineros) have been completed. The signing of the Formalisation Subcontract, as well as the start and filing of an EIA and the PTO for the formalised activities, is planned for the months following the receipt of the environmental license for the Soto Norte Project. Negotiations with traditional miners (considered separately from informal miners) have commenced and a business proposal is planned with similar terms to the informal miners. A budget of USD5M has been identified as part of the EMP to fund the remaining implementation of the Coexistence Programme.
Although the legislation makes it clear that Minesa is not responsible for the environmental liabilities associated with historical artisanal workings (Section 20.3), Minesa is working with regulatory authorities to remediate damage where possible. ANM has issued a resolution (VSC-545) giving Minesa permission to close unauthorised mine entrances excavated by illegal miners within Minesa’s 095-68 mining title. Minesa is therefore monitoring the water quality within its concessions at a number of monitoring points that includes areas of historical process plants, artisanal and illegal
| Effective Date January 1, 2021 | Aris Gold | |||
| Page 338 of 384 |
| SRK Consulting | Soto Norte NI 43-101 – Feasibility Study |
mining tunnels. It has been sealing off illegal mines as part of a mine closure program and it has an ongoing program of disassembling process plants and removing contaminants left behind due to past mining and processing activities. Minesa intends to fund ongoing rehabilitation out of its 1% Investment Plan (Section 20.4).
SRK considers the approach taken to management of artisanal miners is aligned with the requirements of GIIP, however, the programme has residual risks associated with it, such as a shortfall between the number of informal miners and available jobs and a risk of lack of buy-in or agreement among the informal and traditional miners to the programme. Minesa has measures in place to address these risks and will conduct ongoing analysis and monitoring for compliance with relevant domestic and international laws, as well as to reduce social risks associated with the programme.
| 20.7 | Closure Requirements and Costs |
The ESIA includes a conceptual closure plan. This provides information on the closure process and measures that will be implemented during the closure of the project and to comply with the requirements of ANLA, the Mining Law of Colombia and GIIP. This plan also addresses temporary closure and progressive rehabilitation. The current plan will be reviewed every five years.
At this stage of the Project development, the plan is generic in nature and contains the measures SRK would normally expect for a project of this type. Post closure monitoring is indicated. The plan acknowledges the need for community input into future revisions and it is acknowledged the various social management programmes (Table 20.2) include commitments that contribute towards social transitioning and long-term sustainable benefits arising from the Project. The plan will be modified in future to reflect changes to the project footprint.
SRK notes the closure concepts include the continuing operation of the non-domestic wastewater treatment plants for the underground mine and the DSF until the groundwater rebound process is complete, seepage ceases or is considered chemically stable and meets criteria for discharge into the environment. For the mine, the groundwater model estimates rebound to take between 3 and 10 years, depending on the rebound approach, after which treatment may still be required to meet discharge limits. Assuming installation of the DSF cover, the groundwater model predicts DSF seepage to meet discharge limits at closure, therefore minimal treatment may be required.
The closure cost that will be submitted with the new ESIA will be updated to meet the IFC Performance Standards, and to reflect the project scale, including an allowance for post closure water treatment of the mine effluent beyond closure. Depending on what is required, this has the potential to be material at the end of life of mine. The closure plan and costs will be reviewed every five years to ensure close alignment with amounts considered in the economic analysis.
The financial model includes USD41m as a book provision to be incurred at the end of the life of mine. In addition to this, there is 17 years of post-closure monitoring at USD1m per year. Subject to the points above, the sum is in the order of magnitude that might be expected for a project of this type.
The Mining Code requires a mining and environmental bond to be established for each concession.
| Effective Date January 1, 2021 | Aris Gold | |||
| Page 339 of 384 |
| SRK Consulting | Soto Norte NI 43-101 – Feasibility Study |
Minesa will take out an insurance policy to cover potential environmental and mining liabilities for a value equivalent to 5% of the annual investment projected at the construction and assembly stage.
| 20.8 | Conclusion, Risks and Opportunities |
The regulatory regime in Colombia is robust and, in most cases, aligned with GIIP as represented by the IFC Performance Standards. Where gaps exist, Minesa has identified this and put plans in place to address this once the Colombian requirements have been met.
While the environmental and social studies are considered sufficiently advanced to meet FS level, in SRK’s view there are some areas of uncertainty and risk.
| ● | The regulatory authority, ANLA, has closed the file for the study of the Soto Norte project’s environmental license, stating that the information provided in the ESIA was not sufficient to continue the environmental assessment process and issue an opinion on the viability of the Soto Norte project, resulting in uncertainty about the likelihood, cost and timeframe for obtaining the environmental licence. However, because ANLA’s decision to close the file on the application is based a procedural conclusion, Minesa is not barred from resubmitting a new application. |
| ● | There are known sensitivities in terms of biodiversity (protected habitats and species of conservation importance) and cultural heritage (sacred springs) that have the potential to be affected directly by the project. Although extensive work to understand these impacts has been undertaken, there is inherent risk in the impact modelling and so Minesa will proactively manage and closely monitor these receptors to confirm the low impact predictions. |
| ● | There are both positive and negative social impacts arising from the project along with existing tensions that are not directly related to the project. Examples of tensions include the national government’s plans to eliminate non-compliant mining operations such as illegal small-scale mining. The negative impacts and tensions have the potential to lead to community opposition. Extensive programmes to address areas like artisanal mining, leadership capacity building, community planning and social development aim to target potential areas of concern. |
| ● | As per Colombian legislation, the resettlement process may commence upon issue of the Project’s environmental licence and is expected to take four years. As the environmental licence has not been issued, the resettlement process has not commenced. A framework resettlement action plan (FRAP) has been developed to guide the resettlement planning process and necessary studies and negotiations required to prepare a final RAP and to reach a formal agreement with the affected communities following receipt of the environmental license. There is a risk the land acquisition and resettlement process may take longer than envisaged, particularly if expropriation is required. |
| ● | Geochemical characterisation has been undertaken by SNC and SRK to inform the design of water containment and treatment facilities at the site. Water treatment at various locations will be implemented to address the predicted acid rock drainage and metal leaching of waste rock, dry filtered tailings and mine working contact water. SRK has identified that further optimisation studies are required to ensure the chosen treatment technologies will produce the required discharge quality. This will then need to be confirmed through bench scale and pilot scale |
| Effective Date January 1, 2021 | Aris Gold | |||
| Page 340 of 384 |
| SRK Consulting | Soto Norte NI 43-101 – Feasibility Study |
| testing. Given the sensitivity of water-related aspects in underground mining, Minesa will implement robust follow-up and monitoring plans to control the effectiveness of the outlined measures. |
| ● | Further work is required on the closure plan and cost estimate, particularly with respect to the potential for post closure management of water. |
Minesa has an opportunity to build on its ongoing community development initiatives to maintain its social licence to operate and, by showing a proactive approach to both environmental and social management, show how modern mining can enhance an area rather than degrade it. The management and monitoring are clearly laid out in the ESIA and should assist in managing the above risks and uncertainties.
| Effective Date January 1, 2021 | Aris Gold | |||
| Page 341 of 384 |
| SRK Consulting | Soto Norte NI 43-101 – Feasibility Study |
| 21 | CAPITAL AND OPERATING COSTS |
| 21.1 | Capital Cost Estimates |
| 21.1.1 | Introduction |
The Project cost estimates are in varying stages of development depending on the scope of work, requiring various estimating approaches and resulting in variable levels of accuracy throughout the estimate of capital costs.
SNC reviewed and enhanced elements of the scopes of work (Table 21.1) and provided an assessment of the Project costs based on these technical and commercial reviews. The estimate collectively presents the entire costs for the Soto Norte Project, including the owner’s scope, client’s sub-consultants scope and Minesa´s consultant’s scope.
The capital cost estimate has a base date of Q3 2019 which has been escalated accordingly. The estimate is expressed in United States dollars (USD) and has used a flat exchange rate of 3,600 COP to the USD.
Table 21.1: Capital Cost Estimate Responsibilities
| Responsibility |
Areas | Sub-Areas |
Reviewed | |||
| Minesa / SRK |
Mining | Mining plan, mining dewatering system, mine ventilation, support for quotes from suppliers for ground support and services. |
Minesa | |||
|
Bestech |
Mining | Mine electrification, mine electrical infrastructure, control systems and automation. |
Minesa | |||
|
Ausenco |
Process Plant | Underground crushing, ore and waste handling, grinding, flotation, regrind, thickening, filtration, concentrate loadout, dry filtered tailings handling, reagents, utilities |
Minesa | |||
|
SNC |
Dry Stack Facility (DSF) | DSF stacking system and starter facility |
Minesa | |||
|
WorleyParsons |
El Emboque and El Cuatro site development facilities, site utilities. |
SNC | ||||
| On-site Infrastructure | Padilla site development, water management, DSF, support facilities, general and administrative facilities, site utilities. |
SNC | ||||
| Offsite Infrastructure | Road upgrades and bypasses |
Minesa | ||||
|
Minesa |
Owner´s Cost | Finance, HS, EMP |
Minesa | |||
|
SNC |
Capex | Evaluate and prepare the estimate |
Minesa |
| 21.1.2 | Estimate Classification |
The objective was to prepare an American Association of Cost Engineers (AACE) Class 3 level estimate. The overall range accuracy (Table 21.2) of the capital expenditure estimate is considered to fall into the Expected Accuracy Range for a Class 3 Estimate (Typical Variation Low: -10% to -20%, and High: +10% to +30%), as shown with the Level 1 Work Breakdown Structure (“WBS”), achieving the objective.
Table 21.2: Estimate Classification per WBS Level 1
| Area Code | Area Description | Class 3 Estimate |
Class 4 Estimate |
Estimate Accuracy | ||||
| 1000 |
Underground mine | 100% | 0% | +/-15% | ||||
| 2000 |
Processing | 71% | 29% | +/-21% |
| Effective Date January 1, 2021 | Aris Gold | |||
| Page 342 of 384 |
| SRK Consulting | Soto Norte NI 43-101 – Feasibility Study |
| Area Code |
Area Description | Class 3 Estimate | Class 4 Estimate | Estimate Accuracy | ||||
| 3000 |
Dry stack facility | 71% | 29% | +/- 21% | ||||
| 4000 |
On-site infrastructure utilities and facilities | 87% | 23% | +/- 17% | ||||
| 5000 |
Off-site infrastructure utilities and facilities | 100% | 0% | +/- 15% | ||||
|
Total |
91% | 9% | ||||||
Table 21.3 presents SNC’s evaluation that assesses the uncertainties within the estimate. In addition to the additional engineering required to reach Financial Close for Project Financing, there are also estimating activities which are required to meet the standard. These include market testing of construction packages for scope specifically developed and quoted for the Project.
Table 21.3: Class 3 Estimate Criteria
| Item |
Class 3 Criteria | Soto Norte Project | ||
| General Project Data |
||||
| Project scope description |
Defined | Defined | ||
| Plant production/facility capacity |
Defined | Defined | ||
| Plant location |
Specific | Defined | ||
|
Soils & hydrology |
Defined | Defined 80% | ||
| Integrated project plan |
Defined | Defined | ||
| Project master schedule |
Defined | Defined | ||
| Escalation impacts |
Defined | Defined | ||
| Work breakdown structure |
Defined | Defined | ||
| Project code of accounts |
Defined | Defined | ||
| Procurement strategy |
Preliminary | Defined | ||
| Contracting strategy |
Preliminary | Defined | ||
| Indirect construction costs |
Defined | Defined/Prelim | ||
| Home office costs |
Defined | Defined | ||
| Other costs |
Defined | Defined | ||
| Contingency analysis |
Defined | Defined | ||
|
Risks |
Defined | Defined | ||
| Engineering Deliverables |
||||
| Block flow diagrams |
Complete | Complete | ||
| Plot plans |
Complete | Complete | ||
| Process flow diagrams |
Complete | Complete | ||
| Utility flow diagrams |
Preliminary | Preliminary | ||
|
Piping & instrument diagrams |
Preliminary | Preliminary | ||
|
Heat & material balances |
Complete | Complete | ||
| Sized process equipment list |
Complete | Complete 80% | ||
| Sized utility equipment list |
Complete | Complete 80% | ||
| Electrical one-line drawings |
Preliminary | Preliminary | ||
| Equipment datasheets |
Preliminary | Preliminary | ||
| Equipment specifications |
Preliminary / (Eng. Notes) | Preliminary / (Eng. Notes) | ||
| Equipment pricing |
Budget Quotes (80%) | Budget Quotes (80%) | ||
| General equipment arrangement drawings |
Preliminary | Preliminary | ||
| Equipment sparing philosophy |
Defined | Preliminary | ||
| Spare parts listings |
Preliminary | Preliminary | ||
| Bulk material specifications |
Preliminary | Preliminary | ||
| Piping discipline drawings |
Preliminary Transpositions | Preliminary |
| Effective Date January 1, 2021 | Aris Gold | |||
| Page 343 of 384 |
| SRK Consulting | Soto Norte NI 43-101 – Feasibility Study |
| Item | Class 3 Criteria | Soto Norte Project | ||
| Electrical discipline drawings | Preliminary | Preliminary | ||
| Instrument/control system drawings | Preliminary | Preliminary | ||
| Distributed control system (“DCS”)/controls philosophy | Preliminary | Preliminary | ||
| Civil/structural/site discipline drawings | Layout / Sketches | Layout / Sketches |
| 21.1.3 | General Estimation Methodology |
Where possible, the existing vendor supply and construction contractor pricing was utilised following review and validation by the SNC engineering and estimation teams to develop the direct and sustaining capital cost estimate. A list of the major packages and source of costs is shown in Table 21.4. There are different estimating approaches per package depending on the owner’s scope.
All estimate records were identified by a quantity development category to show the method of quantity development.
Table 21.4: Major Packages and Costs Source
| Construction Working Package No. |
Construction Contract |
Package Description | Source of Costs | Quotes | Estimated | |||||
| P0001 |
Inc. in P0211 | Process plant | Estimated by Ausenco | 48% | 52% | |||||
| P0002 |
Inc. in P0211 | Material handling | Incl. in P0001 | |||||||
| P0003 |
Inc. in P0211 | Filter plant | Incl. in P0001 | |||||||
| P0005 |
Inc. in P0232 | HV power / sub station | Preliminary budget quote | 100% | ||||||
| P0006 |
Inc. in P0223 | Construction camp | Preliminary budget quote | 83% | 17% | |||||
| P0007 |
Inc. in P0241 | Mine development | Minesa (Preliminary review by Mining Plus) | 100% | ||||||
| P0008 |
Inc. in P0243 | Equipment alliance | Minesa (Preliminary review by Mining Plus) | 100 | ||||||
| P0010 |
Inc. in P0221 | Site establish. & Roads | Preliminary budget quote | 86% | 14% | |||||
| P0010.02 |
Inc. in P0220 | Matanza by-pass | Minesa / WorleyParsons | 100% | ||||||
| P0010.03 |
Inc. in P0220 | La Playa to Matanza Road | Minesa / WorleyParsons | 100% | ||||||
| P0010.04 |
Inc. in P0220 | Matanza to Panaga Bridge | Minesa / WorleyParsons | 100% | ||||||
| P0011 |
Inc. in P0211 | Concrete foundations | Estimated by SNC | 100% | ||||||
| P0011.1 |
Inc. in P0211 | Piling for foundations | Estimated by SNC | 100% | ||||||
| P0012 |
Inc. in P0211 | Water intake + water distribution system | Estimated by SNC | 100% | ||||||
| P0012.1 |
Inc. in P0235 | Fire suppression | Preliminary budget quote | 62% | 38% | |||||
| P0013 |
Inc. in P0232 | Package substation | Preliminary budget quote | 100% | 0% | |||||
| P0014 |
Inc. in P0225 | Site fencing & barriers | Preliminary budget quote | 80% | 20% | |||||
| P0016 |
Inc. in P0211 | Sewage treatment plant | Factored budget quote | 20% | 80% | |||||
| P0016.1 |
Inc. in P0211 | Potable water plant | Factored budget quote | 90% | 10% | |||||
| P0016.2 (Trend) |
Inc. in P0211 | Process water treatment plant | Estimated by Ausenco | 90% | 10% | |||||
| P0017 |
Inc. in P0223 | Non-industrial buildings | Preliminary budget quote | 85% | 15% | |||||
| P0018 |
Inc. in P0223 | Industrial buildings warehouses | Preliminary budget quote | 85% | 15% |
| Effective Date January 1, 2021 | Aris Gold | |||
| Page 344 of 384 |
| SRK Consulting | Soto Norte NI 43-101 – Feasibility Study |
| Construction Package No. |
Construction Contract |
Package Description | Source of Costs | Quotes | Estimated | |||||
| P0020 |
Inc. in P0223 | Core shed expansion | Preliminary budget quote | 85% | 15% | |||||
| P0021 |
Inc. in P0231 | Fuel supply for infrastructure & plant | Preliminary budget quote | 100% | ||||||
| P0021a |
Inc. in P0231 | Fuel storage capex & operation cost for fuel station | Preliminary budget quote | 100% | ||||||
| P0021b |
Inc. in P0231 | Fuel supply for mine | Preliminary budget quote | 100% | ||||||
| P0022 |
Inc. in P0224 | Laboratory (excluding the building) | Preliminary budget quote | 100% | ||||||
| P0023 |
Inc. in P0232 | Lighting | Preliminary budget quote | 100% | ||||||
| P0024 |
Inc. in P0222 | Concrete batch plant & supply for infrastructure | Preliminary budget quote | 100% | ||||||
| P0024a |
Inc. in P0222 | Concrete batch plant & supply for mine | Preliminary budget quote | 100% | ||||||
| P0026 |
Inc. in P0234 | Radio system | Preliminary budget quote | 100% | ||||||
| P0026.1 |
Inc. in P0234 | Telecommunication | Preliminary budget quote | 100% | ||||||
| P0026.2 |
Inc. in P0233 | Security system hardware | Preliminary budget quote | 80% | 20% | |||||
| P0027 |
Inc. in P0235 | Fire/smoke detection & fire suppression system | Preliminary budget quote | 80% | 20% | |||||
| P0030 |
Inc. in P0233 | Security cameras & logistic | Preliminary budget quote | 65% | 35% | |||||
| P0031 |
Inc. in P0251 | Camp & site services contracts (except for mine) | Preliminary budget quote | 85% | 15% | |||||
| P0031a |
Inc. in P0251 | Camp & site services contracts for mine | Preliminary budget quote | 85% | 15% | |||||
| P0034 |
TBD | Social projects assistance | Minesa | 100% | ||||||
| P0035 |
Inc. in P0223 | Military base | Preliminary budget quote | 100% | ||||||
| CMT offices |
Inc. in P0223 | Construction management offices | Minesa / WorleyParsons | 100% | ||||||
| Bucaramanga to Matanza | Inc. in P0220 | Bucaramanga to Matanza critical points | Minesa / WorleyParsons | 100% | ||||||
| DCS Central | Inc. in P0211 | DCS – process control system | Preliminary budget quote | 80% | 20% | |||||
| Replace piping/optical cable /pools | Inc. in P0221 | Relocate existing piping/optical cable | Minesa | 100% | ||||||
| Other start-up & assistance: | N/A | Owner cost | Minesa | 100% | ||||||
| HS | N/A | Owner cost | Minesa | 100% | ||||||
| G&A | N/A | Owner cost | Minesa | 100% | ||||||
| EMP | N/A | Owner cost | Minesa | 100% | ||||||
| Project support to management team team | N/A | Owner cost | Minesa | 100% | ||||||
| Social projects | N/A | Owner cost | Minesa | 100% | ||||||
| Social EPC projects | N/A | Owner cost | Minesa | 100% | ||||||
| Training | N/A | Owner cost | Minesa | 100% | ||||||
| Security | N/A | Security services (during construction) | Minesa | 100% |
| Effective Date January 1, 2021 | Aris Gold | |||
| Page 345 of 384 |
| SRK Consulting | Soto Norte NI 43-101 – Feasibility Study |
| 21.1.4 | Indirect Costs |
Common distributables are the field costs during the construction phase of the Project that cannot be directly identified or attributed to specific construction activities of the permanent plant facilities. These common distributables costs include temporary facilities, construction equipment, tools, supplies, consumables and services which supports the construction operations of permanent plant facilities.
The requirements for common distributables for this Project have been assessed against the Project Execution Plan and the services, which Minesa has estimated as part of the Owner´s Costs. The current costs are based on a historical percentage of 4.6% of total direct costs excluding mining, which was established from the identification of which temporary facilities and services will be required by the Engineering, Procurement and Construction Management (EPCM) contractor to support the direct scope of work. A significant portion of the Project indirect costs are being provided by the Owner. SNC historical experience was used to estimate the cost of the common distributables, including the construction facilities that will be required to support the EPCM contractor. Following are the primary Project indirect items developed by SNC for the EPCM contractor:
| ● | Mobilisation and demobilisation of facilities, equipment and personnel related to the EPCM contractor. |
| ● | Temporary construction facilities and utilities including site offices, ablutions and other support facilities. |
| ● | Site operating and maintenance including sewage collection, water distribution, janitorial services, building maintenance, consumables and office equipment required for the EPCM contractor only. |
| ● | Laydown areas including security fencing and lighting (scope to be determined in the next Project stage). |
| ● | Heavy lift cranes and general scaffolding where not included by the current contractor quotations. A preliminary allowance has been made to allow for a heavy lift crane where key lifts will include the SAG mill, tailings filters and others, which will be determined once a Project lifting study has been completed. |
The following scope was specifically excluded from the EPCM contract as Minesa has included them in their Owner´s Costs:
| ● | Pre-commissioning and commissioning assistance |
| ● | On-site bussing of all direct and indirect personnel |
| ● | Medical facilities and staff |
| ● | Site security |
| ● | Site inductions, job training and skills testing |
| Effective Date January 1, 2021 | Aris Gold | |||
| Page 346 of 384 |
| SRK Consulting | Soto Norte NI 43-101 – Feasibility Study |
| ● | Medical and drug testing |
| ● | Construction water and potable water required prior to the construction of the permanent water intake and services infrastructure. |
During the construction of the Project, Minesa will provide temporary first aid and medical room, inductions and safety training center, contractor workshops, warehouses, and laydown areas including all utilities.
A concrete batch plant will be provided during construction and will supply concrete for all contractors. All requirements for concrete before the batch plant has been installed is the responsibility of contractors, however, the timing for this has been subject to change and it is recommended that once the schedule is finalised, a detailed early works plan is developed.
Minesa shall provide on-site accommodation and messing and there is also availability of local accommodation in the towns of Suratá, Matanza and California.
| 21.1.5 | Engineering, Procurement and Construction Management (EPCM) |
The EPCM project delivery services are estimated based on 15% of the Total Direct Costs (TDC) excluding the Mining scope of work as directed by Minesa. The EPCM costs are expected to include the following types of services:
| ● | Project management |
| ● | Engineering and designers |
| ● | Project administration |
| ● | Project document control |
| ● | Project cost control |
| ● | Planning, estimating and scheduling |
| ● | Procurement and logistics |
| ● | Construction and commissioning management. |
| 21.1.6 | Owners Costs |
The Owner’s Costs include but are not limited to the following:
| ● | Land acquisition cost included in EMP |
| ● | Project G&A costs |
| ● | Health and safety, and security |
| ● | Insurance (excluding freight): insurance costs for engineering and construction activities and civil liability |
| ● | Environmental, sustainability, safety, and health: all costs associated with environmental |
| Effective Date January 1, 2021 | Aris Gold | |||
| Page 347 of 384 |
| SRK Consulting | Soto Norte NI 43-101 – Feasibility Study |
| studies, assessment, compensatory measures and remediation of any environmental liabilities |
| ● | Community engagement: social costs associated with community engagement activities such as impact management, investment and dialogue etc. |
| ● | Spares & inventory: first fill materials, commissioning spares and inventory were provided by the equipment suppliers as part of the supplied quotations. For facilities this scope is included into the respective contract packages. |
| ● | Mine pre operating expenditures of USD7m are included in the mine construction cost. |
| 21.1.7 | Estimate Provisions |
Growth Allowance
Each line item of the estimate was developed initially at a base cost level. A growth allowance has then been allocated to each element of those line items costs to reflect the level of definition of design (Quantity Maturity) and pricing strategy (Cost Maturity).
Contingency
Estimate contingency is included in the Project costs to address anticipated variances between the specific items contained in the estimate and the final actual Project cost.
The initial contingency development was based on a risk analysis (Monte Carlo simulation) summarising the major cost items by facility and major commodity. The SNC estimation team assessed the various levels of contingency to be applied based on recent project experience similar to the size and scale of the Project. This model yielded an overall contingency percentage of 12.1% of the direct and indirect costs, with a 50% probability of underrun or overrun.
Management Reserve
Management reserve is best described as expenditure that may be spent if a risk event occurs, as opposed to estimate contingency which will be spent.
No management reserve has been accounted for in this estimate as it lies outside the scope of this estimate. A future operational readiness plan will be developed at the next Project stage to further examine the application of management reserve.
| 21.1.8 | Capital Cost Summary |
Capital expenditure as estimated for the LoMP are presented in Table 21.5, excluding any operating costs incurred during the pre-production period. Table 21.6 presents the full LoM capital expenditure schedule including capitalised operating costs. SRK notes that sustaining capital to be spent during the construction phase as in in Table 21.6 is captured under project capital in Table 21.5.
| Effective Date January 1, 2021 | Aris Gold | |||
| Page 348 of 384 |
| SRK Consulting | Soto Norte NI 43-101 – Feasibility Study |
Table 21.5: LoMP Capital Expenditure Estimate (excluding pre-production operating costs
| Capital Expenditure | Units | Project | Sustaining/ Deferred |
Total LoM | ||||
| Mining |
||||||||
| Growth |
(USDm) | 172 | - | 172 | ||||
| Development |
(USDm) | 92 | 44 | 136 | ||||
| Equipment |
(USDm) | 25 | 180 | 205 | ||||
| Labour |
(USDm) | 62 | - | 62 | ||||
| Other |
(USDm) | 31 | 20 | 52 | ||||
| Mining Total |
(USDm) | 383 | 244 | 627 | ||||
| Processing/DSF/EPCM |
||||||||
| EPCM |
(USDm) | 54 | 37 | 90 | ||||
| Process Plant |
(USDm) | 139 | - | 139 | ||||
| Water Services |
(USDm) | 37 | - | 37 | ||||
| Dry Stacking/Material Handling |
(USDm) | 6 | - | 6 | ||||
| Distributed Control System (DCS) |
(USDm) | 4 | - | 4 | ||||
| Mobile Equipment |
(USDm) | 10 | 33 | 43 | ||||
| Processing/DSF/EPCM Total |
(USDm) | 250 | 69 | 319 | ||||
| Other EPC |
||||||||
| Roads Access-Offsite |
(USDm) | 12 | - | 12 | ||||
| Site Utilities |
(USDm) | 134 | 0 | 134 | ||||
| Other Contracts / POs |
(USDm) | 84 | - | 84 | ||||
| Other EPC Total |
(USDm) | 231 | 0 | 231 | ||||
| Owner’s Cost |
(USDm) | 9 | - | 9 | ||||
| G&A |
(USDm) | 3 | 5 | 8 | ||||
| Contingency |
(USDm) | 138 | - | 138 | ||||
| Total |
(USDm) | 1,014 | 318 | 1,333 | ||||
| (USD/t ore) | 53.8 | |||||||
| (USD/oz Au) | 306.5 |
| Effective Date January 1, 2021 | Aris Gold | |||
| Page 349 of 384 |
| SRK Consulting | Soto Norte NI 43-101 – Feasibility Study |
Table 21.6: LoM Capital Expenditure Schedule
| Capital Expenditure | Units | Total | 1 | 2 | 3 | 4 | 5 | 6 | 7 | 8 | 9 | 10 | 11 | 12 | 13 | 14 | ||||||||||||||||||
| Project Total |
(USDm) | 982 | 298 | 364 | 216 | 102 | (0) | - | 0 | (0) | 0 | 0 | 0 | 0 | 1 | 0 | ||||||||||||||||||
| Mining |
(USDm) | 365 | 67 | 94 | 127 | 75 | (0) | - | 0 | (0) | 0 | 0 | 0 | 0 | 1 | 0 | ||||||||||||||||||
| Processing/DSF/EPCM |
(USDm) | 239 | 98 | 122 | 19 | 1 | - | - | - | - | - | - | - | - | - | - | ||||||||||||||||||
| Other EPC |
(USDm) | 231 | 95 | 104 | 29 | 3 | (0) | - | - | - | - | - | - | - | - | - | ||||||||||||||||||
| Owners |
(USDm) | 9 | - | - | - | 9 | - | - | - | - | - | - | - | - | - | - | ||||||||||||||||||
| Contingency |
(USDm) | 138 | 39 | 43 | 42 | 14 | - | - | - | - | - | - | - | - | - | - | ||||||||||||||||||
| Sustaining Total |
(USDm) | 351 | 8 | 4 | 1 | 21 | 50 | 52 | 25 | 25 | 38 | 26 | 30 | 35 | 17 | 19 | ||||||||||||||||||
| Mining |
(USDm) | 263 | 0 | 0 | 1 | 19 | 27 | 41 | 22 | 21 | 35 | 21 | 20 | 31 | 16 | 9 | ||||||||||||||||||
| Processing |
(USDm) | 43 | 7 | 3 | - | 1 | 2 | 5 | 2 | 3 | 1 | 1 | 7 | 3 | - | 9 | ||||||||||||||||||
| EPCM related |
(USDm) | 37 | - | - | - | 0 | 21 | 5 | 1 | 1 | 1 | 3 | 1 | 1 | 1 | 1 | ||||||||||||||||||
| G&A |
(USDm) | 8 | 1 | 1 | 0 | 1 | 1 | 0 | 0 | 0 | 1 | 0 | 1 | 0 | 0 | 0 | ||||||||||||||||||
| Capitalised Operating Costs | (USDm) | 114 | 40 | 36 | 29 | 9 | - | - | - | - | - | - | - | - | - | - | ||||||||||||||||||
| Capitalised Allocated Overhead | (USDm) | 47 | 11 | 16 | 16 | 4 | - | - | - | - | - | - | - | - | - | - | ||||||||||||||||||
| Total Capital Expenditure |
(USDm) | 1,494 | 357 | 420 | 262 | 136 | 50 | 52 | 25 | 25 | 38 | 26 | 30 | 35 | 18 | 20 | ||||||||||||||||||
| Effective Date January 1, 2021 | Aris Gold | |||
| Page 350 of 384 |
| SRK Consulting | Soto Norte NI 43-101 – Feasibility Study |
| 21.1.9 | Depreciation |
Five classes for depreciation purposes have been set, with rates ranging from 1% to 100% per annum. A breakdown of the capital expenditure in the different classes is presented in Table 21.7. A corporate income tax rate of 33% has been applied. It should be noted that tax is calculated on a quarterly basis and not annually.
Table 21.7: Capital Expenditure per Depreciation Class
| Depreciation Classes | Capital Expenditure (USDm) | Annual Depreciation Rate (%) | ||
| Class 1 |
254 | 100 | ||
| Class 2 |
13 | 20 | ||
| Class 3 |
543 | 10 | ||
| Class 4 |
499 | 5 | ||
| Class 5 |
24 | 1 | ||
| Total |
1,333 |
| 21.2 | Operating Cost Estimates |
| 21.2.1 | Introduction |
The operating cost estimate for Project was made by Minesa with inputs from their third-party advisors that include SRK for mining and surface infrastructure contributors from WorleyParsons, SNC and Ausenco.
The operating costs related to sales comprise of freight, treatment and refining charges, penalties and royalty items which were derived from the Market Studies (Section 19) and are summarised in the Marketing Assumptions (Section 22.4) of the Economic Analysis.
| 21.2.2 | Basis of Estimate |
The estimate applies 2020 USD estimates as a basis with a nominal accuracy of +/-15%. The estimates have been escalated from 2019 to 2020 prices according to the official CPI rates for COP and USD which are 1.61% and 1.4%, respectively.
The operating cost estimates for the Project have been primarily developed based on zero based modelling principles. The most significant variable costs directly related to the operation are calculated based on the mine and process plant schedules, equipment hours determined through international accepted maintenance and availability assumptions, operating consumables using test work data and OEM reference information, productivity rates and the quotations obtained from the selected vendors including:
| ● | Equipment maintenance and replacement costs: based on hourly rates, operating and maintenance labour, replacement parts, power, consumables and other associated services developed from OEM tenders for the supply and maintenance of equipment. |
| ● | Consumption of power, diesel, lubricant, tyres, tracks and ground support: based on equipment hours determined using industry standard equipment efficiencies, usage and production rates. |
| ● | Reagents, cement, grinding media and liners: based on tonnes of ore processed and unit prices provided by industry suppliers. |
| ● | Labour rates based on the current Minesa remuneration scheme. |
| Effective Date January 1, 2021 | Aris Gold | |||
| Page 351 of 384 |
| SRK Consulting | Soto Norte NI 43-101 – Feasibility Study |
| 21.2.3 | Mine Operating Costs |
The mine operating costs were developed based on first principle estimation techniques and, where possible, quotes were sourced for the supply of equipment and consumables. In the event that quotations were of similar quality, a preference was given to local suppliers in order to align with Minesa’s sustainable social management program. Table 21.8 summarises the source of mine operating costs that were prepared by Minesa with input from their specialist advisors.
Table 21.8: Mine Operating Cost Estimate Responsibilities
| Description | Responsibility | Source/Estimation Method | ||
| Unit labour rates |
Minesa |
Estimate from Hays, Korn Ferry and current salaries | ||
| Unit electricity rates |
Minesa |
Market analysis (Cosenit) | ||
| Unit diesel fuel and lubricant costs |
Minesa |
Supplier quote (Terpel) | ||
| Shotcrete cost |
Minesa |
Supplier quote (Argos) | ||
| Power consumption |
Minesa |
Supplier quote (Epiroc, Normet, Caterpillar) | ||
| Diesel fuel consumption |
Minesa |
Supplier quote (Epiroc, Normet, Caterpillar) | ||
| Lubricant consumption |
Minesa |
Supplier quote (Epiroc, Normet, Caterpillar) | ||
| Drilling consumption |
Minesa |
Supplier quote (Epiroc) | ||
| Unit costs for bulk explosives, detonators and accessories | Minesa |
Supplier quote (Orica) | ||
| Equipment maintenance, tyres and wear parts |
Minesa |
Supplier quote (Epiroc, Normet, Caterpillar) | ||
| Ground support |
Minesa |
Supplier quote (DSI) and first principle calculation | ||
| Mine services |
Minesa/SRK |
Supplier quotes and first principle calculation | ||
| Grade control |
Minesa |
Supplier quotes and first principle calculation | ||
| Transportation of ore and waste to Padilla |
Minesa |
Supplier quotes and first principle calculation | ||
| Other items (miscellaneous operating costs) |
Minesa |
Supplier quote (Deswik, Epiroc) |
The estimated mine operating costs include all direct charges attributable to the underground operation for mining both ore and waste rock materials, and the subsequent backfilling of underground voids. The mining activities and corresponding cost estimates comprise:
| ● | Mine equipment and labour to support development, production and materials handling activities |
| ● | Mine services including, but not limited to, dewatering, ventilation, grade control, etc. |
| ● | Drilling and blasting costs associated with the mining of ore and quarry stopes for waste backfill |
| ● | Backfilling operations for the modified Avoca mining method (unconsolidated and consolidated) |
| ● | Delivery of ore and waste to the underground primary crushing station and underground crushing. |
| 21.2.4 | Process Operating Costs |
The estimated process plant operating cost represents all the direct costs for operation and maintenance of the processing and filter plant at a nominal annual throughput of 2.6 Mtpa. The estimate is based on the processing facilities within the following boundary limits:
| ● | Primary crusher, apron feeder and conveyance to the crushed ore stockpile |
| ● | Concentrate loaded into container for transport to the port |
| ● | Tailings filtered for dry stacking and conveyance system to underground backfill preparation. |
| Effective Date January 1, 2021 | Aris Gold | |||
| Page 352 of 384 |
| SRK Consulting | Soto Norte NI 43-101 – Feasibility Study |
The primary elements contributing to the operating costs include labour, electrical power, reagents, grinding media and liners, filter material, maintenance materials and spare parts, and general expenses such as metallurgical and analytical laboratory services, process control and an on-stream analyser. Water treatment costs are also included with the category ‘Reagents, Lube & Other Consumables’.
| 21.2.5 | General and Administrative and Owner Operating Costs |
The G&A expenses estimated for the Soto Norte Project is separated by on-site and corporate categories. The category definitions include the following:
| ● | Mine-Site G&A: related to on-site expenses and includes: |
| ○ | Insurances and taxes |
| ○ | Software and technology |
| ○ | Consultancy and services |
| ○ | Travel and transport |
| ○ | Lease |
| ○ | Labour, recruitment and variable compensation. |
| ● | Corporate G&A (Allocated Overheads): G&A related to off-site expenses and includes: |
| ○ | Consultants |
| ○ | Insurance |
| ○ | Travel |
| ○ | Agreements |
| ○ | Training and recruitment |
| ○ | Taxes and fees |
| ○ | Memberships & associations, statutory & government fees |
| ○ | Media plans and events |
| ○ | Stakeholder engagement |
| ○ | Leases |
| ○ | Software and hardware |
| ○ | Stationary |
| ○ | Utilities |
| ○ | Materials |
| ○ | Other services |
| ○ | Severance. |
| 21.2.6 | Other Operating Costs |
Other operating cost categories which include the following items:
| Effective Date January 1, 2021 | Aris Gold | |||
| Page 353 of 384 |
| SRK Consulting | Soto Norte NI 43-101 – Feasibility Study |
| ● | Environmental management – includes monitoring and management plans |
| ● | Marketing and logistics (realisation) |
| ● | Royalties |
| ● | Mine closure |
| 21.2.7 | Operating Cost Summary |
The LoM operating costs are modelled per the following areas:
| ● | Mining |
| ● | Processing (including DSF) |
| ● | Realisation: treatment charges, refining charges, smelter penalties and freight |
| ● | Environmental Management Plan (including a post closure monitoring period) |
| ● | On-site administration |
| ● | G&A. |
Royalties are payable at 4% for gold and silver, payable on 80% of the previous month’s metal price as per the LME, and at 5% on 80% of the contained copper in copper concentrates, based on the UPME price determined at the time of sale, and are hence dependent on the price assumptions made.
Total LoMP operating costs are presented in Table 21.9, with the annual fluctuations shown in Figure 21.1 and Table 21.11. Pre-production period is considered 13 quarters (from NTP), and while the values for this period are included in Table 21.9, they are excluded under Figure 21.1 as they are considered capitalised in the financial model.
Table 21.10 provides a summary of the unit operating costs (production phase only) for the LoM.
Table 21.9: LoMP Operating Cost Estimate
| Operating Costs | Units | Pre-production | Production | Post- Closure |
LoM | |||||
| Mining |
||||||||||
| Development |
(USDm) | - | 64 | - | 64 | |||||
| Ore Production |
(USDm) | - | 71 | - | 71 | |||||
| Equipment |
(USDm) | - | 191 | - | 191 | |||||
| Labour |
(USDm) | - | 213 | - | 213 | |||||
| Power |
(USDm) | - | 54 | - | 54 | |||||
| Other |
(USDm) | - | 100 | - | 100 | |||||
| Mining Total |
(USDm) | - | 693 | - | 693 | |||||
| Processing |
||||||||||
| Labour |
(USDm) | - | 17 | - | 17 | |||||
| Consumables |
(USDm) | - | 141 | - | 141 | |||||
| Maintenance |
(USDm) | - | 41 | - | 41 | |||||
| Power |
(USDm) | - | 100 | - | 100 | |||||
| Mobile Equipment |
(USDm) | - | 8 | - | 8 | |||||
| Other |
(USDm) | 6 | 0 | - | 6 | |||||
| Processing Total |
(USDm) | 6 | 307 | - | 313 |
| Effective Date January 1, 2021 | Aris Gold | |||
| Page 354 of 384 |
| SRK Consulting | Soto Norte NI 43-101 – Feasibility Study |
|
Operating Costs |
Units | Pre-production | Production | Post- Closure |
LoM | |||||
| Realisation |
||||||||||
| Treatment Charges |
(USDm) | - | 251 | - | 251 | |||||
| Refining Charges |
(USDm) | - | 56 | - | 56 | |||||
| Penalties |
(USDm) | - | 50 | - | 50 | |||||
| Freight |
(USDm) | - | 231 | - | 231 | |||||
| Realisation Total |
(USDm) | - | 589 | - | 589 | |||||
| Environmental Management Plan |
(USDm) | 62 | 38 | 15 | 116 | |||||
| Mine Site G&A |
(USDm) | 45 | 85 | 0 | 131 | |||||
| Allocated Overhead Costs |
(USDm) | 47 | 160 | 0 | 208 | |||||
| Royalties |
(USDm) | 0 | 272 | 0 | 272 | |||||
| Closure |
(USDm) | - | 10 | 30 | 41 | |||||
| Change in Working Capital |
(USDm) | 5 | 5 | 0 | 10 | |||||
| Total |
(USDm) | 166 | 2,160 | 46 | 2,372 | |||||
| (USD/ore) | 6.7 | 87.2 | 1.9 | 95.8 | ||||||
| (USD/oz Au) | 38.1 | 496.8 | 10.6 | 545.5 |
Table 21.10: LoM Unit Operating Cost Estimate1
| Unit Operating Costs |
LoM (USD/t ore) | |||||
| Mining |
28.0 | |||||
| Processing |
12.4 | |||||
| Realisation |
23.8 | |||||
| Environmental Management Plan |
1.5 | |||||
| Mine Site G&A |
3.4 | |||||
| Allocated Overhead Costs |
6.5 | |||||
| Royalties |
11.0 | |||||
| Closure |
0.4 | |||||
| Total |
87.0 |
1 Excluding capitalised operating costs, working capital, and post closure
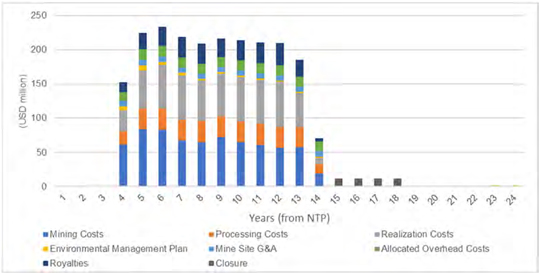
Figure 21.1: Operating Cost Schedule (excluding capitalised operating costs)
| Effective Date January 1, 2021 | Aris Gold | |||
| Page 355 of 384 |
| SRK Consulting | Soto Norte NI 43-101 – Feasibility Study |
Table 21.11: Operating Cost Schedule1
| Operating Costs | Units | Total | 1 | 2 | 3 | 4 | 5 | 6 | 7 | 8 | 9 | 10 | 11 | 12 | 13 | 14 | 15+ | |||||||||||||||||||||||||||||||||||||||||
| Mining costs |
(USDm) | 693 | - | - | - | 62 | 84 | 83 | 67 | 65 | 72 | 65 | 61 | 57 | 58 | 19 | - | |||||||||||||||||||||||||||||||||||||||||
| Processing costs |
(USDm) | 307 | - | - | - | 19 | 30 | 31 | 31 | 31 | 31 | 31 | 31 | 30 | 30 | 14 | - | |||||||||||||||||||||||||||||||||||||||||
| Realisation costs |
(USDm) | 589 | - | - | - | 31 | 56 | 64 | 64 | 59 | 62 | 64 | 64 | 66 | 49 | 9 | - | |||||||||||||||||||||||||||||||||||||||||
| Environmental management plan |
(USDm) | 53 | - | - | - | 5 | 7 | 5 | 4 | 3 | 3 | 2 | 2 | 2 | 2 | 2 | 17 | |||||||||||||||||||||||||||||||||||||||||
| Mine site G&A |
(USDm) | 85 | - | - | - | 9 | 8 | 8 | 8 | 8 | 8 | 8 | 8 | 7 | 7 | 7 | - | |||||||||||||||||||||||||||||||||||||||||
| Allocated overheads |
(USDm) | 160 | - | - | - | 12 | 16 | 15 | 15 | 15 | 15 | 15 | 15 | 15 | 15 | 14 | - | |||||||||||||||||||||||||||||||||||||||||
| Royalties |
(USDm) | 272 | - | - | - | 14 | 23 | 27 | 30 | 30 | 27 | 29 | 30 | 32 | 24 | 4 | - | |||||||||||||||||||||||||||||||||||||||||
| Closure |
(USDm) | 41 | - | - | - | - | - | - | - | - | - | - | - | - | - | - | 41 | |||||||||||||||||||||||||||||||||||||||||
| Change in working capital |
(USDm) | 10 | 2 | 4 | (1) | 133 | (33 | ) | 62 | (13 | ) | (2 | ) | 0 | 9 | 14 | (6 | ) | (73 | ) | (90 | ) | 3 | |||||||||||||||||||||||||||||||||||
| Total operating costs |
(USDm) | 2,211 | 2 | 4 | (1) | 286 | 191 | 295 | 206 | 208 | 216 | 222 | 224 | 204 | 112 | (19 | ) | 60 | ||||||||||||||||||||||||||||||||||||||||
1 Excluding capitalised operating costs
| Effective Date January 1, 2021 | Aris Gold | |||
| Page 356 of 384 |
| SRK Consulting | Soto Norte NI 43-101 – Feasibility Study |
| 22 | ECONOMIC ANALYSIS |
| 22.1 | Introduction |
SRK has undertaken an economic evaluation to assess and confirm the Probable Mineral Reserve estimate, as reported in this Technical Report, comprising 24.8 Mt at 6.22 g/t Au, 34.4 g/t Ag and 0.19% Cu, producing on average 450 koz of payable gold per annum over the steady state production years (NTP years 5-13).
SRK used Minesa’s financial model and made adjustments where deemed necessary. Depreciation/taxation logic is therefore as per Minesa’s model.
The profitability of the Mineral Reserves has been measured using the following key economic indicators:
| ● | Annual and cumulative cash flows |
| ● | Net present value (NPV) |
| ● | The internal rate of return (IRR). |
The economic evaluation has been conducted on a post-tax, pre-finance basis, in real money terms. The Project cash flows are therefore assessed before the impact of debt interest and repayment calculations. The currency presented below is in USD, with an assumed exchange rate of COP3,600 per USD. SRK notes there is ample scope for improvement on Minesa’s financial model and has used a simplified summary to derive bottom line cash flows.
The economics are presented on a 100% attributable basis (versus a part equity ownership basis). The financial model is expressed in real money terms at a NTP date.
The NPV presented herein should not be considered equal to any form of Project valuation and should be viewed together with the sensitivities presented.
The impact of working capital has been included in the financial model, assuming 72 days for debtors, 45 days for creditors, and 30 days for stores.
Value Added Tax (“VAT”) has not been modelled.
| 22.2 | Project Schedule |
First ore from underground is scheduled to occur in Month 09, steadily ramping up for the process plant to commence in Month 42, as shown in Figure 22.1. The mill feed tonnage and Au grade profile are shown in Figure 22.1, with annual production presented in Table 22.3. The total mine production and plant production over the life of mine are presented in Table 22.1 and Table 22.2, respectively.
| Effective Date January 1, 2021 | Aris Gold | |||
| Page 357 of 384 |
| SRK Consulting | Soto Norte NI 43-101 – Feasibility Study |
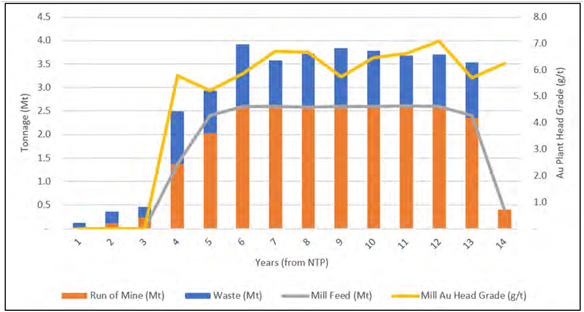
Figure 22.1: Mine Production and Mill Feed Schedule
Table 22.1: LoMP Mine Tonnes and Grade
| Mining | Units | LoM | ||||||
| Waste tonnage |
(Mt dry) | 11.8 | ||||||
| Ore tonnage |
(Mt dry) | 24.8 | ||||||
| Ore gold grade |
(g/t Au) | 6.22 | ||||||
| Ore silver grade |
(g/t Ag) | 34.39 | ||||||
| Ore copper grade |
(% Cu) | 0.19 | ||||||
Table 22.2: LoMP Concentrate Production, Recovery, and Grades
| Processing | Units | Copper Concentrate | Pyrite Concentrate | |||||
| Concentrate Produced |
(kt) | 230 | 1,990 | |||||
| Recovery |
||||||||
| Au | (%) | 44.95 | 47.79 | |||||
| Ag | (%) | 44.85 | 44.12 | |||||
| Cu | (%) | 73.90 | 18.52 | |||||
| Product Grade |
||||||||
| Au | (g/t) | 300 | 37 | |||||
| Ag | (g/t) | 1,662 | 189 | |||||
| Cu | (%) | 15.02 | 0.43 | |||||
| Effective Date January 1, 2021 | Aris Gold | |||
| Page 358 of 384 |
| SRK Consulting | Soto Norte NI 43-101 – Feasibility Study |
Table 22.3: LoMP Mine and Processing Production Schedule
| NTP Year
|
Units
|
Total
|
1
|
2
|
3
|
4
|
5
|
6
|
7
|
8
|
9
|
10
|
11
|
12
|
13
|
14
|
||||||||||||||||||||||||||||||||||||||||||||||||
| Mining |
||||||||||||||||||||||||||||||||||||||||||||||||||||||||||||||||
| Waste |
(Mt) | 11.77 | 0.09 | 0.26 | 0.22 | 1.12 | 0.90 | 1.31 | 0.99 | 1.12 | 1.24 | 1.17 | 1.08 | 1.09 | 1.17 | - | ||||||||||||||||||||||||||||||||||||||||||||||||
| Ore |
(Mt) | 24.77 | 0.03 | 0.11 | 0.24 | 1.37 | 2.03 | 2.61 | 2.59 | 2.60 | 2.60 | 2.61 | 2.60 | 2.61 | 2.36 | 0.40 | ||||||||||||||||||||||||||||||||||||||||||||||||
| Ore Grade |
||||||||||||||||||||||||||||||||||||||||||||||||||||||||||||||||
| Gold |
(g/t) | 6.22 | 4.19 | 6.06 | 5.62 | 5.77 | 5.16 | 5.85 | 6.71 | 6.65 | 5.74 | 6.46 | 6.64 | 7.07 | 5.70 | 6.24 | ||||||||||||||||||||||||||||||||||||||||||||||||
| Silver |
(g/t) | 34.39 | 28.70 | 27.74 | 31.21 | 39.79 | 46.04 | 43.66 | 35.35 | 35.23 | 32.41 | 32.78 | 32.49 | 30.12 | 23.05 | 19.47 | ||||||||||||||||||||||||||||||||||||||||||||||||
| Copper |
(%) | 0.19 | 0.18 | 0.15 | 0.21 | 0.20 | 0.23 | 0.19 | 0.18 | 0.16 | 0.20 | 0.19 | 0.19 | 0.18 | 0.16 | 0.24 | ||||||||||||||||||||||||||||||||||||||||||||||||
| Stockpile O/B |
(Mt) | - | 0.03 | 0.14 | 0.38 | 0.37 | 0.00 | 0.01 | 0.00 | 0.02 | 0.02 | 0.03 | 0.03 | 0.04 | 0.00 | |||||||||||||||||||||||||||||||||||||||||||||||||
| Processing |
||||||||||||||||||||||||||||||||||||||||||||||||||||||||||||||||
| Mill throughput |
(Mt) | 24.77 | - | - | - | 1.38 | 2.40 | 2.60 | 2.59 | 2.58 | 2.60 | 2.60 | 2.61 | 2.60 | 2.40 | 0.40 | ||||||||||||||||||||||||||||||||||||||||||||||||
| Feed grade |
||||||||||||||||||||||||||||||||||||||||||||||||||||||||||||||||
| Gold |
(g/t) | 6.22 | - | - | - | 5.78 | 5.22 | 5.85 | 6.71 | 6.66 | 5.73 | 6.46 | 6.63 | 7.09 | 5.71 | 6.24 | ||||||||||||||||||||||||||||||||||||||||||||||||
| Silver |
(g/t) | 34.39 | - | - | - | 36.97 | 45.14 | 43.68 | 35.36 | 35.27 | 32.37 | 32.78 | 32.46 | 30.31 | 23.04 | 19.47 | ||||||||||||||||||||||||||||||||||||||||||||||||
| Copper |
(%) | 0.19 | - | - | - | 0.20 | 0.23 | 0.19 | 0.18 | 0.16 | 0.20 | 0.19 | 0.19 | 0.18 | 0.16 | 0.24 | ||||||||||||||||||||||||||||||||||||||||||||||||
| Pyrite Concentrate |
(kt) | 1,989.7 | - | - | - | 104.7 | 182.9 | 215.9 | 221.5 | 197.9 | 206.2 | 217.8 | 217.4 | 226.2 | 167.5 | 31.8 | ||||||||||||||||||||||||||||||||||||||||||||||||
| Gold |
(koz) | 2,360 | - | - | - | 115 | 191 | 243 | 285 | 279 | 237 | 252 | 260 | 269 | 192 | 36 | ||||||||||||||||||||||||||||||||||||||||||||||||
| Silver |
(koz) | 12,066 | - | - | - | 669 | 1,480 | 1,559 | 1,361 | 1,300 | 1,196 | 1,198 | 1,226 | 1,142 | 806 | 129 | ||||||||||||||||||||||||||||||||||||||||||||||||
| Copper |
(t) | 8,628 | - | - | - | 479 | 1,017 | 972 | 919 | 794 | 935 | 895 | 908 | 871 | 683 | 155 | ||||||||||||||||||||||||||||||||||||||||||||||||
| Recovery |
||||||||||||||||||||||||||||||||||||||||||||||||||||||||||||||||
| Gold |
(%) | 47.79 | - | - | - | 44.82 | 47.47 | 49.75 | 50.97 | 50.46 | 49.37 | 46.77 | 46.75 | 45.46 | 43.51 | 44.51 | ||||||||||||||||||||||||||||||||||||||||||||||||
| Silver |
(%) | 44.12 | - | - | - | 40.82 | 42.45 | 42.69 | 46.14 | 44.39 | 44.18 | 43.74 | 45.06 | 45.08 | 45.33 | 51.50 | ||||||||||||||||||||||||||||||||||||||||||||||||
| Copper |
(%) | 18.52 | - | - | - | 17.25 | 18.78 | 19.27 | 19.55 | 19.38 | 17.58 | 18.45 | 18.31 | 18.71 | 17.57 | 16.29 | ||||||||||||||||||||||||||||||||||||||||||||||||
| Copper Concentrate |
(kt) | 229.5 | - | - | - | 13.3 | 23.3 | 24.9 | 23.2 | 21.9 | 25.4 | 25.7 | 24.8 | 24.2 | 19.0 | 3.8 | ||||||||||||||||||||||||||||||||||||||||||||||||
| Gold |
(koz) | 2,214 | - | - | - | 119 | 179 | 206 | 228 | 228 | 205 | 246 | 256 | 286 | 222 | 40 | ||||||||||||||||||||||||||||||||||||||||||||||||
| Silver |
(koz) | 12,263 | - | - | - | 776 | 1,630 | 1,707 | 1,242 | 1,275 | 1,198 | 1,233 | 1,187 | 1,137 | 787 | 92 | ||||||||||||||||||||||||||||||||||||||||||||||||
| Copper |
(t) | 34,474 | - | - | - | 2,057 | 3,927 | 3,685 | 3,423 | 2,985 | 4,002 | 3,615 | 3,669 | 3,467 | 2,918 | 725 | ||||||||||||||||||||||||||||||||||||||||||||||||
| Recovery |
||||||||||||||||||||||||||||||||||||||||||||||||||||||||||||||||
| Gold |
(%) | 44.95 | - | - | - | 46.57 | 44.49 | 42.04 | 40.79 | 41.13 | 42.78 | 45.63 | 46.00 | 48.21 | 50.34 | 49.58 | ||||||||||||||||||||||||||||||||||||||||||||||||
| Silver |
(%) | 44.85 | - | - | - | 47.35 | 46.74 | 46.75 | 42.08 | 43.52 | 44.28 | 45.01 | 43.62 | 44.86 | 44.25 | 36.84 | ||||||||||||||||||||||||||||||||||||||||||||||||
| Copper |
(%) | 73.90 | - | - | - | 74.16 | 72.48 | 73.04 | 72.82 | 72.89 | 75.22 | 74.54 | 73.94 | 74.51 | 75.08 | 76.08 | ||||||||||||||||||||||||||||||||||||||||||||||||
| Effective Date January 1, 2021 | Aris Gold | |||
| Page 359 of 384 |
| SRK Consulting | Soto Norte NI 43-101 – Feasibility Study |
| 22.3 | Taxes and Royalties |
The analysis of the Soto Norte project includes an effective corporate income tax rate of 30%. Depreciation rates are as described in Section 21.1.9. Royalties are also deductible from taxable income.
Minesa is bound by law to pay the Colombian State royalties of:
| ● | 4% royalty on 80% of the contained gold produced based on the previous month’s metal price as per the LME |
| ● | 4% royalty on 80% of the contained silver produced based on the previous month’s metal price as per the LME |
| ● | 5% royalty on 80% of the contained copper produced based on the previous month’s metal price as per the UPME price determined at the time of sale. |
| 22.4 | Marketing Assumptions |
Marketing terms have been developed by Minesa based on the products going to a variety of offtakers, each with slightly different terms. Resulting weighted average terms over the LoMP are presented in Table 22.4.
Grade deductions and payability are captured within the gross revenue as presented below, while treatment and refining charges, penalties and freight are presented as operating costs. Net revenue (also referred to as Net Smelter Return) equals gross revenue minus these four categories of marketing costs.
Table 22.4: LoMP Marketing Terms
| Marketing Terms | Units | Copper Concentrate | Pyrite Concentrate | |||||
| Applied payability |
||||||||
| Au | (%) | 97.25 | 92.98 | |||||
| Ag | (%) | 95.87 | 80.12 | |||||
| Cu | (%) | 93.01 | 40.00 | |||||
| Treatment charge |
(USD/t con) | 244 | 98 | |||||
| Refining charge Au |
(USD/oz) | 7.50 | 6.40 | |||||
| Refining charge Ag |
(USD/oz) | 0.70 | 0.65 | |||||
| Refining charge Cu |
(USD/lb) | 0.16 | 0.00 | |||||
| Penalties |
(USD/t con) | 208 | 1.6 | |||||
| Freight |
(USD/t con wet) | 122.7 | 92.5 |
| 22.5 | Commodity Prices and Gross Revenue |
Financial analysis has been conducted using the following metal price assumptions:
| ● | Gold USD1,675/oz |
| ● | Silver USD20.00/oz |
| ● | Copper USD3.00/lb. |
These metal prices were selected as being in line with the median of the long-term forecasts of a group of banks and financial institutions, as at the end of December 2020.
Gross revenue over the LoMP per concentrate and per metal are graphically presented in Figure 22.2 and
| Effective Date January 1, 2021 | Aris Gold | |||
| Page 360 of 384 |
| SRK Consulting | Soto Norte NI 43-101 – Feasibility Study |
Figure 22.3, respectively, and in Table 22.5. Gross revenue incorporates payabilities but excludes other smelter charges or freight.
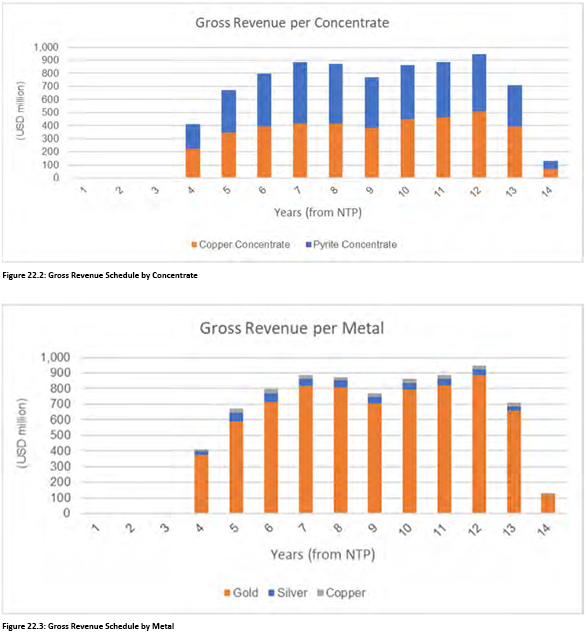
| Effective Date January 1, 2021 | Aris Gold | |||
| Page 361 of 384 |
| SRK Consulting | Soto Norte NI 43-101 – Feasibility Study |
| Table 22.5: | LoM Sales and Gross Revenue Schedule | |||||||||||||||||||||||||||||||||||||||||||||||||||
| NTP Year |
Units | Total | 4 | 5 | 6 | 7 | 8 | 9 | 10 | 11 | 12 | 13 | 14 | |||||||||||||||||||||||||||||||||||||||
| Sales |
||||||||||||||||||||||||||||||||||||||||||||||||||||
| Pyrite Concentrate |
||||||||||||||||||||||||||||||||||||||||||||||||||||
| Gold |
(koz) | 2,360 | 115 | 191 | 243 | 285 | 279 | 237 | 252 | 260 | 269 | 192 | 36 | |||||||||||||||||||||||||||||||||||||||
| Silver |
(koz) | 12,066 | 669 | 1,480 | 1,559 | 1,361 | 1,300 | 1,196 | 1,198 | 1,226 | 1,142 | 806 | 129 | |||||||||||||||||||||||||||||||||||||||
| Copper |
(Mlb) | 19 | 1 | 2 | 2 | 2 | 2 | 2 | 2 | 2 | 2 | 2 | 0 | |||||||||||||||||||||||||||||||||||||||
| Copper Concentrate |
||||||||||||||||||||||||||||||||||||||||||||||||||||
| Gold |
(koz) | 2,214 | 119 | 179 | 206 | 228 | 228 | 205 | 246 | 256 | 286 | 222 | 40 | |||||||||||||||||||||||||||||||||||||||
| Silver |
(koz) | 12,263 | 776 | 1,630 | 1,707 | 1,242 | 1,275 | 1,198 | 1,233 | 1,187 | 1,137 | 787 | 92 | |||||||||||||||||||||||||||||||||||||||
| Copper |
(Mlb) | 76 | 5 | 9 | 8 | 8 | 7 | 9 | 8 | 8 | 8 | 6 | 2 | |||||||||||||||||||||||||||||||||||||||
| Payability |
||||||||||||||||||||||||||||||||||||||||||||||||||||
| Pyrite Concentrate |
||||||||||||||||||||||||||||||||||||||||||||||||||||
| Gold |
(%) | 93 | 92.8 | 92.6 | 92.9 | 93.2 | 93.3 | 92.9 | 92.9 | 93.0 | 93.0 | 92.9 | 93.0 | |||||||||||||||||||||||||||||||||||||||
| Silver |
(%) | 80 | 80.3 | 81.3 | 80.9 | 80.2 | 80.5 | 79.9 | 79.6 | 79.8 | 79.2 | 78.8 | 78.1 | |||||||||||||||||||||||||||||||||||||||
| Copper |
(%) | 40 | 40.0 | 40.0 | 40.0 | 40.0 | 40.0 | 40.0 | 40.0 | 40.0 | 40.0 | 40.0 | 40.0 | |||||||||||||||||||||||||||||||||||||||
| Copper Concentrate |
||||||||||||||||||||||||||||||||||||||||||||||||||||
| Gold |
(%) | 97 | 97.3 | 97.3 | 97.3 | 97.3 | 97.3 | 97.3 | 97.3 | 97.3 | 97.3 | 97.3 | 97.3 | |||||||||||||||||||||||||||||||||||||||
| Silver |
(%) | 96 | 96.0 | 96.0 | 96.0 | 96.0 | 96.0 | 95.8 | 95.8 | 95.8 | 95.8 | 95.5 | 93.6 | |||||||||||||||||||||||||||||||||||||||
| Copper |
(%) | 93 | 93.2 | 93.8 | 92.9 | 92.9 | 92.3 | 93.3 | 92.5 | 92.9 | 92.6 | 93.2 | 94.6 | |||||||||||||||||||||||||||||||||||||||
| Gross Revenue |
||||||||||||||||||||||||||||||||||||||||||||||||||||
| Pyrite Concentrate |
(USDm) | 3,891 | 191 | 324 | 407 | 470 | 459 | 390 | 414 | 427 | 440 | 313 | 58 | |||||||||||||||||||||||||||||||||||||||
| Gold |
(USDm) | 3,675 | 179 | 297 | 379 | 445 | 436 | 368 | 393 | 405 | 420 | 298 | 56 | |||||||||||||||||||||||||||||||||||||||
| Silver |
(USDm) | 193 | 11 | 24 | 25 | 22 | 21 | 19 | 19 | 20 | 18 | 13 | 2 | |||||||||||||||||||||||||||||||||||||||
| Copper |
(USDm) | 23 | 1 | 3 | 3 | 2 | 2 | 2 | 2 | 2 | 2 | 2 | 0 | |||||||||||||||||||||||||||||||||||||||
| Copper Concentrate |
(USDm) | 4,054 | 222 | 348 | 390 | 417 | 413 | 382 | 447 | 462 | 508 | 394 | 71 | |||||||||||||||||||||||||||||||||||||||
| Gold |
(USDm) | 3,607 | 195 | 292 | 335 | 372 | 371 | 334 | 401 | 416 | 465 | 361 | 65 | |||||||||||||||||||||||||||||||||||||||
| Silver |
(USDm) | 235 | 15 | 31 | 33 | 24 | 24 | 23 | 24 | 23 | 22 | 15 | 2 | |||||||||||||||||||||||||||||||||||||||
| Copper |
(USDm) | 212 | 13 | 24 | 23 | 21 | 18 | 25 | 22 | 23 | 21 | 18 | 5 | |||||||||||||||||||||||||||||||||||||||
| Total Gross Revenue |
(USDm) | 7,946 | 413 | 671 | 797 | 887 | 873 | 772 | 861 | 888 | 949 | 707 | 129 | |||||||||||||||||||||||||||||||||||||||
| Gold |
(USDm) | 7,282 | 373 | 589 | 714 | 817 | 807 | 702 | 794 | 821 | 885 | 659 | 120 | |||||||||||||||||||||||||||||||||||||||
| Silver |
(USDm) | 428 | 26 | 55 | 58 | 46 | 45 | 42 | 43 | 42 | 40 | 28 | 4 | |||||||||||||||||||||||||||||||||||||||
| Copper |
(USDm) | 235 | 14 | 27 | 25 | 23 | 20 | 27 | 24 | 25 | 24 | 20 | 5 | |||||||||||||||||||||||||||||||||||||||
| Effective Date January 1, 2021 | Aris Gold | |||
| Page 362 of 384 |
| SRK Consulting | Soto Norte NI 43-101 – Feasibility Study |
| 22.6 | Economic Evaluation Results |
Results of the economic evaluation are presented in Table 22.6. Undiscounted payback is achieved 3.9 years after the start of processing (NTP = 4).
At a base 5% discount rate, the Project post-tax NPV is USD1,486M at the inputs presented above, a sensitivity to discount rate is presented in Table 22.7. The internal rate of return is 20.8%.
The annual cash flows are presented graphically on an undiscounted basis in Figure 22.4 (not shown are the post closure environmental monitoring costs) and in tabular form in Table 22.8.
Table 22.6: Economic Evaluation Results
| Key Indicators |
Units | Breakdown | Total | |||||||||||||
| LOM Total Au Production (payable) |
(koz) | 4,348 | ||||||||||||||
| Average Annual Production |
(koz) | 450 | ||||||||||||||
| LOM Average Net C1 Cash Cost (1) |
|
(USD/ oz) |
271 | |||||||||||||
| LOM Average AISC (2) |
|
(USD/ oz) |
471 | |||||||||||||
| LoM (Mining) |
(Years) | 14 | ||||||||||||||
|
|
LoM (Processing) |
(Years) | 11 | |||||||||||||
| Gross Revenue |
(USDM) | 7,946 | ||||||||||||||
| Operating Costs (incl. realisation) |
(USDM) | (2,211) | ||||||||||||||
|
|
|
|||||||||||||||
| EBITDA |
(USDM) | 5,735 | ||||||||||||||
| Tax |
(USDM) | (1,480) | ||||||||||||||
| Project Capital |
(USDM) | (982) | ||||||||||||||
| Pre-production Sustaining Expenditure |
(USDM) | (34) | ||||||||||||||
| Capitalised Operating Expenditure |
(USDM) | (114) | ||||||||||||||
| Capitalised Allocated Overhead Costs |
(USDM) | (47) | ||||||||||||||
|
|
|
|||||||||||||||
| Initial Capital including pre-production costs |
(USDM) | (1,177) | ||||||||||||||
| Sustaining |
(USDM) | (317) | ||||||||||||||
|
|
|
|||||||||||||||
| Net Free Cash, Undiscounted |
(USDM) | 2,761 | ||||||||||||||
| NPV at 5% (Post-Tax) |
(USDM) | 1,486 | ||||||||||||||
| IRR (Post-Tax) |
(%) | 20.8 | ||||||||||||||
| Payback period (from start of operations, NTP = 4) |
(Years) | 3.9 |
1 cash costs exclude royalty and allocated overheads, inclusive of by-product credit and capitalised operating costs
2 AISC as per World Gold Council.
Table 22.7: NPV at Different Discount Rates
| Discount rate |
Units | Pre-Tax NPV | Post Tax NPV | |||||||
| 0.0% |
(USDm) | 4,242 | 2,761 | |||||||
| 2.0% |
(USDm) | 3,398 | 2,166 | |||||||
| 4.0% |
(USDm) | 2,721 | 1,689 | |||||||
| 5.0% |
(USDm) | 2,433 | 1,486 | |||||||
| 7.0% |
(USDm) | 1,941 | 1,142 | |||||||
| 9.0% |
(USDm) | 1,542 | 863 | |||||||
| 10.0% |
(USDm) | 1,370 | 744 | |||||||
| 12.0% |
(USDm) | 1,075 | 539 |
| Effective Date January 1, 2021 | Aris Gold | |||
| Page 363 of 384 |
| SRK Consulting | Soto Norte NI 43-101 – Feasibility Study |
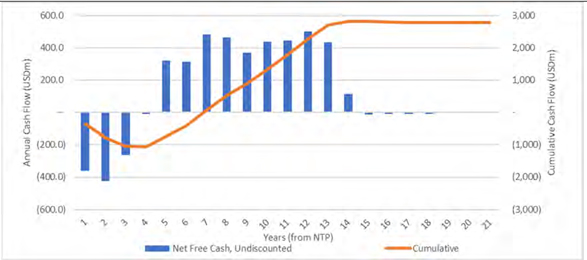
Figure 22.4: Cash Flow Schedule (Post-Tax)
| Effective Date January 1, 2021 | Aris Gold | |||
| Page 364 of 384 |
| SRK Consulting | Soto Norte NI 43-101 – Feasibility Study |
Table 22.8: LoM Cashflow Schedule
|
Parameter |
Units | Total | 1 | 2 | 3 | 4 | 5 | 6 | 7 | 8 | 9 | 10 | 11 | 12 | 13 | 14 | 15+ | |||||||||||||||||||||||||||||||||||||||||||||||||||
| Total Gross Revenue |
(USDm | ) | 7,946 | - | - | - | 413 | 671 | 797 | 887 | 873 | 772 | 861 | 888 | 949 | 707 | 129 | - | ||||||||||||||||||||||||||||||||||||||||||||||||||
| Operating Costs |
||||||||||||||||||||||||||||||||||||||||||||||||||||||||||||||||||||
| Mining costs |
(USDm | ) | 693 | - | - | - | 62 | 84 | 83 | 67 | 65 | 72 | 65 | 61 | 57 | 58 | 19 | - | ||||||||||||||||||||||||||||||||||||||||||||||||||
| Processing costs |
(USDm | ) | 307 | - | - | - | 19 | 30 | 31 | 31 | 31 | 31 | 31 | 31 | 30 | 30 | 14 | - | ||||||||||||||||||||||||||||||||||||||||||||||||||
| Realisation costs |
(USDm | ) | 589 | - | - | - | 31 | 56 | 64 | 64 | 59 | 62 | 64 | 64 | 66 | 49 | 9 | - | ||||||||||||||||||||||||||||||||||||||||||||||||||
| Environmental management plan |
(USDm | ) | 53 | - | - | - | 5 | 7 | 5 | 4 | 3 | 3 | 2 | 2 | 2 | 2 | 2 | 17 | ||||||||||||||||||||||||||||||||||||||||||||||||||
| Mine site G&A |
(USDm | ) | 85 | - | - | - | 9 | 8 | 8 | 8 | 8 | 8 | 8 | 8 | 7 | 7 | 7 | - | ||||||||||||||||||||||||||||||||||||||||||||||||||
| Allocated overheads |
(USDm | ) | 160 | - | - | - | 12 | 16 | 15 | 15 | 15 | 15 | 15 | 15 | 15 | 15 | 14 | - | ||||||||||||||||||||||||||||||||||||||||||||||||||
| Royalties |
(USDm | ) | 272 | - | - | - | 14 | 23 | 27 | 30 | 30 | 27 | 29 | 30 | 32 | 24 | 4 | - | ||||||||||||||||||||||||||||||||||||||||||||||||||
| Closure |
(USDm | ) | 41 | - | - | - | - | - | - | - | - | - | - | - | - | - | - | 41 | ||||||||||||||||||||||||||||||||||||||||||||||||||
| Change in working capital |
(USDm | ) | 10 | 2 | 4 | (1 | ) | 133 | (33 | ) | 62 | (13 | ) | (2 | ) | 0 | 9 | 14 | (6 | ) | (73 | ) | (90 | ) | 3 | |||||||||||||||||||||||||||||||||||||||||||
| Total Operating Costs |
(USDm | ) | 2,211 | 2 | 4 | (1 | ) | 286 | 191 | 295 | 206 | 208 | 216 | 222 | 224 | 204 | 112 | (19 | ) | 60 | ||||||||||||||||||||||||||||||||||||||||||||||||
| EBITDA |
(USDm | ) | 5,735 | (2 | ) | (4 | ) | 1 | 127 | 480 | 502 | 681 | 665 | 555 | 639 | 664 | 745 | 594 | 148 | (60 | ) | |||||||||||||||||||||||||||||||||||||||||||||||
| Corporate Income Tax |
(USDm | ) | 1,480 | - | - | - | - | 109 | 135 | 175 | 178 | 149 | 178 | 189 | 208 | 144 | 16 | - | ||||||||||||||||||||||||||||||||||||||||||||||||||
| Capital Expenditure |
||||||||||||||||||||||||||||||||||||||||||||||||||||||||||||||||||||
| Project |
(USDm | ) | 982 | 298 | 364 | 216 | 102 | (0 | ) | - | 0 | (0 | ) | 0 | 0 | 0 | 0 | 1 | 0 | - | ||||||||||||||||||||||||||||||||||||||||||||||||
| Mining |
(USDm | ) | 365 | 67 | 94 | 127 | 75 | (0 | ) | - | 0 | (0 | ) | 0 | 0 | 0 | 0 | 1 | 0 | - | ||||||||||||||||||||||||||||||||||||||||||||||||
| Process Plant/DSF/EPCM |
(USDm | ) | 239 | 98 | 122 | 19 | 1 | - | - | - | - | - | - | - | - | - | - | - | ||||||||||||||||||||||||||||||||||||||||||||||||||
| Other EPC |
(USDm | ) | 231 | 95 | 104 | 29 | 3 | (0 | ) | - | - | - | - | - | - | - | - | - | - | |||||||||||||||||||||||||||||||||||||||||||||||||
| Owners |
(USDm | ) | 9 | - | - | - | 9 | - | - | - | - | - | - | - | - | - | - | - | ||||||||||||||||||||||||||||||||||||||||||||||||||
| Contingency |
(USDm | ) | 138 | 39 | 43 | 42 | 14 | - | - | - | - | - | - | - | - | - | - | - | ||||||||||||||||||||||||||||||||||||||||||||||||||
| Sustaining |
(USDm | ) | 351 | 8 | 4 | 1 | 21 | 50 | 52 | 25 | 25 | 38 | 26 | 30 | 35 | 17 | 19 | - | ||||||||||||||||||||||||||||||||||||||||||||||||||
| Mining |
(USDm | ) | 263 | 0 | 0 | 1 | 19 | 27 | 41 | 22 | 21 | 35 | 21 | 20 | 31 | 16 | 9 | - | ||||||||||||||||||||||||||||||||||||||||||||||||||
| Processing |
(USDm | ) | 43 | 7 | 3 | - | 1 | 2 | 5 | 2 | 3 | 1 | 1 | 7 | 3 | - | 9 | - | ||||||||||||||||||||||||||||||||||||||||||||||||||
| EPCM related |
(USDm | ) | 37 | - | - | - | 0 | 21 | 5 | 1 | 1 | 1 | 3 | 1 | 1 | 1 | 1 | - | ||||||||||||||||||||||||||||||||||||||||||||||||||
| G&A |
(USDm | ) | 8 | 1 | 1 | 0 | 1 | 1 | 0 | 0 | 0 | 1 | 0 | 1 | 0 | 0 | 0 | - | ||||||||||||||||||||||||||||||||||||||||||||||||||
| Capitalised Operating Costs |
(USDm | ) | 114 | 40 | 36 | 29 | 9 | - | - | - | - | - | - | - | - | - | - | - | ||||||||||||||||||||||||||||||||||||||||||||||||||
| Capitalised Allocated Overhead |
(USDm | ) | 47 | 11 | 16 | 16 | 4 | - | - | - | - | - | - | - | - | - | - | - | ||||||||||||||||||||||||||||||||||||||||||||||||||
| Total Capital Expenditure |
(USDm | ) | 1,494 | 357 | 420 | 262 | 136 | 50 | 52 | 25 | 25 | 38 | 26 | 30 | 35 | 18 | 20 | - | ||||||||||||||||||||||||||||||||||||||||||||||||||
| Financial Summary |
||||||||||||||||||||||||||||||||||||||||||||||||||||||||||||||||||||
| Net Free Cash (Post Tax) |
(USDm | ) | 2,761 | (359 | ) | (423 | ) | (262 | ) | (9 | ) | 321 | 314 | 481 | 461 | 369 | 435 | 445 | 501 | 433 | 113 | (60 | ) | |||||||||||||||||||||||||||||||||||||||||||||
| Net C1 Cash Costs |
(USD/oz | ) | 271 | - | - | - | 428 | 293 | 252 | 215 | 206 | 252 | 216 | 200 | 188 | 251 | 597 | - | ||||||||||||||||||||||||||||||||||||||||||||||||||
| AISC |
(USD/oz | ) | 471 | - | - | - | 658 | 547 | 475 | 358 | 351 | 440 | 364 | 353 | 342 | 392 | 1,127 | - |
| Effective Date January 1, 2021 | Aris Gold | |||
| Page 365 of 384 |
| SRK Consulting | Soto Norte NI 43-101 – Feasibility Study |
| 22.7 | Sensitivity |
SRK ran generic sensitivities on metal prices, operating costs, and capital expenditure, given in Figure 22.5, which shows that the project economics are most sensitive to metal prices but are sufficiently robust to remain economically positive over the range of cost increases assessed. A similar sensitivity of NPV and main economic parameters to gold prices is shown in Table 22.9.
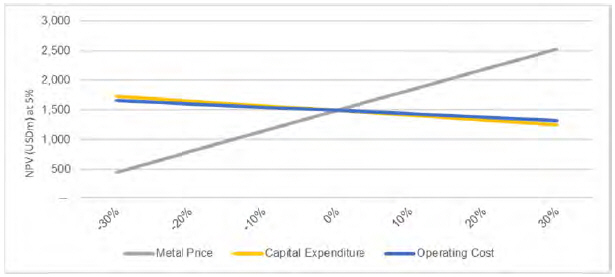
| Figure 22.5: |
NPV (5%) Sensitivity to Metal Price and Costs | |
| Table 22.9: |
NPV (5%), net cash-flow, IRR and payback period sensitivity to gold price | |
| Gold price |
Unit | 1,425 | 1,475 | 1,525 | 1,575 | 1,625 | 1,675 | 1,725 | 1,775 | 1,825 | 1,875 | 1,925 | ||||||||||||||||||||||||||||||||||
| After-tax net cashflow |
||||||||||||||||||||||||||||||||||||||||||||||
|
(undiscounted) |
(USDm) | 2,026 | 2,173 | 2,320 | 2,467 | 2,614 | 2,761 | 2,908 | 3,055 | 3,202 | 3,349 | 3,497 | ||||||||||||||||||||||||||||||||||
| After-tax NPV (5%) |
(USDm) | 1,013 | 1,107 | 1,202 | 1,297 | 1,392 | 1,486 | 1,581 | 1,676 | 1,770 | 1,865 | 1,960 | ||||||||||||||||||||||||||||||||||
| After-tax IRR |
(%) | 16.7 | 17.6 | 18.4 | 19.2 | 20.0 | 20.8 | 21.5 | 22.3 | 23.0 | 23.7 | 24.4 | ||||||||||||||||||||||||||||||||||
|
Payback years from startup |
(Years) | 4.4 | 4.3 | 4.2 | 4.1 | 4.0 | 3.9 | 3.8 | 3.7 | 3.6 | 3.5 | 3.5 |
| 22.8 | Conclusion |
The economic evaluation demonstrates the economic viability of the Mineral Reserve under the currently assumed valid set of assumptions, as presented above. Generic sensitivities on metal prices, operating costs, and capital expenditure show that the project economics are most sensitive to metal prices but are sufficiently robust to remain economically positive over the range of cost increases assessed.
| Effective Date January 1, 2021 | Aris Gold | |||
| Page 366 of 384 |
| SRK Consulting | Soto Norte NI 43-101 – Feasibility Study |
| 23 | ADJACENT PROPERTIES |
This section is not relevant to this Technical Report.
| Effective Date January 1, 2021 | Aris Gold | |||
| Page 367 of 384 |
| SRK Consulting | Soto Norte NI 43-101 – Feasibility Study |
| 24 | OTHER RELEVANT DATA AND INFORMATION |
| 24.1 | Project Execution Plan |
| 24.1.1 | Introduction |
The Project Execution Plan (PEP) has been developed for the Soto Norte Project. The PEP outlines the plans, resources, mechanisms and procedures that the project will follow and Minesa expects from the successful EPCM contractor. The PEP covers all aspects of the Soto Norte Project from commencement of basic engineering design through to commissioning.
The PEP is a live document and therefore will be revised and updated as required throughout the course of the project. This initial version of the plan is based on knowledge of the project scope at the completion of the FS. The successful EPCM contractor will revise it at the inception of the basic engineering phase, and it shall be updated at regular agreed intervals and project milestones including:
| ● | Completion of basic engineering |
| ● | Completion of detailed design |
| ● | Frequently throughout the construction phase. |
The ownership of the PEP during project execution shall reside with the successful EPCM contractor’s Project Director, with delegated ownership of component plans as recommended in Table 24.1.
Table 24.1: Recommended PEP Delegated Ownership
| Plan | Delegated Ownership | |
|
Project safety, health and environmental management plan |
EPCM HSE Manager | |
|
Project quality management plan |
EPCM Quality Manager | |
|
Project controls execution plan |
EPCM Project Controls Manager | |
|
Finance and administration plan |
Minesa Project Admin. Manager | |
|
Project human resource plan |
Minesa HR Manager | |
|
Engineering project execution plan |
EPCM Engineering Manager | |
|
Project procurement and contracting plan |
EPCM Procurement Manager | |
|
Project construction plan |
EPCM Construction Manager | |
|
Project preoperational verification plan |
EPCM Commissioning Manager | |
|
Project risk management plan |
Minesa Risk Manager | |
|
Project close out plan |
EPCM Area Managers | |
24.1.2 Policies and Guidelines
Project governance will be as per Minesa corporate requirements. The EPCM contractor, its representatives, its employees and its sub-contractors, construction contractors and vendors must comply with all applicable Minesa Safety Health and Environment (“HSE”) and local community policy requirements and with all guidelines, procedures, and regulations (corporate and regional) of Minesa and the project site.
| Effective Date January 1, 2021 | Aris Gold | |||
| Page 368 of 384 |
| SRK Consulting | Soto Norte NI 43-101 – Feasibility Study |
The Minesa HSE corporate policy will be complied with in its entirety during the execution phase of the Project.
| 24.1.3 | Organisational Planning and Project Team |
The organisation structure for the Project is provided in Figure 24.1 and for the construction stage in Figure 24.2. The Project Management Team (“PM team”) will be an integrated team comprised of the Minesa personnel, the EPCM contractor, and various engineering sub-contractors. The PM Team will oversee and direct all engineering, procurement, and construction activities for the project.
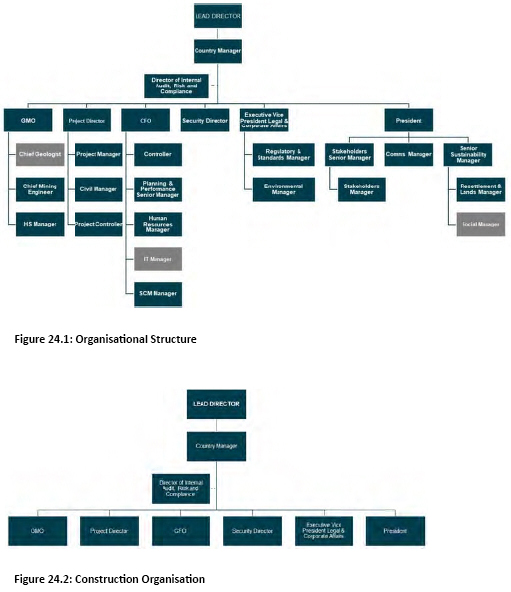
The key entities in the PM team of the Project are:
| ● | Board of Directors: responsible for providing approval of the overall project budget, schedule and execution strategy as well as the approval of changes which are outside the sanctioned scope of the Project |
| ● | Project Director reports to the Minesa Board of Directors and is responsible for the construction of the Project |
| Effective Date January 1, 2021 | Aris Gold | |||
| Page 369 of 384 |
| SRK Consulting | Soto Norte NI 43-101 – Feasibility Study |
| ● | General Manager Operations (“GMO”) reports to the Minesa Board of Directors and is responsible for the operation of the Project |
| ● | Area and Functional Managers report to the Project Director and are responsible for ensuring the execution of their respective mandates in the Project is in accordance with Minesa project and corporate policies and guidelines working towards handover to Minesa GMO |
| ● | Operations Team will report to the GMO |
| ● | Security Director is responsible for security across the Project and operational deliveries/concentrate |
| ● | HR Manager responsible for recruitment, compensation policies, and community employment programs. |
EPCM Project Director
The EPCM Project Director will have overall day-to-day responsibility for the EPCM activities. The Project Director is responsible for the execution of the Project in accordance with the Contract and attaining Minesa and EPCM contractor’s corporate goals.
Area Manager
The Area Managers will have full responsibility (cost, schedule and quality) for the delivery of each of their areas of scope. They will work in a matrix fashion across disciplines to manage and execute their scope of work.
Functional Managers
The Functional Managers will report to the Project Director and will be responsible for ensuring that the necessary resources are available to meet the requirements of the individual Project Managers and that the work is undertaken in accordance with the Project codes, standards and procedures. The Functional Managers are responsible for the timely development of documentation in accordance with the Project Schedule.
The Functional Managers are:
| ● | Engineering Manager: Responsible for producing the detailed engineering in accordance with the Project schedule and the required codes, standards and quality control. |
| ● | Procurement Manager: Responsible for the procurement process from the establishment of the bidders’ lists through evaluation, award, administration and closeout of contracts and purchase orders. Approval of contracts and purchase orders and any variation orders will remain the responsibility of Minesa. In addition, the Procurement Manager will be responsible for vendor inspections, expediting and logistics. |
| ● | Project Controls Manager: Responsible for the detailed planning and scheduling of Project scope of work and for the monitoring and reporting of Project costs and progress. |
| ● | Construction Manager: Responsible for the implementation of the HSE program on site, the establishment of the temporary facilities, the coordination of the work of the contractors on-site and the administration of contracts. |
| Effective Date January 1, 2021 | Aris Gold | |||
| Page 370 of 384 |
| SRK Consulting | Soto Norte NI 43-101 – Feasibility Study |
| ● | Pre-operational Verification Manager: Responsible for the pre-operational verification and handing over of systems and facilities to the Minesa operations team for commissioning. |
Members of the EPCM Project Team report to their respective Functional Managers for quality and to Project Managers for scope, content, delivery and approvals.
Other Site Managers
In addition to the area and functional managers, the Project-wide strategic Managers of Environment, Health and Safety, Risk, Administration, and Quality Assurance will also be responsible for reporting to the Project Director. They will ensure that the overall Project objectives are met in their area of jurisdiction.
24.1.4 Staffing Plan
A staffing plan has been developed for the construction years (CY) as shown in Table 24.2 and the operational stages (Table 24.3) of the Project which show the estimated peak contractor and staffing requirements (Bucaramanga and Site) for each year during Project construction and the initial 10 years of operation.
The estimates represent the peak employment level in each year and include full time Minesa hires and short-term labour used to accommodate short term variations in staffing requirements. The figures do not include long-term contract labour, such as construction contractors and mining contractors
Table 24.2: Summary of Construction Contractor requirements
| Contractor Schedule | CY1 | CY2 | CY3 | CY4 | ||||||
| EPCM Contract – Direct Labor |
165 | 873 | 1,085 | 250 | ||||||
| EPCM Contract – Indirect Labor |
59 | 330 | 442 | 143 | ||||||
| EPCM/HSE/Vendor Reps |
- | 110 | 110 | 40 | ||||||
| Contingency (10%) |
26 | 131 | 164 | 43 | ||||||
| TOTAL Contractors* |
246 | 1,445 | 1,800 | 476 |
* not included in labor cost or Subcontractors (rounded)
Table 24.3: Summary of Operations Personnel
| Operations Personnel | NTP 0 | NTP 1 | NTP 2 | NTP 3 | NTP 4 | NTP 5 | NTP 6 | NTP 7 | NTP 8 | NTP 9 | NTP 10 | |||||||||||||||||||||||||||||||||||
| Mine and Support |
69 | 93 | 101 | 105 | 85 | 85 | 86 | 776 | 749 | 666 | 659 | |||||||||||||||||||||||||||||||||||
|
Processing |
- | - | 12 | 64 | 82 | 82 | 81 | 81 | 81 | 81 | 81 | |||||||||||||||||||||||||||||||||||
|
Administration Labour |
110 | 113 | 112 | 81 | 79 | 78 | 78 | 78 | 78 | 78 | 78 | |||||||||||||||||||||||||||||||||||
|
Construction Management |
19 | 23 | 23 | 15 | 4 | 4 | 4 | 4 | 4 | 4 | 4 | |||||||||||||||||||||||||||||||||||
|
Total FTE’s |
198 | 229 | 248 | 265 | 250 | 249 | 249 | 939 | 912 | 829 | 822 | |||||||||||||||||||||||||||||||||||
24.1.5 Project Execution Locations
Project Office
The EPCM and Minesa Project team will be located in the same Project office. The Project office will be in Bucaramanga and will be the primary location for project management, project controls and information management systems, procurement and purchase order administration, engineering management and document control, administration, quality assurance, and risk management.
Construction Sites
All construction related operations will be catered in the construction office at the site near Suratá. The primary functions undertaken from the construction site offices will include construction management;
| Effective Date January 1, 2021 | Aris Gold | |||
| Page 371 of 384 |
| SRK Consulting | Soto Norte NI 43-101 – Feasibility Study |
health, safety, environmental and quality management; site management, including security; contract administration; field procurement and materials management; field planning and progress monitoring; industrial relations; field engineering and quality control; pre-operational verification; and commissioning.
| 24.1.6 | Health and Safety and Environment Plan |
The Project HSE Plan will be managed on a project-wide basis by the EPCM contractor. This plan should meet or exceed the requirements contained in Minesa HSE Management Regulations, Colombian Law, and stipulated in the approved ESIA and PTO agreements. This plan will include a Health and Safety Management System, the Environmental Management Plan and the Emergency Response Plan.
The HSE Management Plan will detail processes and procedures to ensure the following:
| ● | Appropriate environmental management practices are followed through to the closure and reclamation phase |
| ● | Work environments are safe for Minesa and EPCM contractor’s employees, and all other stakeholders throughout all Project sites |
| ● | No harm will come to people, installations, facilities, equipment or to the environment. |
| 24.1.7 | Quality Management Plan |
The EPCM contractor shall deploy their QMS in alignment with the requirements of the International Standard ISO 9001:2015 and Minesa Quality Management Requirements.
The specific objectives of the QMS related to the Project will be to ensure that activities are organised, controlled, and effectively discharged such that:
| ● | The EPCM contractor will perform the work and meet the Project targets for safety, quality, budget and schedule |
| ● | The detailed design complies with the Project Specifications, requirements, and applicable regulatory and local authority requirements |
| ● | Peer reviews are conducted |
| ● | Equipment, materials and services selected are supplied in accordance with specifications, standards and conditions specified for the Project |
| ● | The facilities are assembled and installed in accordance with requirements specified for the Project |
| ● | Any detected performance or product shortfalls are expeditiously resolved, and corrective action is taken to prevent recurrence. |
| 24.1.8 | Project Controls Execution Plan |
The objective of Project Controls is to drive a consistent application of the controls work processes to provide project performance transparency and improve project certainty through services such as, planning and scheduling, estimating, and budgeting and cost control. EPCM contractor will develop a Project Controls Execution plan, incorporating Minesa procedures and requirements.
| 24.1.9 | Engineering Project Execution Plan |
| Effective Date January 1, 2021 | Aris Gold | |||
| Page 372 of 384 |
| SRK Consulting | Soto Norte NI 43-101 – Feasibility Study |
This Engineering Execution Plan (“EEP”) has been developed and shall be updated by the EPCM contractor early in the basic engineering phase and periodically updated as required during the detailed engineering and execution phases.
The purpose of this generic EEP for Engineering is to outline Minesa expectations and requirements for engineering, during the development and execution on the Project. The basic functions of detailed engineering are to prepare and issue engineering drawings, specifications, bills of material, and bid documents as needed for the fabrication and construction of facilities and infrastructure, and the supply and installation of equipment, materials, and services.
The EPCM contractor’s EEP shall define how technical expertise in the project team will be transferred to commissioning, operations and maintenance teams. This shall include manuals, training, shared resources and the early involvement of operations and maintenance personnel in the project execution, commissioning and start-up.
| 24.1.10 | Procurement and Contracting Plan |
The Contract and Procurement plan will cover the supply of equipment, materials, and services for the Project. The plan is based on the need to meet Project objectives in terms of safety, cost, schedule and quality while maintaining Minesa’s local participation initiatives. Procurement activities must be fully compliant with all relevant regulations and laws and demonstrate the integrity and principles of the business. The EPCM contractor procurement group will provide control and direction and will maintain overall responsibility for procurement activities conducted. They are also responsible for liaising with the team members of Minesa, Project Management, Engineering, Project Services and the Construction Management.
| 24.1.11 | Construction Execution Plan |
The construction strategy is based on operating five main construction areas including resettlement, process plant, civil infrastructure, specialised packages, mining and services. The EPCM contractor will manage the construction activities on behalf of Minesa, excluding the mine development. The primary objective of the EPCM construction team is to safely manage the delivery and coordination of the Soto Norte Project field activities up to the point of mechanical completion. The team ensures compliance with HSE procedures, quality plans, schedule, contracts management, and manages site construction logistics and coordination between construction contractors, to ensure a safe and efficient delivery of the project.
| 24.1.12 | Material Management Plan |
The EPCM contractor and Minesa will be responsible for material management, shipping and receiving as well as warehousing on and off site. Minesa will oversee all offsite logistics, except for the receival at site which will be managed by the EPCM contractor. The contractor shall also be responsible for all onsite materials management and the development of a material management system.
A contractor mobilisation plan will also be developed for the early and full scope construction activities by the construction managers and engineering superintendents. This will ensure a plan is developed for contractors for the execution of earthworks, roadworks and for the full scope of works for all three sites.
| 24.1.13 | Commissioning Execution Plan |
Commissioning will be broken up into two general stages including Pre-operational Verification (“POV”) and
| Effective Date January 1, 2021 | Aris Gold | |||
| Page 373 of 384 |
| SRK Consulting | Soto Norte NI 43-101 – Feasibility Study |
Commissioning. Table 24.4 shows each phase of Commissioning and responsibility of each stage of the Project.
Table 24.4: Commissioning Execution Plan
| Phase | Description | Detailed Description | Responsibility | |||||
| Pre-Operational Verification |
C0 | Verification of plant and equipment (mechanical completion) | Verification by the construction team that installation of an individual item of plant or equipment meets the design intent | EPCM contractor | ||||
| C1 | Dry commissioning | Inspection and no-load energization of an item of plant or equipment by the POV team to verify conformance with design | EPCM contractor | |||||
| C2 | Wet commissioning (practical completion) | Testing of an individual or group of integrated items of plant or equipment under benign load (air or water) ultimately demonstrating stable operation of a process commissioning module under this load | EPCM contractor | |||||
| Commissioning |
C3 | Ore commissioning | Initial introduction of ore and process fluids and testing of an individual or group of integrated process commissioning modules to demonstrate stable operation at design operating parameters | Owner’s operation team | ||||
| C4 | Performance verification | Successful demonstration that an individual or group of integrated commissioning areas can be operated to achieve predefined performance parameters | Owner’s operation team | |||||
| C5 | Area acceptance | Acceptance of an individual or group of integrated commissioning areas by the principal | Owner’s operation team | |||||
| C6 | Commissioning close out | Completion of all commissioning activities including preparation of a commissioning close-out report and handover of agreed commissioning documentation deliverables to Minesa | Owner’s operation team | |||||
| 24.1.14 | Risk Management Plan |
The purpose of the Risk Management Plan (“RMP”) is to define the responsibilities and activities to implement effective risk management to the pre-execution, execution and operation project phases. EPCM contractor will be responsible for updating and maintaining the Project Risk Register.
The objectives of the RMP are to:
| ● | Identify risks of concern in the facilities being designed, constructed and operated |
| ● | Identify risks that may impact the project KPI’s |
| ● | Terminate or transfer risks where possible/appropriate |
| ● | Develop risk mitigation (or risk treatment plans) where risk termination or transfer is not possible/appropriate |
| ● | Demonstrate due diligence by identifying and fully assessing all material risks, taking appropriate measures to control them, and ensuring that the justification for accepting the residual risk is adequate |
| ● | Demonstrate that risks identified during the study phase can be appropriately managed during the project implementation/execution phase |
| Effective Date January 1, 2021 | Aris Gold | |||
| Page 374 of 384 |
| SRK Consulting | Soto Norte NI 43-101 – Feasibility Study |
| ● | Identify any key risks for reporting on the Risk Register |
| ● | Monitor and review risks associated with the project on a continual basis. |
| 24.1.15 | Licencing and Permitting |
The Project Execution Plan outlines the permitting requirements for the construction of the project and the licenses to operate. The EPCM contractor will not be required to manage the licensing and permitting of Minesa Project. The EPCM contractor will assist Minesa by providing support in the assembling of supporting documents as required for approvals from the various authorities.
| 24.1.16 | Financial and Administration Plan |
The Minesa Finance and Administration team shall provide the necessary support to the Project execution team and shall handle all accounting and administrative tasks. As such, Minesa will be responsible for the Financial and Administration Plan to control costs and provide professional accounting and administration services to the Project team and EPCM contractor’s employees.
| 24.1.17 | Human Resources Plan |
The Human Resources (“HR”) mandate will encompass hiring, inductions, project communications and management of the human resources required for Minesa and EPCM contractor’s scope of services. Minesa and the EPCM staffing requirements will be based on the requirements of the Minesa staffing plan and workforce forecasting as agreed in the EPCM contractor’s proposal. Persons will be assigned to the Project in accordance with the terms of the EPCM contract and the approval of an assignment will require the approval of the EPCM contractor’s Project Director. In key management positions as defined in the EPCM contract, the approval of Minesa Project Manager shall also be required. In the case of any expatriates, the HR Manager will assist the individual and their families, where required in getting established at their new location.
| 24.1.18 | Project Close Out Plan |
The objective of the project closeout plan is to provide a structured approach to capturing documentation from the execution phase required for ongoing management of operations and future sustaining capital works, as well as to support future opportunities to modify the project assets.
Project closeout requirements are required from each of the EPCM contractor’s functional departments and shall be the responsibility of that Department’s Manager. These responsibilities include ensuring that files are complete and archived both in hard copy and electronically, in a clear and logical manner.
| Effective Date January 1, 2021 | Aris Gold | |||
| Page 375 of 384 |
| SRK Consulting | Soto Norte NI 43-101 – Feasibility Study |
| 25 | INTERPRETATIONS AND CONCLUSIONS |
| 25.1 | Introduction |
The Soto Norte Project is anticipated to become one of the largest and most technologically advanced, underground hard-rock mines in Colombia in the coming years. Minesa has taken a long-term view of the Project with an approach to incorporate significant development, infrastructure and equipment capital investment which should provide greater efficiencies and the benefit of lower operating costs. The mineralised structures extend to the surface and are open at depth and along strike, with high exploration potential to target the deep structures from underground drilling stations.
Minesa has undertaken extensive trade-off studies, detailed modelling exercises and feasibility study revisions (following external reviews) to further optimise and de-risk the Project. Practical solutions have been determined for locating surface infrastructure and underground access in challenging terrain in order to minimise impact to settlements in the vicinity of the Project as well as materials handling and sourcing of waste underground for backfill requirements.
| 25.2 | Exploration, Drilling, Sampling and Data Collection |
SRK has reviewed the data collection methodologies and an extensive review of the assay and geology database during the Mineral Resource estimation procedure and noted no material issues in the final database. It is the QP’s opinion that the data provided is adequate for estimation of Mineral Resources.
SRK has considered sampling quality, sampling density and distance from samples to classify the Mineral Resource according to the 2014 CIM Definition Standards. Data quality, drillhole spacing and the interpreted continuity of grades controlled by the deposit have allowed SRK to classify portions of the veins in the Indicated and Inferred Mineral Resource categories.
| 25.3 | Mineral Processing, Metallurgical Testwork and Recovery Methods |
The level of testwork conducted to date in support of the proposed flowsheet meets typical expectations for a FS level of study. Flotation testwork has extended to LCT, which are of sufficient quality to parameterise the circuit and derive the recoveries of the minor elements. The geometallurgical testwork program represents a significant investment in understanding and quantifying the metallurgical variability in the deposit and have been incorporated into the block model.
SRK recommends that the first phase of detailed design should be a GAP analysis and basic engineering work to review the Ausenco redesign and address any gaps that must be resolved before moving forward with the detailed engineering phase.
| 25.4 | Mine Planning |
The mine planning approach is well developed and integrated for the Project with practical solutions incorporated to manage the anticipated geotechnical and hydrogeological challenges. The application of Modified Avoca mining, temporary rib pillars and recovery of sill pillars under grout stabilised rockfill has been successfully implemented on many occasions at underground mining operations and provides the opportunity to increase ore recovery of the ore at lower levels of dilution. Examples of operating mines have been provided where similar mining approaches have been developed and successfully implemented.
Underground quarries are not unique and provide many advantages for the Project to source backfill waste required for the Modified Avoca method. The quarry stopes provide additional flexibility for production
| Effective Date January 1, 2021 | Aris Gold | |||
| Page 376 of 384 |
| SRK Consulting | Soto Norte NI 43-101 – Feasibility Study |
activities without the reliance of backfill waste from development activities or sourcing on surface and transporting underground. Once the individual waste stopes are completed there is an opportunity to store dry filtered tailings underground.
The mine plan includes significant investment in pre-production development and materials handling infrastructure (including pass systems) which will reduce equipment requirements and operating costs when the mine is in production. The TBM access drive from Padilla will enable efficient underground materials handling and water management over the LoM.
| 25.5 | Environmental Studies, Permitting and Social or Community Impact |
The regulatory regime in Colombia is robust and, in most cases, aligned with GIIP as represented by the IFC Performance Standards. Where gaps exist, Minesa has identified this and put plans in place to address this once the Colombian requirements have been met.
While the environmental and social studies are considered sufficiently advanced to meet FS level, in SRK’s view there are some areas of uncertainty and risk.
| ● | Despite there being a regulated authority review period, Minesa has recognised and is developing plans to address what may be a lengthy approval process, likely exceeding two years from submission of the ESIA. The restart of the approval process gives opportunity to both stakeholders and regulators to raise further objections to the Project. This may affect project schedules and potentially costs. Once approved, the licence is valid for the life of the project, although it may be modified for minor changes. Minesa has identified such changes that may be required as detailed engineering replaces the preliminary engineering completed for the FS. |
| ● | There are known sensitivities in terms of biodiversity (protected habitats and species of conservation importance) and cultural heritage (sacred springs) that have the potential to be affected directly by the project. Although extensive work to understand these impacts has been undertaken, there is always inherent risk in the impact modelling and so Minesa will proactively manage and closely monitor these receptors to confirm the low impact predictions. |
| ● | There are both positive and negative social impacts arising from the project along with existing tensions that are not directly related to the Project. Examples of tensions include disagreement between the national government and local municipalities over allowing the exploitation of natural resources and government crackdown on illegal small-scale mining. The negative impacts and tensions have the potential to lead to community opposition. Extensive programmes developed by Minesa to address areas like artisanal mining, leadership capacity building, community planning and social development aim to target potential areas of concern. |
| ● | Minesa cannot formally finalise the RAP and reach an agreement with the affected communities until the environmental license is granted, and therefore some land acquisition and resettlement needs to be undertaken. A FRAP has been developed to guide the resettlement planning process and necessary studies and negotiations required to prepare a final RAP. There is a risk the land acquisition and resettlement process may take longer than currently envisaged, particularly if expropriation is required. |
| 25.6 | Markets and Contracts |
The Soto Norte Project will produce separate copper and gold-rich pyrite concentrates. Concentrates will be bagged and containerised before being exported via road followed by river transportation to a seaport
| Effective Date January 1, 2021 | Aris Gold | |||
| Page 377 of 384 |
| SRK Consulting | Soto Norte NI 43-101 – Feasibility Study |
on the Atlantic coast.
Marketing assumptions used in the economic analysis were based on direct engagements with numerous potential offtakers. No contracts are currently in place for any production from the Project.
| 25.7 | Capital Cost Estimates |
Estimated total capital expenditure over the LoM is estimated at USD1,333m (excluding any operating costs incurred during the pre-production period) and comprises USD1,014m project capital and sustaining/deferred capital of USD318m.
| 25.8 | Operating Cost Estimates |
The overall LOM production operating cost estimate is USD2,160m with unit costs of USD87.2/t ore and USD496.8/oz Au. Pre-production operating costs total USD166m and post-closure operating costs total USD46m.
| 25.9 | Economic Analysis |
The economic evaluation demonstrates the economic viability of the Mineral Reserve under the currently assumed valid set of assumptions. At a base 5% discount rate, the post-tax NPV of the Project is USD1,486m with an IRR of 20.8%, The payback period from the start of operations (NTP = 4) is 3.9 years.
The LOM average AISC is USD471 per ounce.
SRK has run generic sensitivities on metal prices, operating costs, and capital expenditure, which shows that the project economics are most sensitive to metal prices but sufficiently robust to remain economically positive over the range of cost increases assessed
| 25.10 | Project Risks and Management |
The Minesa Risk Management Framework defines the systematic application of management policies, procedures and practices to the activities of setting risk appetite, identifying, analysing, evaluating, treating, monitoring and reviewing risk. Effective risk management can minimise the potential for a project or operation to suffer unplanned and unwanted events and outcomes.
Selected Risk levels by SRK, included in the Risk Register, are summarised below:
| ● | Coexistence Program: Minesa has sought to preserve traditional mining practice in California (specifically within the Soto Norte Project area) while reducing incursions on Minesa’s land and the environmental contamination arising from the artisanal miners’ use of mercury and cyanide. |
| o | The highest risks identified for Coexistence are: |
| – | Illegal mining and community unrest. |
| – | Inadequate community relationships / Loss of social license to operate. |
| o | Minesa has created the Coexistence Program to consolidate and formalise artisanal miners under an organisational structure that would provide them access to better mineral resources, safer working conditions, and more environmentally sustainable infrastructure. |
| ● | Project Execution: The highest risks identified are: |
| o | Delays in obtaining land access. |
| Effective Date January 1, 2021 | Aris Gold | |||
| Page 378 of 384 |
| SRK Consulting | Soto Norte NI 43-101 – Feasibility Study |
| o | Inadequate roads and key infrastructure. |
| o | Incorrect TBM & other critical path contractor selection. |
| o | Long lead items delay. |
| ● | Environment Management Plan: The highest risks identified are: |
| o | Delay in approval of ESIA. |
| o | Rejection or additional conditions by the ANLA. |
| o | Public perception of negative effects that mining will have on the environment. |
| ● | Marketing: The Soto Norte Project will produce a copper concentrate with high gold content and a gold bearing pyrite concentrate. Both concentrates are regarded as precious metal concentrates because most of the value is due to the gold content. |
| o | The highest risks identified for marketing are volatility of commodity prices and failure of an off taker to take the volume. |
| o | Minesa has engaged BQR to assist in the development of a comprehensive marketing and logistics strategy and set up its in-house marketing team to further engage with potential offtakers. |
Minesa has the RMP to define the responsibilities and activities to implement effective risk management to the pre-execution, execution and operation project phases. Other potential risks identified by SRK for the Project include:
| ● | Mine Development and Production: |
| o | Development rates will be reliant on investigating and successfully managing ground and water conditions ahead of development. |
| o | Grade control prior to mining is essential for stope delineation in order to manage mining recovery and dilution. |
| o | Stope (and pillar) stability will need to be continuously monitored and managed through backfill and pressure grout stabilisation. |
| ● | Environmental Permitting: Due to uncertainties on the timing for future award of permits the project schedule is based on a yet to be determined NTP. Minesa will need to prepare a strategy and timeline for project development as well as permitting through discussions with its advisors and the government regulators. Minesa will need to continue working closely with the regulatory authorities and provide detailed information to prove the effectiveness of mitigation measures developed to manage the various impacts. |
| 25.11 | Project Opportunities |
The parallel vein systems in the Soto Norte Project area are defined over a strike length of 2.6 km and the two main vein systems considered, Mascota and Gigante, each have strike lengths of around 2.0 km. Other minor vein structures of mining interest have strike lengths as low as 15 m. The vein structures extend to surface, and are open at depth and along strike, presenting opportunities for expansion through exploration drilling.
There are numerous opportunities on the Project to further investigate and optimise the project development plan leading into a producing mine. There are a couple of years of project development time once NTP
| Effective Date January 1, 2021 | Aris Gold | |||
| Page 379 of 384 |
| SRK Consulting | Soto Norte NI 43-101 – Feasibility Study |
commences when additional geotechnical and hydrogeological investigation can be undertaken to better understand the challenges and appropriate means of management.
SRK believes that with good quality management and a commitment to investment, these challenges can be overcome which is incorporated into the mining approach. The lead time to develop access into the mine provides an opportunity to investigate and gather key geotechnical and hydrogeological data to inform a future, more detailed mine plan. The mine design and schedule can be further optimised with respect to mining methods, backfill approach and materials handling, particularly in the initial years of the mine life.
There will be significant opportunities for refinement of the mine plan as it is developed, particularly how to treat and support challenging ground and water conditions for development and stability of production stopes. Where possible, the opportunities for increasing stope sizes to reduce the stope turnover and minimise development should be investigated.
Minesa has an opportunity to build on its ongoing community development initiatives to maintain its social licence to operate and, by showing a proactive approach to both environmental and social management, show how modern mining can enhance an area rather than degrade it. Commitments to affect this management and monitoring are clearly laid out in the ESIA and should assist in managing the above risks and uncertainties.
| 25.12 | Conclusions |
The mine design and scheduling work undertaken is sufficiently detailed to have confidence that the currently identified Measured and Indicated Mineral Resources are sufficient in tonnage and grade to achieve a sustainable production rate of 2.6 Mtpa over a 7-year period. The economic assessment undertaken achieves a positive economic outcome under the current set of assumptions as listed, and hence supports the Mineral Reserve estimate.
It is the conclusion of the QPs that the FS summarised in this technical report contains sufficient detail and accuracy to support a feasibility level analysis. Standard industry practices, equipment and design methods were used in this FS and except for those outlined in this section, the report authors are unaware of any unusual or significant risks or uncertainties that would affect project reliability or confidence based on the data and information made available.
The main priority for the Project is to address the design concerns of ANLA which is likely to require additional studies including a re-evaluation of environmental and social impacts, and re-start of the environmental permitting process and timeframes.
| Effective Date January 1, 2021 | Aris Gold | |||
| Page 380 of 384 |
| SRK Consulting | Soto Norte NI 43-101 – Feasibility Study |
| 26 | RECOMMENDATIONS |
The planned mine development and production schedule for Soto Norte presents challenges for Minesa and a key consideration is the availability of highly skilled management, technical team, mine operators, and maintenance support. Minesa will require significant support from the Owner team, International Contractors, and Suppliers to develop access and maintain steady state production at a rate of 2.6 Mtpa.
The Project risks associated with the understanding of the geotechnical conditions are low. SRK considers that there are several risks that will require addressing and mitigating during further study iterations or during preliminary mine development. These are:
| ● | The underground capital infrastructure and proposed quarry stopes lie outside the boundary of the 3D geotechnical model. Whilst ground support has been estimated using average deposit rock mass conditions, there is no location specific rock mass information for these large excavations. Ground investigation programmes will need to be commissioned for these prior to final design and excavation. |
| ● | The mine is located in a structurally complex area with a potentially complex in situ stress regime. In situ stress is an important input into numerical models, however, for the numerical models run for the in-situ stress estimates have been made using empirical equations and with reference to the World Stress Map. To improve and validate the numerical modelling site specific in situ stress measurements will be required at some stage. This can either by done in deep boreholes or during initial trial mining. |
| ● | For the TBM access tunnel, out of necessity, geotechnical conditions have been interpolated over long distances between site investigation boreholes. It is possible that the ground conditions between boreholes may be better or worse than interpreted and that the excavation methods and support requirements may need to be modified. Probe drilling will need to be employed during tunnel excavation to confirm ground conditions ahead of the advancing face. |
| ● | This geotechnical modelling was conducted using assumed theoretical stresses, however, the models should be computed with real field stress measurements once these become available. It is recommended to carry out further sensitivity models varying the initial stress state to address the possible outcomes when higher horizontal or higher vertical stresses occur. |
The mine plan is highly dependent on the ore pass system for underground materials handling and efforts should be directed to optimise the design and cost while minimising the likely risks for production. Some of the main work identified for the underground mining aspects of the Project are summarised as follows:
| ● | Underground electrical and underground communication packages need to be updated to reflect changes in the mine plan. Whilst the opinion is that the underground electrical and underground communication packages have sufficient levels of detail to accurately estimate the cost for the Soto Norte Project, for a matter of completeness it is recommended that these packages be updated to align with the presented mine plan. |
| ● | To successfully implement mining of pillars under grout stabilised fill, laboratory testing and trial pillar extraction will need to be undertaken to refine the equipment, consumables and approach. |
| ● | Further geotechnical numerical modelling is recommended for execution particularly in the areas of: |
| o | The possibility of connection between the uppermost stopes and the surface |
| o | The stress state around the decline. |
| Effective Date January 1, 2021 | Aris Gold | |||
| Page 381 of 384 |
| SRK Consulting | Soto Norte NI 43-101 – Feasibility Study |
| ● | The current location of underground waste quarry stopes is strategically proximate to mining areas to reduce materials handling to backfill areas throughout the mine life. Prior to excavating these waste stopes, sterilisation drilling should be undertaken to identify any gold mineralisation in the designated areas and refine stope locations. |
| ● | Optimisation of the ventilation design considering: |
| o | In the design of the Emboque shaft bottom area, high pressure losses are expected which requires additional design consideration such as larger or parallel drifts. The number of sharp turns and corners need to be reduced to maintain reasonable fan operating pressures. For this study, it was assumed that larger entries, and in some cases parallel entries, were constructed. If no changes are made to the size or number of entries the fan operating points will be higher. |
| o | This study focused on a wide range of operating years to estimate fan and power requirements over the life of the project. Additional modelling of initial start-up of the mine could provide better resolution to this critical stage and could help identify any bottlenecks or potential design issues during the first two years of the development. |
| o | The ventilation models were built entirely with k-factor resistance values. While these resistance values are certainly appropriate for planning purposes, they could be refined by measuring the actual resistances in the ventilation system. SRK recommends measuring actual resistance values of airways and critical ventilation controls, as they are constructed, to improve the accuracy of ventilation models. Improved input data from field measurements can add confidence to future predicted operating parameters and better justify future capital expenses. Collecting and correlating heat model data can also help to generate a plan for distribution of equipment and airflow, especially when production occurs in the deeper portions of the mine. |
The importance of water resources in the vicinity of the Project was recognised early in the Project development process. SRK recommends the following further work:
| ● | Consider further studies to better predict the dewatering water quality and whether the temporary water treatment at Emboque is required and therefore reduce the early project capital. Pumping tests have already been proposed by SRK to help better define and reduce construction inflows to the Emboque decline and this would serve as a potential opportunity to undertake further water quality sampling and analysis and to reduce the uncertainty in the geochemical modelling predictions. |
| ● | Monitor groundwater inflow rates and piezometer responses during the initial months of mine development and update models and modify design inflow rates where appropriate. |
| ● | Conduct the additional site investigations required to optimise grouting design and establish the viability of dewatering wells at the Emboque decline area considering: |
| o | A grout-curtain is planned between the Emboque and La Bodega mining areas to minimise groundwater drawdown to the east of the mine operation. The mine schedule has been developed to enable early installation of the grout-curtain and additional site investigation and hydrogeological characterisation has been planned to support the detailed design of the grout curtain. Future versions of the mine plan will also need to consider advancing the TBM tunnel to the eastern end of La Bodega to facilitate site investigation and testing from underground at the earliest available opportunity. |
| o | For the purposes of the mine design, it is assumed that areas beneath La Baja stream will require pre-grouting to minimise the risk of inflows from surface water. Further hydrogeological |
| Effective Date January 1, 2021 | Aris Gold | |||
| Page 382 of 384 |
| SRK Consulting | Soto Norte NI 43-101 – Feasibility Study |
| characterisation of the surficial deposits beneath La Baja will be undertaken at the detailed design stage to determine if this is necessary. |
| o | The complex hydrogeological setting of the Project results in a significant uncertainty over the precise location and magnitude of groundwater inflows. It is therefore essential that the detailed design of the dewatering and grouting programme is supported by additional site investigation and hydrogeological characterisation. |
| o | Update the designs of the storm water diversions around the DSF to ensure they are practical, and able to manage climatic events as per the design criteria. |
| ● | Geochemical characterisation has been undertaken to inform the design of water containment and treatment facilities at the site. The predictive geochemical models indicate acid rock drainage and metal leaching is a potential for waste rock, dry filtered tailings and mine working contact water, and thus treatment at various locations will be required. SRK has identified that further optimisation studies are required to ensure the chosen treatment technologies can produce the required discharge quality. This will need to be confirmed through bench scale and pilot scale testing. Given the sensitivity of water-related aspects in underground mining, Minesa has committed to implementing robust follow-up and monitoring plans to control the effectiveness of the outlined measures. |
| ● | Further work is required on the closure plan and cost estimate, particularly with respect to the potential for post closure management of water. |
SRK notes and endorses the following recommendations made by Ausenco in relation to metallurgical testwork:
| ● | Flotation testwork using (simulated) process water, to assess the impact of water quality. SRK adds that such testwork should use site water as the starting water source |
| ● | Geometallurgical testwork extended to weathered and oxidised material |
| ● | Thickening and filtration testwork at design conditions for concentrates and tailings. |
SRK understands that the selection of a single stage SAG mill was made on the basis of assumptions including a reduced plant footprint requirement and a reduced capital cost for the milling circuit. While acknowledging this, SRK believes that additional consideration should be made of the inherent operational difficulties presented by a single stage SAG mill operating in closed circuit both with coarse (pebble crusher) and fine (hydrocyclones) recycle streams, in addition to impact of the variability in tonnage and grind size that such a circuit is likely to produce on the process units downstream of the comminution circuit. SRK notes that the mill will be fitted with a variable speed drive, however, to minimise the negative impact of the high design circulating load at potentially low load levels, SRK recommends that the SAG mill is fitted with a twin chamber pulp lifter (Outotec Turbo Pulp Lifter or similar) to maximise the mill’s discharge efficiency.
SRK recommends that future work on the DSF should focus on:
| ● | Further geotechnical testing on representative tailings samples from filtration tests to determine residual strength and whether the materials are contractive or dilative at the point of failure and to determine whether the moisture contents are representative of those that can be achieved during operation. Additional geotechnical testing should be completed on representative tailings samples from all areas of the LoMP ore to confirm parameters for future stability analyses and design. |
| ● | Review the footprint area available on the upper deck of the DSF to ensure that there is sufficient |
| Effective Date January 1, 2021 | Aris Gold | |||
| Page 383 of 384 |
| SRK Consulting | Soto Norte NI 43-101 – Feasibility Study |
| area for storage of off-specification dry filtered tailings during periods of high rainfall. |
| ● | The design documentation highlights the importance of managing seepage, drainage and surface water flows to ensure that design constraints are not exceeded. The sizing of the critical contact and non-contact water management features should be updated for design storm annual exceedance probabilities that are appropriate to a ‘High Consequence’ tailings storage facility. |
| ● | The cost estimates prepared for the DSF design should be updated to reflect additional capital costs associated with forming the proposed benched geometry (basal slope areas) and construction of additional surface and drainage water management features (cut/fill to form access roads and channels and concrete drop structures adjacent to the main embankment; increased drain and pond sizes). Operating cost estimates should also be re-appraised, to ensure that the costs associated with rework and compaction of dry filtered tailings on the DSF are factored into the cost model. |
SRK makes the following recommendations regarding the on-site infrastructure:
| ● | More detail is required on the dry filtered tailings conveyor system from the plant to the edge of the DSF. SRK understands that testwork to inform conveyor design is still to be undertaken (flow tests, transportable moisture content). |
The capital and operating cost estimates have been by numerous contributors including Minesa and third-party consultants. The Project has undergone many changes and would benefit from a full rebuild of first principles cost estimate going forward for the base case with an improved formatting and streamlining of inputs, assumptions and unit cost costs.
| 26.1 | Forward Work Plan |
Since completion of the Soto Norte Feasibility Study, Minesa has progressed efforts to socialise the Project with the Bucaramanga community to improve the social license to operate. Technical studies are also ongoing to reassess the underground mining method and opportunities for storing a significant portion of the dry filtered tailings underground as paste fill, reducing surface storage requirements.
Minesa is also progressing ESIA documentation based on ANLA’s feedback and field work for the next Environmental License filing in early 2023.
The budget estimate for forward planning works in 2022 and 2023 totals USD34m with the allocation comprising:
| ● | USD7.7m for taxes, legal obligations (environmental and mining compliance), tenement provisions, resettlement and CSR programs |
| ● | USD6.8m for ESIA work including technical mining, backfill and DSF studies and documentation |
| ● | USD3.6m for social communications and engagement |
| ● | USD15.9m for overheads and payroll. |
| Effective Date January 1, 2021 | Aris Gold | |||
| Page 384 of 384 |
| SRK Consulting | Soto Norte NI 43-101 – Feasibility Study |
| 27 | REFERENCES |
| ● | ALS (2016). ALS Global Assay Procedures (Feasibility Study, Appendix 7-15). |
| ● | AMEC (2012) Scoping Study completed September 2012 and prepared by AMEC Minproc Engenharia e Consultoria Ltda (AMEC Minproc) for AUX Colombia Ltda. |
| ● | Ausenco (2013). Seismic hazard assessment (Feasibility Study, Appendix 5-1). |
| ● | Ausenco (2020). Updated Feasibility Study for the Soto Norte Project – Process Plant dated January 2020. |
| ● | Ball J. (2008). Arenal Volcano (Volcán Arenal). Available at: www.geology.com. |
| ● | Carman C. (2016). Independent mapping report. |
| ● | CIM (2014). Canadian Institute of Mining, Metallurgy and Petroleum Standards on Mineral Resources and Reserves: Definitions and Guidelines, May 10, 2014. |
| ● | Coffey (2012). Independent Technical Report on Mineral Resources dated 31 July 2012 for AUX Colombia Ltda. El Gigante Gold Project, Colombia South America. |
| ● | Coffey (2013). Independent Technical Report on Mineral Resources (Vol I & II) dated 31 January 2013 for AUX Colombia Ltda. El Gigante Gold Project, Colombia South America. |
| ● | Cordova M. et. al (2016). Laboratory Testing of Cemented Rock Fill for Open Stope Support, Seventh International Conference & Exhibition on Mass Mining, 9-11 May 2016. |
| ● | de Souza (2012). La Bodega Project – Ideal Drilling Grid for Resource Classification. Colombia. |
| ● | ERM (BESIA, 2018). Bankable Environmental and Social Impact Assessment (BESIA) (Feasibility Study, Appendix 19-01). |
| ● | Geoexmin (2016). Revision de Datos de Control de Calidad de Campaña de Perforaciòn - Version Final. |
| ● | Geotecnologia (2020). Site-specific seismic hazard assessment for the DSF, in 2020. |
| ● | Golder (2017). Laboratory report for Paste Backfill Assessment (1665827 Minesa Lab Report 2017 08 02 S.PDF). |
| ● | HMV (2019). Power Connection Trade-off Study. Actualización estudio de conexión al sistema interconectado nacional; documento 3120-11-EL-ST-001 REVISIÓN No. 5. |
| ● | Hoek et. al (2013). Quantification of the Geological Strength Index Chart. Rock Mechanics / Geomechanics Symposium held in San Francisco, California. |
| ● | Horner (2010). Angostura gold-silver mining project, Santander, Colombia Geotechnical open-pit design (prefeasibility study). |
| ● | IDEAM (2011). Ïndice de disponibilidad Hídrica (IDH Metodologia de cálculo y aplicación en Colombia. Nota técnica del IDEAM-METEO/003. 5 ed., Santa Fé de Bogotá: IDEAM. |
| ● | IDEAM (2013). Hoja metodológica del indicador Índice de calidad del agua (version 1,00). Sistema de Indicadores Ambientales de Colombia- Indicadores de calidad del agua superficial. |
| ● | Ingeominas (2007). Geological Map of Colombia 2007. |
| Effective Date January 1, 2021 | Aris Gold | |||
| Page i of iii |
| SRK Consulting | Soto Norte NI 43-101 – Feasibility Study |
| ● | Lowell (1970). Lateral and Vertical Alteration-Mineralisation Zoning in Porphyry Ore Deposits. Economic Geology. |
| ● | MDRU (2012). Preliminary bedrock and tectonic map, California-Vetas, Santander and Norte de Santander Departments. Colombia: Mineral Deposits Research Unit, University of British Columbia. |
| ● | Minesa (2016). Working Document by Minesa. |
| ● | Minesa (2017). Working Document by Minesa. |
| ● | Minesa (2018). Working NSR Calculation spreadsheet by Minesa. |
| ● | Minesa (2019a). Working Document by Minesa. |
| ● | Minesa, (2019b). Environmental Social Impact Assessment (2019 ESIA). ESIA submission and supporting documents (Feasibility Study, Appendix 19-02). |
| ● | Minesa (2020). Working Document by Minesa. |
| ● | O’Prey (2008). NI 43-101 Technical Report on the California-Vetas Property dated 14 June 2008 for Ventana Gold Corporation. |
| ● | P&C (2018a). Soto Norte Backfill Basic Engineering – UDS Hydraulic Assessment (32-0269-00- HY-REP-0001 Rev A UDS Hydraulic Assessment.pdf). |
| ● | P&C (2018b). Soto Norte Backfill Basic Engineering – Paste Test Work Report (32-0269-00-TW-REP-0002 Rev A Paste Test Work Report.pdf). |
| ● | Porras (2016). Minesa internal QA/QC report. |
| ● | Pulido (2003). Seismotectonics of the Northern Andes (Colombia) and the development of seismic networks. Bulletin of the International Institute of Seismology and Earthquake Engineering. |
| ● | Reeves (2006). NI 43-101 Technical Report on the California-Vetas Property dated 10 April 2006 for Ventana Gold Corporation. |
| ● | Rodrigues (2014). Geology, Alteration, Mineralization and Hydrothermal Evolution of the La Bodega-La Mascota deposits, California-Vetas Mining District, Eastern Cordillera of Colombia; Northern Andes. Colombia: MSc, Thesis, University of British Columbia, 471 p. |
| ● | Royero (2001). Mapa Geológico Generalizado del Departamento de Santander, Escala 1:400.000. Memoria Explicativa. S.l.:INGEOMINAS. |
| ● | Samuel Engineering (2010). NI 43-101 Technical Report entitled ‘Preliminary Assessment of the La Bodega Project’ dated 8 November 2010 for Ventana Gold Corporation. |
| ● | SGS (2018). Geochemical testwork was undertaken by SGS laboratories, Lakefield, Ontario. |
| ● | Sillitoe (2010). Porphyry copper systems: Economic Geology, v. 105. |
| ● | SNC (2017), Pre-Feasibility Study completed May 2017 and prepared by SNC with major authoring contributions from Minesa and SRK (Ref: 636279-0000-30RA-0001 Rev. PB). |
| ● | SNC (2019a), FS level “Complimentary Design of the Soto DSF (SNE-PM-FIS-GEO-REP-0001 > Original > Rev. A. dated 25 November 2019. |
| ● | SNC (2019b). DSF Design Improvement Progress Updates PowerPoint Presentation. |
| ● | Sourineni et. al (2016). A Dilution-based Stability Graph for Open Stope Design. MassMin Conference 2016. |
| Effective Date January 1, 2021 | Aris Gold | |||
| Page ii of iii |
| SRK Consulting | Soto Norte NI 43-101 – Feasibility Study |
| ● | SRK (2012). NI 43-101 Technical Report on Resources California Gold-Silver Project Santander Department Colombia, South America, dated 25 October 2012 for Galway Resources. |
| ● | SRK (2016a) Soto Norte Project: Mineral Resource Estimate. |
| ● | SRK (2016b). Structural geology of the Soto Norte Gold Project. U6658_Soto Norte Structural Study_Report_Final_Rev1.pdf, Santander, Colombia. |
| ● | SRK (2017). A Technical Hydrogeological Report on the Soto Norte Project, Colombia (Feasibility Study, Appendix 18-02). |
| ● | SRK (2018). Mineral Resource Estimation, Galway and Calvista Properties, Colombia. Report prepared by SRK Consulting for Minesa, effective date June 11, 2018, report date November 6, 2018. |
| ● | SRK (2019a). Soto Norte Project: Mineral Resource Estimate. SotoNorte_MRE_Report_538700- 010_Rev12_20190919.pdf. Colombia. |
| ● | SRK (2019b). Addendum to the Hydrogeological Report on the Soto Norte Project. |
| ● | SRK (2020). Soto Norte Feasibility Study Grouting Assessment for Underground Mine Planning (Feasibility Study, Appendix 18-06). |
| ● | TechnoTectonics (2012). ”Updated Technical Report on the California Gold Project, California, Santander Department, Republic of Colombia” dated 11 October 2012 for Calvista Gold Corporation. |
| ● | Ward D. et al (1973). Geología de los Cuadrángulos H-12, Bucaramanga j H-13, Pamplona, Dept. Santander. USGS e Ingeominas, Boletin Geológico, Volume XXI, pp. 1-132. |
| ● | WorleyParsons (2017a). Soto Norte Project Feasibility Study Dry Stack Facility – Design Review (Draft Report) dated 07 December 2017. |
| ● | WorleyParsons (2017b). Soto Norte DSF Drawing Set dated 13 December 2017. |
| ● | WorleyParsons (2019a). Drainage System DSF – Report. 209031-00001 108-CI-CAL-0020 dated 10 July 2019. |
| ● | WorleyParsons (2019b). DSF Stability Calculation dated 10 January 2019. |
| Effective Date January 1, 2021 | Aris Gold | |||
| Page iii of iii |
| SRK Consulting | Soto Norte NI 43-101 – Feasibility Study |
Glossary – Technical Studies
| Feasibility Study | Means a comprehensive technical and economic study of the selected development option for a mineral project that includes appropriately detailed assessments of applicable Modifying Factors together with any other relevant operational factors and detailed financial analysis that are necessary to demonstrate, at the time of reporting, that extraction is reasonably justified (economically mineable). The results of the study may reasonably serve as the basis for a final decision by a proponent or financial institution to proceed with, or finance, the development of the project. The confidence level of the study will be higher than that of a Pre-Feasibility Study. | |
| Pre-Feasibility Study | The CIM Definition Standards requires the completion of a Pre-Feasibility Study as the minimum prerequisite for the conversion of Mineral Resources to Mineral Reserves. A Pre-Feasibility Study is a comprehensive study of a range of options for the technical and economic viability of a mineral project that has advanced to a stage where a preferred mining method, in the case of underground mining, or the pit configuration, in the case of an open pit, is established and an effective method of mineral processing is determined. It includes a financial analysis based on reasonable assumptions on the Modifying Factors and the evaluation of any other relevant factors which are sufficient for a Qualified Person, acting reasonably, to determine if all or part of the Mineral Resource may be converted to a Mineral Reserve at the time of reporting. A Pre-Feasibility Study is at a lower confidence level than a Feasibility Study. | |
| Glossary – Mineral Resources and Mineral Reserves | ||
| Mineral Reserves | Mineral Reserves are sub-divided in order of increasing confidence into Probable Mineral Reserves and Proven Mineral Reserves. A Probable Mineral Reserve has a lower level of confidence than a Proven Mineral Reserve. A Mineral Reserve is the economically mineable part of a Measured and/or Indicated Mineral Resource. It includes diluting materials and allowances for losses, which may occur when the material is mined or extracted and is defined by studies at pre-feasibility or feasibility level as appropriate that include application of Modifying Factors. Such studies demonstrate that, at the time of reporting, extraction could reasonably be justified. The reference point at which Mineral Reserves are defined, usually the point where the ore is delivered to the processing plant, must be stated. It is important that, in all situations where the reference point is different, such as for a saleable product, a clarifying statement is included to ensure that the reader is fully informed as to what is being reported. | |
| Proven Mineral Reserves | A Proven Mineral Reserve is the economically mineable part of a Measured Mineral Resource. A Proven Mineral Reserve implies a high degree of confidence in the Modifying Factors. Application of the Proven Mineral Reserve category implies that the Qualified Person has the highest degree of confidence in the estimate with the consequent expectation in the minds of the readers of the report. The term should be restricted to that part of the deposit where production planning is taking place and for which any variation in the estimate would not significantly affect the potential economic viability of the deposit. Proven Mineral Reserve estimates must be demonstrated to be economic, at the time of reporting, by at least a Pre-Feasibility Study. | |
| Probable Mineral Reserves | A Probable Mineral Reserve is the economically mineable part of an indicated, and in some circumstances, a Measured Mineral Resource. The confidence in the Modifying Factors applying to a Probable Mineral Reserve is lower than that applying to a Proven Mineral Reserve. The Qualified Person(s) may elect, to convert Measured Mineral Resources to Probable Mineral Reserves if the confidence in the Modifying Factors is lower than that applied to a Proven Mineral Reserve. Probable Mineral Reserve estimates must be demonstrated to be economic, at the time of reporting, by at least a Pre-Feasibility Study. | |
| Mineral Resource | A concentration or occurrence of solid material of economic interest in or on the earth’s crust in such form, grade or quality and quantity that there are reasonable prospects for eventual economic extraction. The location, quantity, grade or quality, continuity and other geological characteristics of a Mineral Resource are | |
| Effective Date January 1, 2021 | Aris Gold | |||
| Page A1 of A7 |
| SRK Consulting | Soto Norte NI 43-101 – Feasibility Study |
| known, estimated or interpreted from specific geological evidence and knowledge, including sampling. Mineral Resources are sub-divided, in order of increasing geological confidence, into Inferred, Indicated and Measured categories. | ||
| Measured Mineral Resource | ||
| That part of a Mineral Resource for which quantity, grade or quality, densities, shape, and physical characteristics are estimated with confidence sufficient to allow the application of Modifying Factors to support detailed mine planning and final evaluation of the economic viability of the deposit. Geological evidence is derived from detailed and reliable exploration, sampling and testing and is sufficient to confirm geological and grade or quality continuity between points of observation. A Measured Mineral Resource has a higher level of confidence than that applying to either an Indicated Mineral Resource or an Inferred Mineral Resource. It may be converted to a Proven Mineral Reserve or to a Probable Mineral Reserve. | ||
| Indicated Mineral Resource | ||
| That part of a Mineral Resource for which quantity, grade or quality, densities, shape and physical characteristics are estimated with sufficient confidence to allow the application of Modifying Factors in sufficient detail to support mine planning and evaluation of the economic viability of the deposit. Geological evidence is derived from adequately detailed and reliable exploration, sampling and testing and is sufficient to assume geological and grade or quality continuity between points of observation. An Indicated Mineral Resource has a lower level of confidence than that applying to a Measured Mineral Resource and may only be converted to a Probable Mineral Reserve. | ||
| Inferred Mineral Resource | ||
| That part of a Mineral Resource for which quantity and grade or quality are estimated on the basis of limited geological evidence and sampling. Geological evidence is sufficient to imply but not verify geological and grade or quality continuity. An Inferred Mineral Resource has a lower level of confidence than that applying to an Indicated Mineral Resource and must not be converted to a Mineral Reserve. It is reasonably expected that the majority of Inferred Mineral Resources could be upgraded to Indicated Mineral Resources with continued exploration. | ||
| Glossary – Development Status | ||
| Adjacent Property | ||
| Means a property (a) in which the issuer does not have an interest (b) that has a boundary reasonably proximate to the property being reported on, and (c) that has geological characteristics similar to those of the property being reported on. | ||
| Advanced Property | ||
| Means a property that has (a) mineral reserves, or (b) mineral resources the potential economic viability of which is supported by a preliminary economic assessment, a pre-feasibility study or a feasibility study. | ||
| Early-Stage Exploration Property | ||
| Means a property for which the technical report being filed has (a) no current mineral resources or mineral reserves defined, and (b) no drilling or trenching proposed. | ||
| Advanced Exploration Property | ||
| Properties where considerable exploration has been undertaken and specific targets have been identified that warrant further detailed evaluation, usually by drill testing, trenching or some other form of detailed geological sampling. A Mineral Resource estimate may or may not have been made, but sufficient work will have been undertaken on at least one prospect to provide both a good understanding of the type of mineralisation present and encouragement that further work will elevate one or more of the prospects to the resource category. | ||
| Pre-Development Property | ||
| Properties where Mineral Resources have been identified and their extent estimated (possibly incompletely) but where a decision to proceed with | ||
| Effective Date January 1, 2021 | Aris Gold | |||
| Page A2 of A7 |
| SRK Consulting | Soto Norte NI 43-101 – Feasibility Study |
| development has not been made. Properties at the early assessment stage, properties for which a decision has been made not to proceed with development, properties on care and maintenance and properties held on retention titles are included in this category if Mineral Resources have been identified, even if no further Valuation, Technical Assessment, delineation or advanced exploration is being undertaken. | ||
| Development Property | Properties for which a decision has been made to proceed with construction and/or production, but which are not yet commissioned or are not yet operating at design levels, | |
| Operating Mines | Mineral properties, particularly mines and processing plants that have been commissioned and are in production. | |
| Care and Maintenance/Closed Properties | ||
| Mineral properties, particularly mines and processing plants which have been either decommissioned or placed on care and maintenance pending an improvement in economic and/or technical operating environments. | ||
Abbreviations
| 3D | Three dimensional | |
| AACE | American Association of Cost Engineers | |
| AAS | Atomic Absorption Spectroscopy | |
| ABA | Acid Base Accounting | |
| ABI | abiotic | |
| ACME | ACME Analytical Laboratories, Vancouver | |
| AEP | Annual exceedance probabilities | |
| ALS | ALS Global laboratories | |
| ALS Colombia | ALS analytical laboratory in Colombia | |
| ALS Peru | ALS analytical laboratory in Peru | |
| AMEC | AMEC Minproc Engenharia e Consultoria Ltda | |
| ANLA | National Bureau of Environmental Licences | |
| ANM | National Mining Agency or Mining Authority | |
| AoI | Area of Interest | |
| Aris | Aris Gold Corporation | |
| Asomineros | Vetas Miners Association | |
| AuEQ | Gold Equivalent | |
| AUX | AUX Colombia S.A.S. | |
| AUX Acquisitions | AUX Acquisitions S.A.R.L | |
| BESIA | bankable environmental and social impact assessment | |
| BIO | Biotic | |
| BoQ | Basis of Quotation | |
| BQR | BlueQuest Resources AG | |
| BVB | Bodega Ventana Baja S.A.S | |
| Calvista | Sociedad Minera Calvista Colombia S.A.S. or Calvista Gold Corporation | |
| CCI | Corporación Colombia Internacional | |
| CD | Coarse duplicates | |
| CDA | Canadian Dam Association | |
| CDMB | Corporación Autónoma Regional Para la Defensa de la Meseta de Bucaramanga | |
| CEET | Comminution Economic Evaluation Tool | |
| CIM | Canadian Institute of Mining and Metallurgy | |
| CMS | Cavity Monitoring Survey | |
| Coffey Mining | Coffey Mining Pty Ltd | |
| COS | Coarse Ore Stockpile | |
| CP | Chartered Professional | |
| CRF | Cemented Rockfill | |
| CRM | Certified reference material | |
| CS | Check samples | |
| CSA | Canadian Securities Administrators | |
| CSR | Corporate Social Responsibility | |
| CV | coefficient of variance | |
| CVS | CVS Explorations Ltda., a Colombian subsidiary of Ventana | |
| Datamine | Datamine RM Mining |
| Effective Date January 1, 2021 | Aris Gold | |||
| Page A3 of A7 |
| SRK Consulting | Soto Norte NI 43-101 – Feasibility Study |
| DCS | Distributed Control System | |
| Deswik.SO | Deswik software Stope Optimiser module | |
| DSF | Dry Stack Facility | |
| DTH | down-the-hole (hammer drill) | |
| DTM | Digital Terrain Model | |
| EBX | EBX Group | |
| ECA | Export Credit Agency | |
| EEP | Engineering Execution Plan | |
| EIA | Environmental Impact Assessment | |
| El Portico | El Portico Core Logging Facility | |
| ELOS | Equivalent linear overbreak slough | |
| EMP | Environmental Management Plan | |
| EPCM | Engineering Procurement Construction Management | |
| ERM | Environmental Resources Management consulting group | |
| ESIA | Environmental and Social Impact Assessment | |
| ESMS | Environmental-Social Management System | |
| ESSA | Electrificadora de Santander S.A. E.S.P. | |
| FA | Fire Assay | |
| FBM | Basic mining format | |
| FEM | Finite Element Modelling | |
| FLEET | Flotation Economic Evaluation Tool | |
| FOS | Factor of Safety | |
| FRAP | Framework Resettlement Action Plan | |
| FS | Feasibility Study | |
| G&A | General and Administrative | |
| Galway | Galway Resources Holdco Ltd. Sucursal Colombia | |
| GCSRS | Grievances, Claims and Suggestions Response System | |
| GDP | Gross Domestic Product | |
| Geoexmin | Geological Consulting Exploration and Mining SpA | |
| Geotecnologia | Colombian engineering contractor | |
| GFW | Gigante ootwall f | |
| GIIP | good international industry practice | |
| GISTM | Global Industry Standard on Tailings Management | |
| GMA | Guías Minero Ambientales (Mining and Environmental guides) | |
| GMO | General Manager of Operations | |
| GSI | Geological Strength Index | |
| GZ | Gall Zeidler Consultants | |
| H&S | Health & Safety | |
| HDPE | High Density Poly Ethylene | |
| HMV | Engineering Group, HMV Ingenieros Ltda. | |
| HoV | Hill of Value | |
| HR | Human Resources | |
| HSE | Health and Safety and Environment | |
| HV | High voltage | |
| IBC | International Building Code | |
| ICP-AES | Inductively Coupled Plasma – Atomic Emission Spectroscopy | |
| ICP-MS | Inductively Coupled Plasma – Mass Spectrometry | |
| IDW2 | Inverse Distance power 2 | |
| IGAC | Instituto Geográfico Agustín Codazzi | |
| Integrated Concession 095-68 | Minesa’s concession contract 095-68 | |
| IP | Induced Polarisation (geophysics) | |
| IR | Infrared | |
| IRR | Internal Rate of Return | |
| ISA | Electrical Utility Group, Interconexión Eléctrica S.A. E.S.P | |
| ISRM | International Society of Rock Mechanics | |
| IUCN | International Union for Conservation of Nature | |
| Jn | Joint Set Number | |
| The 2012 Australasian Code for Reporting of Exploration Results, Mineral | ||
| JORC Code | Resources and Ore Reserves as published by the Joint Ore Reserves Committee of the Australasian Institute of Mining and Metallurgy, Australian Institute of Geoscientists and Minerals Council of Australia | |
| Jw | Joint Water Reduction Factor | |
| KPI | Key performance indicator |
| Effective Date January 1, 2021 | Aris Gold | |||
| Page A4 of A7 |
| SRK Consulting | Soto Norte NI 43-101 – Feasibility Study |
| LAN | Local Area Network | |
| LBFZ | La Baja Fault Zone | |
| LCT | Locked Cycle Test | |
| LHD | Load Haul Dump (loader) | |
| LIDAR | Light Detection and Ranging (survey) | |
| LIMS | Laboratory Information Management System | |
| LLDPE | Linear low-density polyethylene geomembrane liner | |
| LM IRE | Mascota Interim Resource Estimate | |
| LM MC | Mascota master composite | |
| LME | London Metal Exchange | |
| LoM | Life of Mine | |
| LoMP | Life of Mine Plan | |
| LRFZ | La Rosa Fault Zone | |
| LRS | Liquid Resistance Starter | |
| LSDS | large-scale direct shear (test) | |
| LTP | Commodity long-term price | |
| LV | Low voltage | |
| MADS | Ministry of the Environment and Sustainable Development | |
| MARC | Maintenance and Repair Contract | |
| MCE | Maximum Credible Earthquake | |
| MDRU | Mineral Deposit Research Unit, University of British Columbia | |
| MFT | MinnovEX Flotation Test | |
| MFW | Mascota footwall | |
| MHW | Mascota hangingwall | |
| MIC | Mubadala Investment Company | |
| Minesa | Sociedad Minera de Santander S.A.S. | |
| MMI | Mobil Metal Ion | |
| MRE | Mineral Resource Estimate | |
| Mw | Momentum Magnitude Scale | |
| NAG | non-acid generating | |
| NATM | New Austrian Tunnel Method | |
| NI 43-101 | National Instrument 43-101 Report | |
| NN | Nearest Neighbour | |
| NPV | Net Present Value | |
| NSR | Net Smelter Return | |
| NSR_BE | breakeven NSR cut off | |
| NSR-10 | Norma Colombiana para Construcción sismo resistente (Colombian Regulation for Anti-Seismic Construction) | |
| NTP | Notice to Proceed | |
| OEM | Original Equipment Manufacturer | |
| OK | Ordinary Kriging | |
| OMC | Optimum moisture content | |
| ORDBMS | Object-relational database management system | |
| OSA | On-Stream Analyser | |
| PAG | Potentially Acid Generating | |
| PAS | Process omation system Aut | |
| PD | Pulp icates dupl | |
| PD | Project Director | |
| PEER | Pacific Earthquake Engineering Research | |
| PEP | Project Execution Plan | |
| PFS | Pre-Feasibility Study | |
| PLT | Point Load Test | |
| PMA | Planes de Manejo Ambiental (environmental management plan) | |
| POV | Pre-operational rification Ve | |
| Project | Soto Norte Gold Project | |
| PTO | ‘Programa de Trabajo y Obras’ or ‘works and construction program’ | |
| PUEE | ‘‘Programa Único de Exploración y Explotación’ or ‘Exploration and Exploitation Program’ | |
| PVC | Polyvinylchloride (plastic pipe) | |
| QA | Quality Assurance | |
| QA/QC | Quality Assurance Quality Control | |
| QC | Quality Control | |
| QKNA | Quantitative Kriging Neighbourhood Analysis | |
| QMS | Quality Management System |
| Effective Date January 1, 2021 | Aris Gold | |||
| Page A5 of A7 |
| SRK Consulting | Soto Norte NI 43-101 – Feasibility Study |
| QP | Qualified Person | |
| RAP | Resettlement Action Plan | |
| RBC | Rotating biological contractor | |
| RMP | Risk Management Plan | |
| RMR | Rock Mass Rating | |
| RoM | Run of Mine | |
| RQD | Rock Quality Designation | |
| SAG | Semi-Autogenous Grinding | |
| SAI | Servicios Aéreos Industriais | |
| SENA | National Learning Service | |
| SNC | SNC-Lavalin consulting group | |
| SO | Stope Optimiser | |
| SOC | Social plans | |
| SPI | SAG Power Index | |
| SPMDD | Standard Proctor maximum dry density | |
| SRF | Stress Reduction Factor | |
| SRK | SRK Consulting (UK) Limited | |
| SRK Group | SRK Consulting (Global) Limited | |
| STP | Sewerage Treatment Plant | |
| SX/EW | solvent extraction and electrowinning | |
| TBM | Tunnel Boring Machine | |
| TCLP | Toxicity Characteristic Leaching Procedure | |
| TD | Twin duplicates | |
| TDC | Total Direct Costs | |
| TE | Total Error | |
| Technical Disciplines | geology and resource estimation; mining engineering and mineral reserves; mining geotechnical engineering; hydrogeology/hydrology; mineral processing; waste and dry filtered tailings engineering; geochemistry; water management; environmental and social; and financial evaluation | |
| TEP | Technical Economic Parameters | |
| TEU | Twenty-foot equivalent containers | |
| TML | Transportable Moisture Limit | |
| ToR | Terms of reference | |
| TRP | Temporary Rib Pillar | |
| UTM | Universal Transverse Mercator | |
| VAT | Value Added Tax | |
| Ventana or VGC | Ventana Gold Corporation | |
| VFD | Variable Frequency Drives | |
| VWP | Vibrating ire Piezometer W | |
| WBS | Work Breakdown Structure | |
| WebGen™ | Orica wireless initiation technology | |
| WGS- 84 | World Geodesic System 84 | |
| WRI | Water Regulation Index | |
| WTP | Water Treatment Plant | |
| WUI | Water Use Index | |
| X10 | Phinar X10 Geo software |
Units
| P80 | 80% passing size of the circuit product | |
| kW | Actual Power in kilowatts | |
| kVA | Apparent Power in kilowatts | |
| CDN | Canadian Dollars | |
| cm | centimetre | |
| COP | Colombian Peso | |
| m3 | cubic metre | |
| m3/s | cubic metres per second | |
| °C | Degrees centigrade | |
| dmt | dry metric tonne | |
| g | gram | |
| g/t | grams per tonne | |
| g | ground acceleration (where specified, cm/s2) |
| Effective Date January 1, 2021 | Aris Gold | |||
| Page A6 of A7 |
| SRK Consulting | Soto Norte NI 43-101 – Feasibility Study |
| kg | kilogram | |
| km | kilometre | |
| kV | kilovolt | |
| kWh | kilo-watt hour | |
| MPa | Mega Pascals | |
| MVA | Mega Volt-Ampere | |
| Ma | Mega-annum, million years (geology) | |
| m | metre | |
| masl | metres above sea level | |
| mH | metres height | |
| mL | metres length | |
| m/s | metres per second | |
| mRL | metres reduced level | |
| mW | metres width | |
| µm | Micrometre | |
| mm | millimetre | |
| Mt | million tonnes | |
| Mtpa | million tonnes per annum | |
| ppm | parts per million | |
| lb | pound (weight) | |
| s | second | |
| koz | thousand ounces (troy) | |
| ktpa | thousand tonnes per annum | |
| t | tonne | |
| TKM | tonne-kilometre | |
| t/m3 | tonnes per cubic metre (density) | |
| tph | tonnes per hour | |
| oz | troy ounce | |
| USD | United States Dollar | |
| wmt | wet metric tonne |
| Effective Date January 1, 2021 | Aris Gold | |||
| Page A7 of A7 |
| SRK Consulting | Soto Norte NI 43-101 – Feasibility Study |
APPENDIX
A QP Certificates
| Effective Date January 1, 2021 | Aris Gold | |||
| Page B1 of B1 |
| SRK Consulting (UK) Limited 5th Floor Churchill House 17 Churchill Way Cardiff CF10 2HH Wales, United Kingdom E-mail: enquiries@srk.co.uk URL: www.srk.com Tel: + 44 (0) 2920 348 150 |
CERTIFICATE OF QUALIFIED PERSON
I, Christopher Bray, B.Eng, MAusIMM (CP) do hereby certify that:
| 1. | I am a Principal Consultant (Mining Engineer) of SRK Consulting (UK) Limited, 5th Floor, Churchill House, 17 Churchill Way, Cardiff, United Kingdom. |
| 2. | This certificate applies to the technical report titled “NI 43-101 Technical Report Feasibility Study of the Soto Norte Gold Project, Santander, Colombia” with an Effective Date of January 01, 2021 (the “Technical Report”). |
| 3. | I graduated with a degree in Mining Engineering from Curtin University of Technology, Western Australia in 1997. I have worked as a Mining Engineer for a total of 23 years since my graduation from university and have been employed by SRK Consulting since October 2006 during which time I have been involved in a variety of engineering studies, valuations and technical reports and taken responsibility for mining and Mineral Reserve reporting aspects. I am a member of the Australian Institution of Materials Mining and Metallurgy (Membership Number 990571) and I am a Chartered Professional. |
| 4. | I have read the definition of “qualified person” set out in National Instrument 43-101 Standards of Disclosure for Mineral Projects (“NI 43-101”) and certify that by reason of my education, affiliation with a professional association (as defined in NI 43-101) and past relevant work experience, I fulfil the requirements to be a “qualified person” for the purposes of NI 43-101. |
| 5. | I visited the Soto Norte property on 10 March 2015 for 2 days and 29 February 2016 for 2 days. |
| 6. | I am responsible for Sections 1 through 6, 15, 16 and 18 through to 27. |
| 7. | I am independent of Aris Gold Corporation as described in section 1.5 of NI 43-101. |
| 8. | I have not had prior involvement with the property that is the subject of the Technical Report. |
| 9. | I have read NI 43-101 and Form 43-101F1 and the sections of the Technical Report I am responsible for have been prepared in compliance with that instrument and form. |
| 10. | As of the aforementioned Effective Date, to the best of my knowledge, information and belief, the sections of the Technical Report I am responsible for contain all scientific and technical information that is required to be disclosed to make the Technical Report not misleading. |
Dated this 21st Day of March, 2022.
| Signed |
/s/ Christopher Bray |
Sealed |
[Christopher Bray Seal] | |||
|
Christopher Bray, B.Eng, MAusIMM (CP) |
||||||
| Principal Consultant (Mining Engineer) |
||||||
| [ISO 9001:2015 Quality Assured Company logo] | Registered Address: 21 Gold Tops, City and County of Newport, NP20 4PG, | Group Offices: Africa | ||
| Wales, United Kingdom. | Asia | |||
| SRK Consulting (UK) Limited Reg No 01575403 (England and Wales) | Australia | |||
| Europe | ||||
| North America | ||||
| South America |
| SRK Consulting (U.S.), Inc. 999 17th Street, Suite 400 Denver, CO USA 80202
T: 303.985.1333 F: 303.985.9947
denver@srk.com www.srk.com |
CERTIFICATE OF QUALIFIED PERSON
I, Benjamin Parsons, MSc, MAusIMM (CP) do hereby certify that:
| 1. | I am a Principal Consultant (Resource Geology) of SRK Consulting (U.S.), Inc., 1125 Seventeenth Street, Suite 600, Denver, CO, USA, 80202. |
| 2. | This certificate applies to the technical report titled “NI 43-101 Technical Report Feasibility Study of the Soto Norte Gold Project, Santander, Colombia” with an Effective Date of January 01, 2021 (the “Technical Report”). |
| 3. | I graduated with a degree in Exploration Geology from Cardiff University, UK in 1999. In addition, I have obtained a Masters degree (MSc) in Mineral Resources from Cardiff University, UK in 2000 and have worked as a geologist for a total of 16 years since my graduation from university. I am a member of the Australian Institution of Materials Mining and Metallurgy (Membership Number 222568) and I am a Chartered Professional. |
| 4. | I have read the definition of “qualified person” set out in National Instrument 43-101 Standards of Disclosure for Mineral Projects (“NI 43-101”) and certify that by reason of my education, affiliation with a professional association (as defined in NI 43-101) and past relevant work experience, I fulfill the requirements to be a “qualified person” for the purposes of NI 43-101. |
| 5. | I visited the Soto Norte property on 24 July 2017 for 4 days and undertook two separate earlier site visits in February and August 2016. |
| 6. | I am responsible for property, geology, and mineral resources and authoring Sections 7 through 12 and 14. |
| 7. | I am independent of Aris Gold Corporation as described in section 1.5 of NI 43-101. |
| 8. | I have been involved with the property since 2016 as part of preparation of early-stage studies which inform the feasibility study and Technical Report. |
| 9. | I have read NI 43-101 and Form 43-101F1 and the sections of the Technical Report I am responsible for have been prepared in compliance with that instrument and form. |
| 10. | As of the aforementioned Effective Date, to the best of my knowledge, information and belief, the sections of the Technical Report I am responsible for contain all scientific and technical information that is required to be disclosed to make the Technical Report not misleading. |
Dated this 21st Day of March, 2022.
| /s/ Benjamin Parsons |
[Benjamin Parsons Seal] | |||
| Benjamin Parsons, MSc, MAusIMM |
|
|||
| Principal Consultant (Resource Geology) |
||||
| BP | QP Certificate Ben Parsons dated March 21.docx |
| SRK Consulting (UK) Limited 5th Floor Churchill House 17 Churchill Way Cardiff CF10 2HH Wales, United Kingdom E-mail: enquiries@srk.co.uk URL: www.srk.com Tel: + 44 (0) 2920 348 150 |
CERTIFICATE OF QUALIFIED PERSON
I, John Willis, BE, PhD, MAusIMM(CP) do hereby certify that:
| 1. | I am a Principal Consultant (Mineral Processing) of SRK Consulting (UK) Limited, 5th Floor, Churchill House, 17 Churchill Way, Cardiff, United Kingdom. |
| 2. | This certificate applies to the technical report titled “NI 43-101 Technical Report Feasibility Study of the Soto Norte Gold Project, Santander, Colombia” with an Effective Date of January 01, 2021 (the “Technical Report”). |
| 3. | I graduated with a BE in Metallurgical Engineering from the University of Queensland, Australia in 1985, and a PhD in Minerals Process Engineering from the same institution in 1994. I have worked as a Mineral Processing Engineer for in excess of 30 years since my graduation from university and have been employed by SRK Consulting since January 2008 during which time I have been involved in a variety of engineering studies, valuations and technical reports. I am a Member and Chartered Professional of the Australian Institution of Materials Mining and Metallurgy. |
| 4. | I have read the definition of “qualified person” set out in National Instrument 43-101 Standards of Disclosure for Mineral Projects (“NI 43-101”) and certify that by reason of my education, affiliation with a professional association (as defined in NI 43-101) and past relevant work experience, I fulfil the requirements to be a “qualified person” for the purposes of NI 43-101. |
| 5. | I have not visited the Soto Norte property. |
| 6. | I am responsible for the independent audit and review of mineral processing and metallurgical testwork and recovery methods provided in Sections 13 and 17. |
| 7. | I am independent of Aris Gold Corporation as described in section 1.5 of NI 43-101. |
| 8. | I have not had prior involvement with the property that is the subject of the Technical Report. |
| 9. | I have read NI 43-101 and Form 43-101F1 and the sections of the Technical Report I am responsible for have been prepared in compliance with that instrument and form. |
| 10. | As of the aforementioned Effective Date, to the best of my knowledge, information and belief, the sections of the Technical Report I am responsible for contain all scientific and technical information that is required to be disclosed to make the Technical Report not misleading. |
Dated this 21st Day of March, 2022.
| Signed |
Sealed [John Willis Seal] | |
| /s/ John Willis |
||
| John Willis, BE, PhD, MAusIMM(CP) |
||
| Principal Consultant (Mineral Processing) |
| [ISO 9001:2015 Quality Assured Company logo] | Registered Address: 21 Gold Tops, City and County of Newport, NP20 4PG, | Group Offices: Africa | ||
| Wales, United Kingdom. | Asia | |||
| SRK Consulting (UK) Limited Reg No 01575403 (England and Wales) | Australia | |||
| Europe | ||||
| North America | ||||
| South America |
| Sustainable Mine Development Global Mining & Metallurgy SNC-LAVALIN INC. 195 The West Mall, Toronto Ontario, Canada M9W 6N9
Telephone: (416) 252-5311 Fax: (416) 231-5356 |
CERTIFICATE OF QUALIFIED PERSON
Henri P. Sangam, PhD, P.Eng.
SNC-Lavalin Inc.
195 The West Mal, Toronto, Ontario
I, Henri P. Sangam, P.Eng. residing at 548 Hyacinthe Blvd, Mississauga, Ontario, do hereby certify that:
| 1. | I am a Consultant (Geotechnical Engineer) under contract with SNC-Lavalin Inc., located at 195 The West Mal, Toronto. Ontario. |
| 2. | I graduated with a B.Eng in Civil Engineering (Construction) from Université de Lomé (Togo) in 1989, B.Sc. A Geotechnical Engineering from Université de Moncton in 1995, M.Sc. A Geotechnical Engineering from Université de Moncton in 1996 and a Ph.D. in Geo-Environmental Engineering from University of Western Ontario in 2001. |
| 3. | I have been employed as a Field Engineer with SATOM (1989-1991), Geo-environmental Research Associate with Geotechnical Research Center (2001-2002), Geotechnical/Geoenvironmental Engineer with SNC-Lavalin (2002-2019), Consultant Geotechnical Engineering with SNC-Lavalin (2020) and I have over 25 years of experience in the relevant area. |
| 4. | I am a P.Eng. registered with the Professional Engineers of Ontario (PEO) #100053196 and have practiced my profession on a continuous basis since 2001. |
| 5. | I have read the definition of “qualified person” set out in National Instrument 43-101 (NI 43-101) and certify that by reason of my education, afiliation with a professional association (as defined in NI 43-101) and past relevant work experience, I fulfil the requirements to be a “qualified person” for the purposes of NI 43-101. |
| 6. | l am a co-author of Technical to the technical report titled “NI 43-101 Technical Report Feasibility Study of the Soto Norte Gold Project, Santander, Colombia” with an Effective Date of January 01, 2021 (the “Technical Report’). lam responsible for Section 18.6. |
| 7. | I visited the Soto Norte property on 29 February 2016 for 2 days. |
| 8. | I am independent of the issuer applying all of the tests in section 1.5 of NI 43-101. |
| 9. | I have not had prior involvement with the property that is the subject of the Technical Report. |
| 10. | I have read NI 43-101 and Form 43-101F1 and the sections of t e Technical Report I am responsible for have been prepared in compliance with that instrument and form. |
| 11. | As of the aforementioned Effective Date, to the best of my knowledge, information and belief, the sections of the Technical Report I am responsible for contains all scientific and technical information that is required to be disclosed to make the Technical Report not misleading. |
| 12. | I consent to the filling of the Technical Report with any stock exchange and other regulatory authority and any publication by them for regulatory purposes, including electronic publication in the public company files on their websites accessible by the public, of the technical Report. |
Dated at To (Canada), this 21st Day of March, 2022.
| [Henri P. Sangram Seal] | Respectfully Submitted,
/s/ Henri P. Sangram
Henri P. Sangam, PhD, P.Eng. | |
| Member of the SNC ¨ LAVALIN Group | ||
| Minesa Soto Norte Project |
CERTIFICATE OF QUALIFIED PERSON
I, Robert Anderson, B.A.Sc., P. Eng. do hereby certify that:
| 1. | I am the Process Specialist for Minesa’s Soto Norte Gold Project, Transversal Oriental No. 90-102, Torre Empresarial Cacique Piso 11, Bucaramanga, Santander, Cod . Postal 680003 Colombia . |
| 2. | This certificate applies to the technical report titled “NI43-101 Technical Report Feasibility Study of the Soto Norte Gold Project, Santander, Colombia” with an Effective Date of January 01, 2021 (the “Technical Report~). |
| 3. | I graduated with a Bachelor of Applied Science in Metallurgical Engineering from The University British Columbia, Canada in 1987. I have worked as a Process Engineer for a total of 33 years since my graduation from university and have been employed by Minesa since May 2019 during which time I have been involved in a variety of engineering projects for the company, valuations and technical reports and taken responsibility for all Process Engineering reporting aspects. As of this writing I am still employed by Minesa in the same capacity as a contractor. I am a Professional Engineer licensed by both Engineers and Geoscientists British Columbia (License Number 192117) and Professional Engineers Ontario (License Number 100025874). |
| 4. | I have read the definition of “qualified person” set out in National Instrument 43-101 Standards of Disclosure for Mineral Projects (“NI 43-101 “) and certify that by reason of my education, affiliation with a professional association (as defined in Nl 43-101) and past relevant work experience, I fulfil the requirements to be a “qualified person” for the purposes of Nl 43-1 01 . |
| 5. | I worked in Minesa’s main office in Bucaramanga for 8 months in 2019 and visited the Soto Norte property several times for various reasons. The most recent visit was on August 14, 2019 to participate in an EPCM bidders site visit as a representative of Mlnesa . |
| 6. | I am responsible for Sections 13 and 17. |
| 7. | I am not independent of Aris Gold Corporation as described in section 1.5 of Nl 43-1 01 . |
| 8. | I have had prior involvement with the property that is the subject of the Technical Report. I have been employed as the Process Specialist for the Soto Norte Gold Project since May 2019. |
| 9. | I have read N143-101 and Form 43-101F1 and the sections of the Technical Report I am responsible for have been prepared in compliance with that instrument and form. |
| 10. | As of the aforementioned Effective Date, to the best of my knowledge, information and belief, the sections of the Technical Report I am responsible for contain all scientific and technical information that is required to be disclosed to make the Technical Report not misleading . |
Dated this 21st Day of March, 2022
| Signed /s/ Robert Anderson
|
Sealed
[Robert Anderson Seal] | |||
| Robert Anderson, B.A,Sc.,P. Eng. |
||||
| Process Specialist, Minesa |
| SEOE PRINCIPAL | ||||
| Transversal Oriental 90 -102 | T +57 (7) 697 1200 | |||
| Torre Empresarial Cacique Piso 11 | Cod. Postal 680003 | |||
| BUCARAMANGA- COLOMBIA |
| SRK Consulting | Soto Norte NI 43-101 – Feasibility Study |
APPENDIX
B Process Plant Flow Diagram
| Effective Date January 1, 2021 | Aris Gold | |||
| Page B1 of B1 |
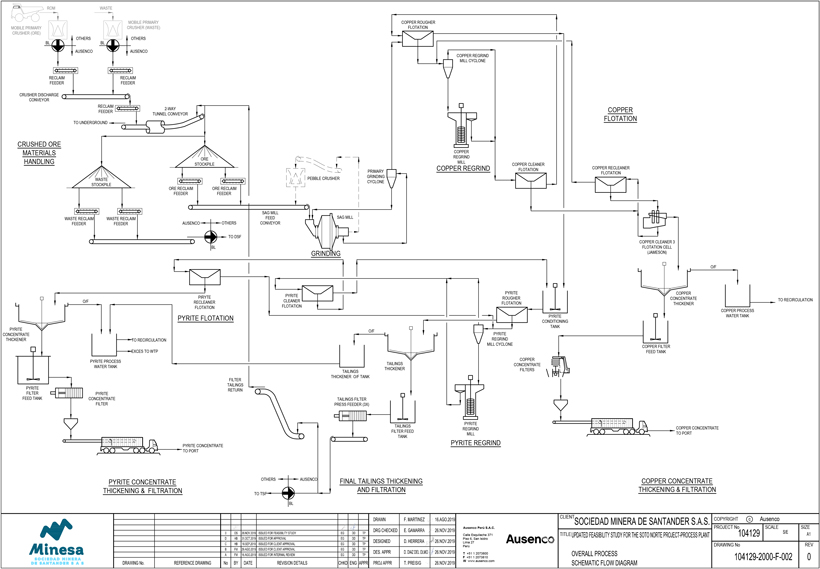
| SRK Consulting | Soto Norte NI 43-101 – Feasibility Study |
APPENDIX
C Water Balance for Operation Phase (Average Operation and
Average Climatic Conditions)
| Effective Date January 1, 2021 | Aris Gold | |||
| Page C1 of C2 |
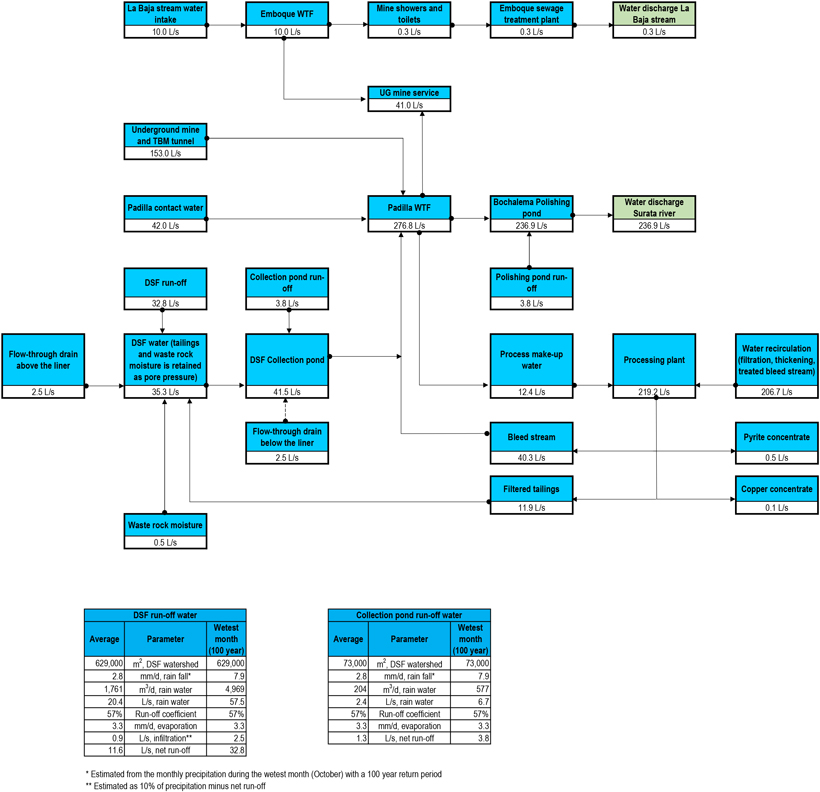
| SRK Consulting | Soto Norte NI 43-101 – Feasibility Study |
APPENDIX
D Environmental Licence Application Evaluation Process (ERM,
BESIA, 2018)
| Effective Date January 1, 2021 | Aris Gold | |||
| Page C2 of C2 |
| Bankable Environmental and Social Impact Assessment Minesa Soto Norte Underground Gold Mining Development Project |
Chapter 2 Institutional and Regulatory Framework |
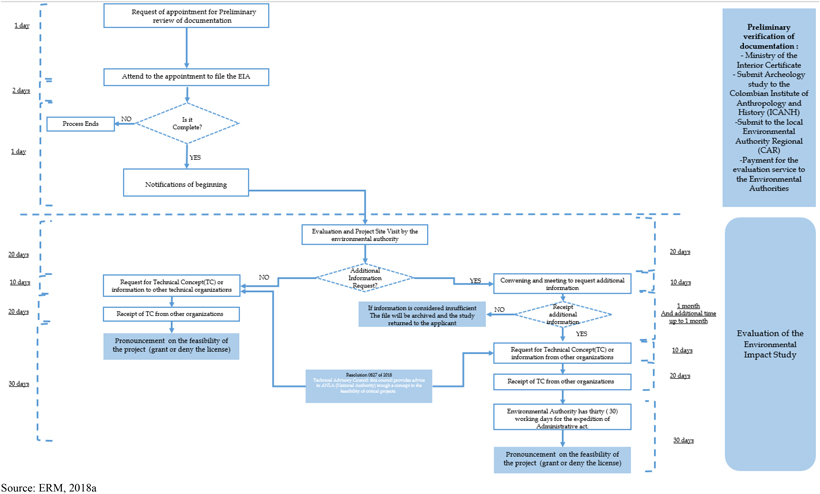
Figure 2.2-1: Procedure to Obtain an Environmental License
| 2-3 | ||||